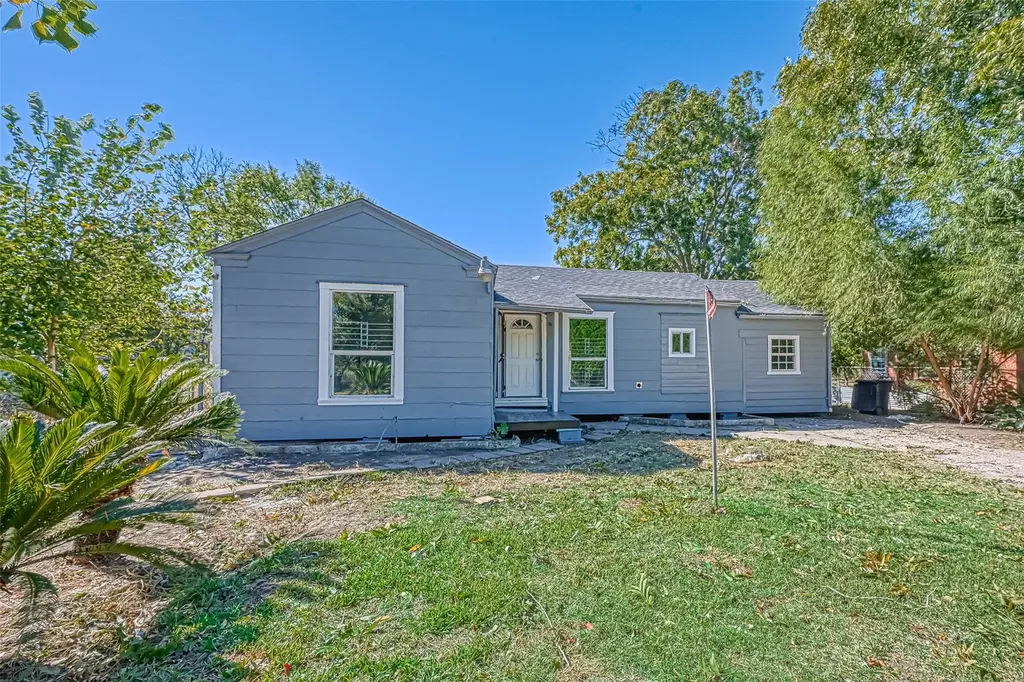
4118 Sunflower St · Houston, TX
Flood risk 3/10 · Minor
- FEMA flood zone
- X (unshaded)
- Chance of flooding over 30 yrs
- 0.2%
- Est. flood insurance / yr
- $507 – $1,088
Fire risk 1/10 · Minimal
- Est. fire insurance / yr
- $1,222 – $2,270
Heat risk 9/10 · Severe
- Hot days now (above 109°F)
- 7 days/yr
- Hot days in 30 yrs
- 22 days/yr
Wind risk 9/10 · Severe
- Chance of severe wind over 30 yrs
- 99.0%
Air-quality risk 2/10 · Minimal
- Unhealthy air days now
- 2 days/yr
- Unhealthy air days in 30 yrs
- 2 days/yr
Risk factors via First Street. Map © Google.
Why this score? — see what drove the B grade
The composite is a weighted blend of 9 inputs, each scored 0–100. Each bar is that input's sub-score; the figure is the points it added to the 100-point composite (weight × sub-score).
- Cash flow +23.2/30.0
- ARV discount +15.0/15.0
- Appreciation +10.0/10.0
- DSCR +7.5/10.0
- 1% rule +5.9/10.0
- Rent growth +3.7/5.0
- Livability +3.7/5.0
- Schools +2.7/10.0
- Condition / age +2.5/5.0
$210,000
🖨 Deal sheet 📄 Offer letter ✓ Due diligence
Listing remarks MLS
* * MULTIPLE OFFERS HAVE BEEN RECEIVED!! PLEASE SUBMIT YOUR HIGHEST AND BEST OFFER ASAP * * * LISTING WILL BE UPDATED IMMEDIATELY UPON ACCEPTANCE OF OFFER!! HUGE LOT IN AN ESTABLISHED NEIGHBORHOOD! PERFECT LOT TO BUILD YOUR DREAM HOME!! MOTIVATED SELLERS !! PROPERTY IS BEING SOLD AS IS. SELLERS WILL MAKE NO REPAIRS. ENTER PROPERTY AT YOUR OWN RISK DUE TO PEST INFESTATION! CALL FOR MORE INFORMATION TODAY! BUYER TO VERIFY ALL ROOM DIMENSIONS AND AREA SCHOOLS! SHORT DISTANCE TO MEDICAL CENTER, DOWNTOWN, U OF H, AND TEXAS SOUTHERN UNIVERSITY!! DON'T LET THIS ONE GET AWAY!!!
Key facts
- 0.32 acre lot
- Built 1945
- Listed 41 days
Property features AI
Exterior
- Utilities: Public water; Public sewer
- Home design: Residential property; One-story; Slab foundation
- Construction: Built in 1945; Composition roof; Construction materials: Unknown
- Exterior features: Located in a subdivision; Lot is approximately 0.32 acres (14,000 sq ft)
Interior
- Bedrooms: Primary bedroom on the first floor (13x11); Three additional bedrooms on the first floor (each 10x11)
- Bathrooms: 2 full bathrooms
- Heating & cooling: Central heating (electric and gas); Central air conditioning (electric and gas)
- Interior features: 4 total rooms
Neighborhood map
What this means for you Summary
Snapshot
- This is a 3-bed/1.0-bath single-family listed at $210k.
Deal economics
- At list price, monthly cash flow is $380 ($5k/yr) — positive.
- The deal already cash-flows at list — no discount required.
- Meets the 1% rule at list price ($2k rent vs $210k).
- Recommended offer: $204k (3.0% below list) — sets the bar for market timing.
- Cap rate 8.5% vs local median 3.2% in Houston — top-decile yield for the area; either an underpriced asset or a hidden risk that comps aren't pricing in. Stress-test before assuming the spread holds.
Location & tenants
- Location reads 74/100 on livability (#184 in TX, #4,771 nationally) — a middle-class / working-renter tenant base. Strengths: amenities A+, cost of living A+, housing A+; Watch: crime F.
- Houston ISD (urban): math 27% / reading 35% proficiency, ranked #593 of 826 in TX (top 72%) — families likely to look elsewhere, expect single-tenant / working-renter base with shorter leases; 71% free/reduced lunch — lower-income household profile, screen leases tightly.
- Zoned schools: Attucks Middle (math 15% / reading 22%, grade F, #1,478 of 1,662 statewide, top 90%, 439 students, 98% FRL); Worthing H S (math 22% / reading 21%, grade F, #1,377 of 1,632 statewide, top 85%, 827 students, 96% FRL) — zoned schools average 97% FRL vs 71% district-wide (26 pts higher); higher-poverty schools than district average — tighter screening recommended.
- Market conditions: Rents rising fast (+4.8%/yr); 312 active listings in the ZIP; 40 comparable units currently listed for rent nearby; rentals at typical pace (median 24d on market — plan ~3-4 weeks tenant-placement turnaround); 48% of comp listings sitting > 30 days — soft ceiling on asking rent; lower-income renter base — watch delinquency; 29,883 units permitted in Harris County in 2024 (8,621 in 5+ unit buildings).
Forward outlook
- In year one you build about $22k of equity ($1k loan paydown + $21k appreciation (10.0% local appreciation)).
- Harris County population projected at +47% by 2050 — long-run rental-demand tailwind backs the buy-and-hold thesis.
- At projected returns (10.0% appreciation + 4.8% rent growth), your $59k cash investment doubles in ~3 years — after that, you're playing with house money.
- By year 2, paydown + projected appreciation supports a ~$36k cash-out refi (75% LTV) — recoverable capital for the next deal without selling this one.
Negotiation context
- It's been on market 41 days — a 3% lower offer ($204k) is reasonable based on typical stale-listing flexibility.
- 4 sale attempts since 8y ago; this cycle's ask is 10669% above the opening price — seller raised mid-cycle; expect resistance to lowballs.
Risks & watch-outs
- Watch-outs: built in 1945 — expect roof / HVAC / electrical / plumbing capex.
- Climate carrying-cost: severe wind risk, 99% chance of damaging wind over 30y; extreme-heat days projected 7→22/yr by 2055 (HVAC capex compounding) — expect insurance premiums to compound above CPI over the hold.
Questions for the listing agent
- It's been on market 41 days. Have you received any prior offers? Is the seller open to a 3% concession, seller financing, or rate buy-down credit?
- Built in 1945 — when were the roof, HVAC, electrical panel, plumbing, and water heater last replaced?
- Is there a deadline driving the sale (1031 exchange, divorce, estate, relocation)? That informs how much negotiation room exists.
- Schools are D-rated, which usually means shorter tenancies and higher turnover. Who's the typical renter profile here, and what's been the actual vacancy rate?
- Crime grade is F in this area — have there been break-ins, vandalism, or insurance claims at this property in the last 3 years? What carrier currently insures it and at what premium?
- What's the average days-on-market for RENTAL listings here right now (not sales)? A rising rental-DOM trend means longer vacancies and softer asking-rent achievability than the comps imply.
- What's the recent tenant-quality profile in this submarket — average credit score on applications, eviction rate, late-payment / NSF rate, and stable-employment percentage? A property-management company in the area should have these aggregated.
- How much new for-sale + rental construction is in the pipeline within 1–3 miles? Heavy new supply typically softens prices + rents 12–24 months out; constrained supply supports both.
Investment metrics
- 1% rule
- 1.09% ✓
- Cap rate
- 8.47%
- Cash-on-cash
- 7.76%
- DSCR
- 1.35
- GRM
- 7.7
CMA / ARV
- ARV (median comp)
- $298,176
- List price
- $210,000
- Delta
- -29.57%
- Verdict
- UNDERPRICED
- Comps
- 20 within 1.0 mi
Show comp detail 12 sales within ~0.75 mi
| Address | Dist | Beds/Ba | Sqft | Sold | Price | $/sf | Match |
|---|---|---|---|---|---|---|---|
| 4423 Stassen St | 0.19mi | 2/2.0 (-1) | 1,188 (-9%) | 8mo | $149,000 | $125 | 60 |
| 8436 Lawler St | 0.54mi | 3/2.0 | 1,334 (+2%) | 9mo | $177,900 | $133 | 60 |
| 3902 Aledo St | 0.43mi | 3/1.0 | 1,176 (-10%) | 4mo | $90,000 | $77 | 59 |
| 4211 Knoxville St | 0.51mi | 4/2.0 (+1) | 1,288 (-2%) | 7mo | $179,900 | $140 | 59 |
| 3802 Rebecca St | 0.66mi | 3/2.0 | 1,348 (+3%) | 4mo | $189,000 | $140 | 57 |
| 8230 Woodward St | 0.55mi | 3/2.0 | 1,347 (+3%) | 10mo | $155,000 | $115 | 57 |
| 8002 Colonial Ln | 0.32mi | 3/2.0 | 1,447 (+10%) | 9mo | $235,000 | $162 | 56 |
| 3928 Mckinley St | 0.16mi | 3/2.5 | 1,478 (+13%) | 13mo | $235,000 | $159 | 54 |
| 4525 Newberry St | 0.43mi | 3/2.0 | 1,176 (-10%) | 8mo | $245,000 | $208 | 53 |
| 4410 Knoxville St | 0.57mi | 3/2.0 | 1,188 (-9%) | 13mo | $150,000 | $126 | 43 |
| 3846 Lydia St | 0.68mi | 3/2.0 | 1,164 (-11%) | 7mo | $165,000 | $142 | 40 |
| 8015 Cannon St | 0.75mi | 2/1.0 (-1) | 1,114 (-15%) | 11mo | $175,000 | $157 | 26 |
Match score weights: distance 35% · size 25% · config 20% · recency 20%. Top-matched comps best support the ARV.
Projected returns pro-forma
10.0% appreciation · 4.77% rent growth · sell at horizon
- IRR
- 30.7%
- Equity multiple
- 3.43×
- Total profit
- $142,761
- Equity at exit
- $189,185
- IRR
- 27.1%
- Equity multiple
- 7.98×
- Total profit
- $410,433
- Equity at exit
- $407,984
Cash invested: $58,800 (down + closing). Projections, not guarantees.
Landlord ↔ Tenant lean methodology
- Overall (STATE)
- 87 Strongly Landlord-Friendly
- State Texas
- 87 Strongly Landlord-Friendly · R+5
- County
- — inherits STATE
- City
- — inherits STATE
ZIP-level market 77051
- Home prices YoY
- 9.7%
- Rents YoY
- 4.8%
- Active inventory
- 312
- Price-to-rent
- 7.7×
Monthly cashflow live
- Estimated rent
- $2,287 high interval (Pro) →
- Mortgage (P&I)
- −$1,101
- Tax from tax record
- −$238 /mo · $2,851/yr
- Insurance
- −$88
- HOA
- −$0
- Vacancy / Maint / Mgmt
- −$480
- Net cashflow
- $380
Break-even live
UW: 25.0% down · 7.5% · 30yr · 1.5% tax · 5.0% vac · 8.0% maint · 8.0% mgmt
Financing live
Cash to close
- Down payment
- $52,500
- Closing costs
- $6,300
- Reserves months
- —
- Total cash needed
- —
Loan-product check · same deal, 3 products live
Conventional
25% down · 7.5% · 30yr
- Down + closing
- —
- Monthly P&I
- —
- Monthly cashflow
- —
- DSCR
- —
- Eligible?
- —
Personal DTI + credit; lowest rate.
DSCR
20% down · 8.5% · 30yr
- Down + closing
- —
- Monthly P&I
- —
- Monthly cashflow
- —
- DSCR
- —
- Eligible?
- —
No personal income docs; deal must DSCR.
Hard money
10% down · 12.0% · 12mo
- Down + closing
- —
- Monthly P&I
- —
- Monthly cashflow
- —
- DSCR
- —
- Eligible?
- —
Short-term bridge; refi at stabilization.
Rent comps 40 comps
| Address | Beds | Baths | Sqft | Rent | $/sqft | DOM | Units | Dist |
|---|---|---|---|---|---|---|---|---|
| 4117 Shelby Cir Unit 1230900P Houston, TX | 4.0 | 2.0 | 1367 | $5,355 | $3.92 | 2d | 1 | 0.19mi |
| 3620 Du Bois St Unit 1302349P Houston, TX | 3.0 | 2.5 | 1797 | $2,945 | $1.64 | 3d | 1 | 0.34mi |
| 4406 Sterling St Houston, TX | 3.0 | 2.5 | 1840 | $1,999 | $1.09 | 16d | 1 | 0.36mi |
| 8328 Corinth St Unit B Houston, TX | 3.0 | 2.5 | 1500 | $2,800 | $1.87 | 20d | 1 | 0.41mi |
| 8010 Livingston St Houston, TX | 3.0 | 2.0 | 1400 | $1,800 | $1.29 | 43d | 1 | 0.47mi |
| 4601 White Rock St Unit A Houston, TX | 3.0 | 2.5 | 1700 | $2,500 | $1.47 | 43d | 1 | 0.48mi |
| 7806 Comal St Unit B Houston, TX | 3.0 | 2.5 | 1800 | $2,200 | $1.22 | 43d | 1 | 0.48mi |
| 4609 Bricker St Unit ABC Houston, TX | 3.0 | 2.5 | 1375 | $3,500 | $2.55 | 11d | 1 | 0.50mi |
| 4609 Bricker St Unit C Houston, TX | 2.0 | 1.5 | 1100 | $3,200 | $2.91 | 12d | 1 | 0.50mi |
| 4609 Bricker St Unit B Houston, TX | 3.0 | 2.5 | 1300 | $3,500 | $2.69 | 12d | 1 | 0.50mi |
| 8521 Dosia St Houston, TX | 3.0 | 2.0 | 1028 | $1,665 | $1.62 | 12d | 1 | 0.51mi |
| 4613 Bricker St Unit B Houston, TX | 3.0 | 2.5 | 1600 | $2,300 | $1.44 | 43d | 1 | 0.52mi |
| 4530 Mayflower St Houston, TX | 3.0 | 2.0 | 1302 | $1,800 | $1.38 | 43d | 1 | 0.53mi |
| 4514 Galesburg St Unit B Houston, TX | 3.0 | 2.5 | 1680 | $3,500 | $2.08 | 24d | 1 | 0.60mi |
| 8107 Calhoun Rd Houston, TX | 3.0 | 2.5 | 1304 | $2,250 | $1.73 | 24d | 1 | 0.63mi |
| 4526 Knoxville St Unit A Houston, TX | 3.0 | 2.5 | 1474 | $1,775 | $1.20 | 15d | 1 | 0.66mi |
| 7321 Conley St Unit B Houston, TX | 3.0 | 2.0 | 1501 | $2,025 | $1.35 | 20d | 1 | 0.73mi |
| 7321 Conley St Unit A Houston, TX | 3.0 | 2.5 | 1869 | $2,025 | $1.08 | 20d | 1 | 0.73mi |
| 3846 Seabrook St Houston, TX | 3.0 | 3.5 | 1833 | $2,300 | $1.25 | 43d | 1 | 0.79mi |
| 3732 Seabrook St Houston, TX | 3.0 | 2.5 | 1727 | $2,350 | $1.36 | 24d | 1 | 0.86mi |
| 3655 Seabrook St Unit 6 Houston, TX | 2.0 | 1.0 | 1600 | $1,000 | $0.62 | 43d | 1 | 0.91mi |
| 4538 Clover St Houston, TX | 4.0 | 2.0 | 1768 | $1,595 | $0.90 | 43d | 1 | 0.95mi |
| 7710 Darnay Dr Houston, TX | 3.0 | 3.0 | 1635 | $2,095 | $1.28 | 43d | 1 | 1.03mi |
| 7032 Conley St Houston, TX | 3.0 | 2.0 | 1220 | $2,850 | $2.34 | 43d | 1 | 1.06mi |
| 3137 W Bellfort Ave Houston, TX | 2.0 | 2.0 | 1164 | $1,802 | $1.55 | 43d | 1 | 1.06mi |
| 7918 Jutland Rd Houston, TX | 3.0 | 1.0 | 996 | $1,295 | $1.30 | 43d | 1 | 1.07mi |
| 7358 Guadalcanal Rd Houston, TX | 3.0 | 3.0 | 1768 | $2,195 | $1.24 | 43d | 1 | 1.10mi |
| 4723 Mallow St Houston, TX | 3.0 | 2.5 | 1472 | $1,850 | $1.26 | 5d | 1 | 1.11mi |
| 5222 Northridge Dr Houston, TX | 4.0 | 2.0 | 1300 | $1,850 | $1.42 | 24d | 1 | 1.24mi |
| 4705 Idaho St Houston, TX | 3.0 | 2.5 | 1664 | $2,500 | $1.50 | 17d | 1 | 1.30mi |
| 2889 Reed Rd Houston, TX | 1.0–2.0 | 1.0–2.0 | 997 | $1,648 | $1.65 | 2d | 2 | 1.32mi |
| 8181 El Mundo St Houston, TX | 1.0–3.0 | 1.0–2.5 | 1356 | $2,262 | $1.67 | 1d | 47 | 1.32mi |
| 8181 El Mundo St Houston, TX | 1.0–3.0 | 1.0–2.0 | 1241 | $2,041 | $1.64 | 24d | 18 | 1.32mi |
| 4942 Bataan Rd Unit 77033 Houston, TX | 4.0 | 2.0 | 1350 | $1,800 | $1.33 | 43d | 1 | 1.33mi |
| 3088 Holly Hall St Unit 1 Houston, TX | 2.0 | 2.5 | 1600 | $1,750 | $1.09 | 15d | 1 | 1.33mi |
| 2968 Holly Hall St Houston, TX | 2.0 | 3.0 | 1600 | $2,000 | $1.25 | 43d | 1 | 1.35mi |
| 5314 Longmeadow St Houston, TX | 3.0 | 3.0 | 1646 | $1,900 | $1.15 | 43d | 1 | 1.40mi |
| 2924 Holly Hall St Houston, TX | 2.0 | 3.0 | 1600 | $1,950 | $1.22 | 43d | 1 | 1.40mi |
| 5036 Mallow St Houston, TX | 3.0 | 3.0 | 1472 | $2,050 | $1.39 | 43d | 1 | 1.41mi |
| 4810 Wilmington St Unit A Houston, TX | 3.0 | 2.0 | 1165 | $1,650 | $1.42 | 43d | 1 | 1.43mi |
Listing history 22 events
-
2026-06-18days on market $210,000 Active 41 DOM
-
2026-06-17days on market $210,000 Active 40 DOM
-
2026-06-16days on market $210,000 Active 39 DOM
-
2026-06-15days on market $210,000 Active 38 DOM
-
2026-06-13days on market $210,000 Active 36 DOM
-
2026-06-10days on market $210,000 Active 32 DOM
-
2026-06-08days on market $210,000 Active 31 DOM
-
2026-06-07days on market $210,000 Active 30 DOM
-
2026-06-04days on market $210,000 Active 27 DOM
-
2026-06-01days on market $210,000 Active 24 DOM
-
2026-05-31days on market $210,000 Active 23 DOM
-
2026-05-14$1,950
-
2026-05-08$210,000 Active 846-char remark
-
2026-03-27historical
-
2026-03-10$210,000 Active
-
2019-02-16historical
Show marketing remark (587 chars)
* * MULTIPLE OFFERS HAVE BEEN RECEIVED!! PLEASE SUBMIT YOUR HIGHEST AND BEST OFFER ASAP * * * LISTING WILL BE UPDATED IMMEDIATELY UPON ACCEPTANCE OF OFFER!! HUGE LOT IN AN ESTABLISHED NEIGHBORHOOD! PERFECT LOT TO BUILD YOUR DREAM HOME!! MOTIVATED SELLERS !! PROPERTY IS BEING SOLD AS IS. SELLERS WILL MAKE NO REPAIRS. ENTER PROPERTY AT YOUR OWN RISK DUE TO PEST INFESTATION! CALL FOR MORE INFORMATION TODAY! BUYER TO VERIFY ALL ROOM DIMENSIONS AND AREA SCHOOLS! SHORT DISTANCE TO MEDICAL CENTER, DOWNTOWN, U OF H, AND TEXAS SOUTHERN UNIVERSITY!! DON'T LET THIS ONE GET AWAY!!!
-
2019-02-15soldstatus
-
2019-02-14soldstatus Sold
Show marketing remark (587 chars)
* * MULTIPLE OFFERS HAVE BEEN RECEIVED!! PLEASE SUBMIT YOUR HIGHEST AND BEST OFFER ASAP * * * LISTING WILL BE UPDATED IMMEDIATELY UPON ACCEPTANCE OF OFFER!! HUGE LOT IN AN ESTABLISHED NEIGHBORHOOD! PERFECT LOT TO BUILD YOUR DREAM HOME!! MOTIVATED SELLERS !! PROPERTY IS BEING SOLD AS IS. SELLERS WILL MAKE NO REPAIRS. ENTER PROPERTY AT YOUR OWN RISK DUE TO PEST INFESTATION! CALL FOR MORE INFORMATION TODAY! BUYER TO VERIFY ALL ROOM DIMENSIONS AND AREA SCHOOLS! SHORT DISTANCE TO MEDICAL CENTER, DOWNTOWN, U OF H, AND TEXAS SOUTHERN UNIVERSITY!! DON'T LET THIS ONE GET AWAY!!!
-
2019-01-11status Pending
Show marketing remark (587 chars)
* * MULTIPLE OFFERS HAVE BEEN RECEIVED!! PLEASE SUBMIT YOUR HIGHEST AND BEST OFFER ASAP * * * LISTING WILL BE UPDATED IMMEDIATELY UPON ACCEPTANCE OF OFFER!! HUGE LOT IN AN ESTABLISHED NEIGHBORHOOD! PERFECT LOT TO BUILD YOUR DREAM HOME!! MOTIVATED SELLERS !! PROPERTY IS BEING SOLD AS IS. SELLERS WILL MAKE NO REPAIRS. ENTER PROPERTY AT YOUR OWN RISK DUE TO PEST INFESTATION! CALL FOR MORE INFORMATION TODAY! BUYER TO VERIFY ALL ROOM DIMENSIONS AND AREA SCHOOLS! SHORT DISTANCE TO MEDICAL CENTER, DOWNTOWN, U OF H, AND TEXAS SOUTHERN UNIVERSITY!! DON'T LET THIS ONE GET AWAY!!!
-
2019-01-09status Option Pending
Show marketing remark (587 chars)
* * MULTIPLE OFFERS HAVE BEEN RECEIVED!! PLEASE SUBMIT YOUR HIGHEST AND BEST OFFER ASAP * * * LISTING WILL BE UPDATED IMMEDIATELY UPON ACCEPTANCE OF OFFER!! HUGE LOT IN AN ESTABLISHED NEIGHBORHOOD! PERFECT LOT TO BUILD YOUR DREAM HOME!! MOTIVATED SELLERS !! PROPERTY IS BEING SOLD AS IS. SELLERS WILL MAKE NO REPAIRS. ENTER PROPERTY AT YOUR OWN RISK DUE TO PEST INFESTATION! CALL FOR MORE INFORMATION TODAY! BUYER TO VERIFY ALL ROOM DIMENSIONS AND AREA SCHOOLS! SHORT DISTANCE TO MEDICAL CENTER, DOWNTOWN, U OF H, AND TEXAS SOUTHERN UNIVERSITY!! DON'T LET THIS ONE GET AWAY!!!
-
2018-11-19$85,000 Active
Show marketing remark (587 chars)
* * MULTIPLE OFFERS HAVE BEEN RECEIVED!! PLEASE SUBMIT YOUR HIGHEST AND BEST OFFER ASAP * * * LISTING WILL BE UPDATED IMMEDIATELY UPON ACCEPTANCE OF OFFER!! HUGE LOT IN AN ESTABLISHED NEIGHBORHOOD! PERFECT LOT TO BUILD YOUR DREAM HOME!! MOTIVATED SELLERS !! PROPERTY IS BEING SOLD AS IS. SELLERS WILL MAKE NO REPAIRS. ENTER PROPERTY AT YOUR OWN RISK DUE TO PEST INFESTATION! CALL FOR MORE INFORMATION TODAY! BUYER TO VERIFY ALL ROOM DIMENSIONS AND AREA SCHOOLS! SHORT DISTANCE TO MEDICAL CENTER, DOWNTOWN, U OF H, AND TEXAS SOUTHERN UNIVERSITY!! DON'T LET THIS ONE GET AWAY!!!
-
1988-01-29soldstatus
ⓘ Source: listings_history table (triggers on properties + properties_extension) + one-shot
backfill from property_details.listing_events for pre-trigger history.
Tax reassessment forecast TX · Resets to sale price
- Current annual tax
- $2,851 · $238/mo
- Projected year-2 tax
- $3,843 · $320/mo
- Expected delta
- +$992/yr (+$83/mo · 34.8%)
ⓘ Screening estimate from a state-policy table — verify with the county assessor before closing.
Climate risk First Street
- Flood 3/10 Moderate FEMA zone X (unshaded) · 20% chance over 30 yrs
- Wildfire 1/10 Low
- Heat 9/10 Extreme 7 d/yr ≥109°F today · 22 d/yr by 30 yrs out
- Wind 9/10 Extreme 99% chance of damaging wind over 30 yrs
- Air quality 2/10 Low 2 unhealthy d/yr today · 2 by 30 yrs out
Nearby sold comps map
Loading sold comps map…
Walkable amenities ~0.75 mi
Loading nearby amenities…
Taxation est. · year 1
- Rental income
- $27,444
- − Mortgage interest
- −$11,763
- − Property taxes
- −$2,851
- − Insurance
- −$1,050
- − Repairs & maintenance
- −$2,196
- − Management
- −$2,196
- − Depreciation
- −$6,109
- Taxable income
- $1,279
- Est. tax owed @ 24.0%
- −$307
- After-tax cash flow
- $4,257/yr
For passive investors: Depreciation is non-cash, so a rental often shows a tax loss while cash-flowing — sheltering income. Rental losses are passive: they offset passive income freely, and up to $25,000/yr can offset ordinary (W-2) income if you actively participate and your MAGI is under $100k (phasing out to $0 by $150k); unused losses carry forward. On sale, claimed depreciation is recaptured at up to 25%, and gains may owe capital-gains tax (a 1031 exchange can defer both). Figures are a year-1 estimate at your 24.0% rate — not tax advice; consult a CPA.
Schools (NCES district)
- District
- Houston ISD
- NCES district ID
- 4823640
- Math proficiency
- 27% ▼ -18.00%
- Reading proficiency
- 35% ▼ -6.00%
- Median HH income
- $46,054
- Composite
- 26.63/100
- National rank
- #7173
- State rank
- #593 of 826 in TX
Livability — Houston
- Score
- 74/100
- State rank
- #184
- US rank
- #4771
Category grades
Schools grade is shown separately in the Schools card above.
Census & demographics
- Census place
- Houston, TX
- County
- Harris County · 4,702,590 people
- City population
- 3,226,434
- Metro
- Houston-The Woodlands-Sugar Land, TX
- Population (ZIP)
- 19,795
- Household income
- $37,415
- Rent vs Own
- Severe rent burden
- 1446.0
Population outlook (Harris County) Hauer SSP2
- Today (2025)
- 5,571,493 people
- By 2030
- 6,089,821 · +9.3%
- By 2040
- 7,142,806 · +28.2%
- By 2050
- 8,185,864 · +46.9%
- By 2075
- 10,574,329 · +89.8%
- By 2100
- 12,109,958 · +117.4%
Race, ethnicity, and origin ACS 2023
- Neighborhood character
- Predominantly Black (77%)
- Race & ethnicity
- Black 77% Hispanic / Latino 16% Two or more races 11% White 3%
- Hispanic origin (detail)
- Mexican 6% Puerto Rican 1%
- Foreign-born
- 8% · Canada, China
- Languages at home
- 88% English-only · Spanish 10%
Political lean MEDSL · Harris
- 2024 margin
- Lean D (+5.5) · D 52.0% · R 46.4% · Other 1.6%
- 2008→2024 swing
- +3.9pp toward D · 2008: 1.6pp · 2024: 5.5pp
- All cycles
- 2024: D+5.5 2020: D+13.3 2016: D+12.4 2012: D+0.1 2008: D+1.6
Not yet ingested
- Civics
- —
Market trends
- HPI YoY
- ▲ 16.02%
- Current HPI
- 180.4283
- Rent YoY
- ▲ 4.77%
- Metro
- Houston-The Woodlands-Sugar Land, TX
- State GDP YoY
- ▲ 3.95%
- F500 in state
- 110
Industry mix (Fortune 500 HQ in TX)
| Industry | F500 HQs | Revenue |
|---|---|---|
| Energy | 16 | $1,198B |
|
||
| Technology | 5 | $198B |
|
||
| Engineering / Construction | 4 | $72B |
|
||
| Energy Services | 3 | $60B |
|
||
| Utilities | 3 | $41B |
|
||
| Healthcare | 2 | $330B |
|
||
Price history
-97.7% since first listed11 events — show timeline
- 2026-05-14 Listed for Rent $1,950 HARMLS
- 2026-05-08 Listed $210,000 HARMLS
- 2026-03-27 Listing Removed — HARMLS
- 2026-03-10 Listed $210,000 HARMLS
- 2019-02-16 Listing Removed — HARMLS
- 2019-02-15 Sold (Public Records) — Public Records
- 2019-02-14 Sold (MLS) — HARMLS
- 2019-01-11 Pending — HARMLS
- 2019-01-09 Pending — HARMLS
- 2018-11-19 Listed $85,000 HARMLS
- 1988-01-29 Sold (Public Records) — Public Records
Property tax history
+4.8%/yrLatest (2025): $2,851 · +1.6% YoY. Source: county tax records.
Cash-flow waterfall
monthlySold comps — $/sqft
last 12 mo · ≤1 miLoading sold comps…