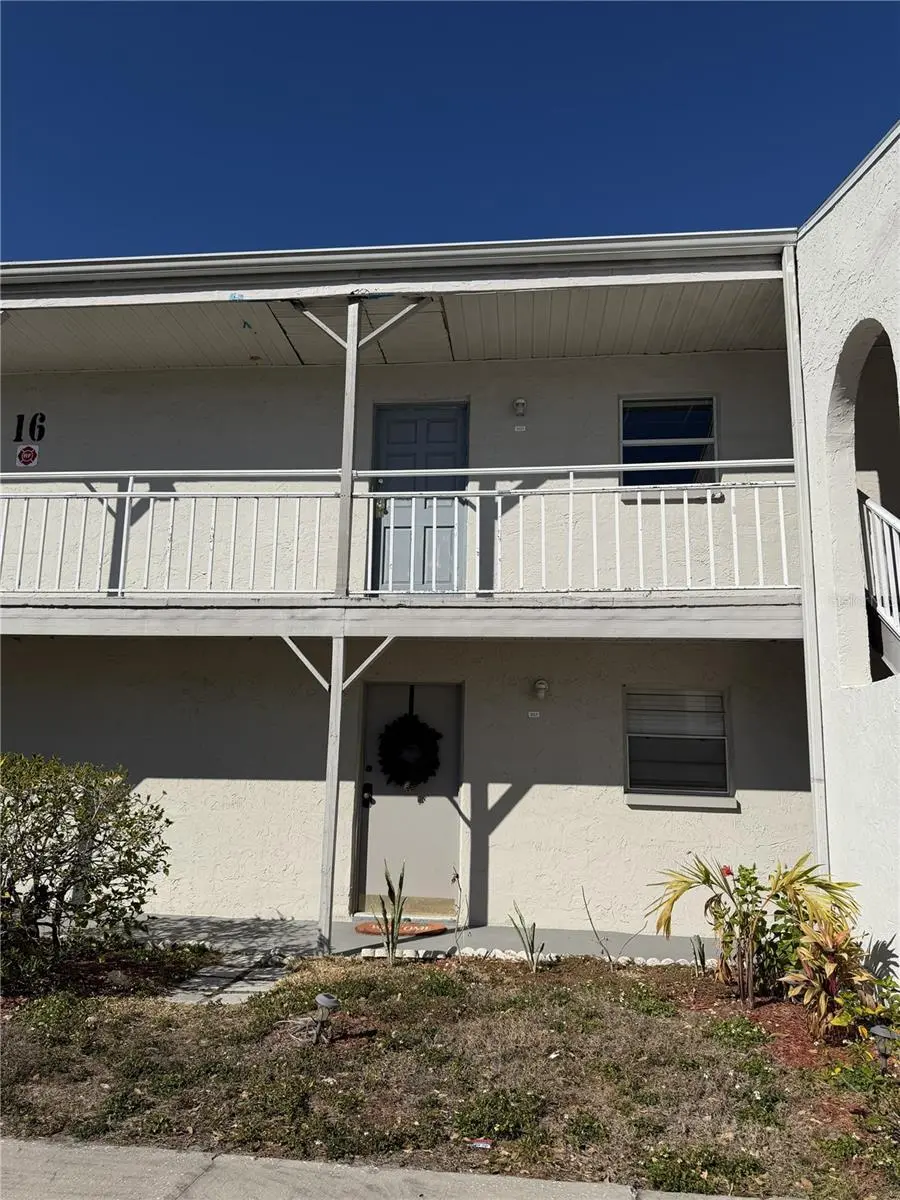
2625 State Road 590 #1623 · Clearwater, FL
Flood risk 1/10 · Minimal
- FEMA flood zone
- X (unshaded)
- Chance of flooding over 30 yrs
- 0.0%
- Est. flood insurance / yr
- $507 – $1,088
Fire risk 1/10 · Minimal
- Est. fire insurance / yr
- $947 – $1,759
Heat risk 10/10 · Severe
- Hot days now (above 107°F)
- 7 days/yr
- Hot days in 30 yrs
- 28 days/yr
Wind risk 10/10 · Severe
- Chance of severe wind over 30 yrs
- 99.0%
Air-quality risk 3/10 · Minor
- Unhealthy air days now
- 3 days/yr
- Unhealthy air days in 30 yrs
- 3 days/yr
Risk factors via First Street. Map © Google.
Why this score? — see what drove the B- grade
The composite is a weighted blend of 9 inputs, each scored 0–100. Each bar is that input's sub-score; the figure is the points it added to the 100-point composite (weight × sub-score).
- Cash flow +30.0/30.0
- 1% rule +10.0/10.0
- DSCR +10.0/10.0
- ARV discount +7.5/15.0
- Schools +4.3/10.0
- Livability +4.1/5.0
- Condition / age +2.5/5.0
- Rent growth +1.1/5.0
- Appreciation +0.0/10.0
$45,000
🖨 Deal sheet (PDF) 📄 Offer letter ✓ Due diligence
Listing remarks
Opportunity to renovate and add value in a highly accessible Clearwater location. This second-floor 1-bedroom, 1-bath condo offers strong upside for investors or buyers looking for a value add property. The unit experienced water intrusion during a recent hurricane and requires repairs, including a new water heater, HVAC system and electrical updates. This is a true value-add opportunity sold in its current condition. The layout includes wood and tile flooring throughout (no carpet) and a screened-in porch, offering additional usable space. Located in Flood Zone X, no flood insurance is required, which helps reduce long-term holding costs. HOA fee of $538/month. The community features two s
Key facts
- Screened-in porch
- Electrical updates
- New water heater
Tags
Neighborhood map
What this means for you Summary
Snapshot
- This is a 1-bed/1.0-bath condo listed at $45k.
Deal economics
- At list price, monthly cash flow is $333 ($4k/yr) — positive.
- The deal already cash-flows at list — no discount required.
- Meets the 1% rule at list price ($2k rent vs $45k).
- Cap rate 15.2% vs local median 2.9% in Clearwater — top-decile yield for the area; either an underpriced asset or a hidden risk that comps aren't pricing in. Stress-test before assuming the spread holds.
Location & tenants
- Location reads 82/100 on livability (#60 in FL, #988 nationally) — a professional / high-income tenant draw. Strengths: commute A+, housing A+, health & safety A+; Watch: employment C-.
- Pinellas (suburban): math 51% / reading 51% proficiency, ranked #31 of 73 in FL (top 42%) — acceptable for families but not a draw, mixed tenant base, ~2y average lease.
- Zoned schools: Mcmullen-Booth Elementary School (math 44% / reading 46%, grade D-, #1,271 of 2,144 statewide, top 60%, 458 students, 63% FRL); Safety Harbor Middle School (math 45% / reading 43%, grade D, #327 of 571 statewide, top 57%, 974 students, 50% FRL); Countryside High School (math 25% / reading 45%, grade F, #379 of 667 statewide, top 58%, 1,741 students, 44% FRL) — zoned schools at 52% FRL track the district average.
- Market conditions: Rents falling (-5.6%/yr); 116 active listings in the ZIP; 13 comparable units currently listed for rent nearby; rentals leasing fast (median 6d on market — plan ~1-2 weeks tenant-placement turnaround); 2,676 units permitted in Pinellas County in 2024 (1,422 in 5+ unit buildings).
Forward outlook
- Local home prices are declining (-3.0%/yr); year-one equity from $311 of loan paydown is wiped out by about $1k of value loss. Plan a longer hold.
- Pinellas County population projected at +14% by 2050 — modest demand growth; plan on rents tracking national, not racing it.
- At projected returns (-3.0% appreciation + 0.0% rent growth), your $13k cash investment doubles in ~5 years — after that, you're playing with house money.
Negotiation context
- Only 11 days on market — expect competitive offers; lowballing is unlikely to land.
- Current owner paid $25k; list at $45k implies a 81% gain — meaningful room to come down on a strong offer.
Risks & watch-outs
- Watch-outs: HOA is 35% of rent.
- Climate carrying-cost: severe wind risk, 99% chance of damaging wind over 30y; extreme-heat days projected 7→28/yr by 2055 (HVAC capex compounding) — expect insurance premiums to compound above CPI over the hold.
Questions for the listing agent
- Built in 1976 — when were the roof, HVAC, electrical panel, plumbing, and water heater last replaced?
- What does the HOA fee cover, when was the last increase, and are there any pending special assessments or reserve-fund shortfalls?
- Any open or pending special assessments — roof, HVAC, plumbing, elevator, façade? What's the per-unit balance and payoff schedule, and is the seller paying it off at close or rolling it to the buyer?
- Is there a deadline driving the sale (1031 exchange, divorce, estate, relocation)? That informs how much negotiation room exists.
- What's the average days-on-market for RENTAL listings here right now (not sales)? A rising rental-DOM trend means longer vacancies and softer asking-rent achievability than the comps imply.
- What's the recent tenant-quality profile in this submarket — average credit score on applications, eviction rate, late-payment / NSF rate, and stable-employment percentage? A property-management company in the area should have these aggregated.
- How much new apartment / multifamily construction is in the pipeline within 1–3 miles? Heavy new supply (>2% of stock underway) typically softens rents 12–24 months out; light construction supports rent growth.
Investment metrics
- 1% rule
- 3.39% ✓
- Cap rate
- 15.18%
- Cash-on-cash
- 31.75%
- DSCR
- 2.41
- GRM
- 2.5
CMA / ARV
No comps found within radius.
Projected returns pro-forma
-3.0% appreciation · 0.0% rent growth · sell at horizon
- IRR
- 20.6%
- Equity multiple
- 1.78×
- Total profit
- $9,843
- Equity at exit
- $6,710
- IRR
- 24.7%
- Equity multiple
- 2.60×
- Total profit
- $20,141
- Equity at exit
- $3,891
Cash invested: $12,600 (down + closing). Projections, not guarantees.
Landlord ↔ Tenant lean methodology
- Overall (STATE)
- 87 Strongly Landlord-Friendly
- State Florida
- 87 Strongly Landlord-Friendly · R+3
- County
- — inherits STATE
- City
- — inherits STATE
ZIP-level market 33759
- Rents YoY
- -5.6%
- Active inventory
- 116
- Price-to-rent
- 2.5×
Monthly cashflow live
- Estimated rent
- $1,524 high interval (Pro) →
- Mortgage (P&I)
- −$236
- Tax from tax record
- −$78 /mo · $938/yr
- Insurance
- −$19
- HOA
- −$538
- Vacancy / Maint / Mgmt
- −$320
- Net cashflow
- $333
Break-even live
Sensitivity live
| Price | -10% $359 | -5% $346 | +0% $333 | +5% $321 | +10% $308 |
|---|---|---|---|---|---|
| Rent | -10% $213 | -5% $273 | +0% $333 | +5% $394 | +10% $454 |
| Rate | -1.0pp $356 | -0.5pp $345 | base $333 | +0.5pp $322 | +1.0pp $310 |
UW: 25.0% down · 7.5% · 30yr · 1.5% tax · 5.0% vac · 8.0% maint · 8.0% mgmt
Financing live
Cash to close
- Down payment
- $11,250
- Closing costs
- $1,350
- Reserves months
- —
- Total cash needed
- —
Loan-product check · same deal, 3 products live
Conventional
25% down · 7.5% · 30yr
- Down + closing
- —
- Monthly P&I
- —
- Monthly cashflow
- —
- DSCR
- —
- Eligible?
- —
Personal DTI + credit; lowest rate.
DSCR
20% down · 8.5% · 30yr
- Down + closing
- —
- Monthly P&I
- —
- Monthly cashflow
- —
- DSCR
- —
- Eligible?
- —
No personal income docs; deal must DSCR.
Hard money
10% down · 12.0% · 12mo
- Down + closing
- —
- Monthly P&I
- —
- Monthly cashflow
- —
- DSCR
- —
- Eligible?
- —
Short-term bridge; refi at stabilization.
Rent comps 13 comps
| Address | Beds | Baths | Sqft | Rent | $/sqft | DOM | Units | Dist |
|---|---|---|---|---|---|---|---|---|
| 2625 Florida 590 Unit 1414 Clearwater, FL | 1.0 | 1.0 | 600 | $1,300 | $2.17 | 26d | 1 | 0.04mi |
| 1730 Audrey Dr Unit 2 Clearwater, FL | 1.0 | 1.0 | 700 | $2,100 | $3.00 | 26d | 1 | 0.24mi |
| 2481 NE Coachman Rd Clearwater, FL | 1.0–2.0 | 1.0–2.0 | 762 | $1,314 | $1.72 | 0d | 17 | 0.41mi |
| 2690 Drew St Clearwater, FL | 1.0–3.0 | 1.0–2.0 | 974 | $1,225 | $1.26 | 3d | 12 | 0.80mi |
| 2031 Glass Loop Clearwater, FL | 1.0–3.0 | 1.0–2.0 | 1058 | $1,798 | $1.70 | 0d | 37 | 0.97mi |
| 101 S Old Coachman Rd Clearwater, FL | 3.0 | 1.0–2.0 | 983 | $1,927 | $1.96 | 0d | 15 | 1.15mi |
| 24862 US Highway 19 N #3202 Clearwater, FL | 1.0 | 1.0 | 600 | $1,295 | $2.16 | 5d | 1 | 1.19mi |
| 24862 U.S. 19 Unit 3202 1 Clearwater, FL | 1.0 | 1.0 | 640 | $1,295 | $2.02 | 25d | 1 | 1.21mi |
| 2317 Nash St Unit Priv Clearwater, FL | 1.0 | 1.0 | 350 | $1,695 | $4.84 | 26d | 1 | 1.41mi |
| 2366 Shelley St #12 Clearwater, FL | 1.0 | 1.0 | 585 | $1,550 | $2.65 | 26d | 1 | 1.45mi |
| 2366 Shelley St Clearwater, FL | 1.0 | 1.0 | 585 | $1,425 | $2.44 | 16d | 2 | 1.45mi |
| 25 N Belcher Rd Clearwater, FL | 1.0–2.0 | 1.0–2.0 | 780 | $1,449 | $1.86 | 0d | 12 | 1.48mi |
| 2344 Shelley St #7 Clearwater, FL | 1.0 | 1.0 | 585 | $1,200 | $2.05 | 0d | 1 | 1.49mi |
HOA detail condo
- Monthly dues
- $538 · $6,456/yr
- Likely covers
- waterelectric
- Assessments
- None detected in remarks — confirm with the listing agent.
Listing history 11 events
-
2026-06-22days on market $45,000 Active 11 DOM
-
2026-06-18days on market $45,000 Active 8 DOM
-
2026-06-17days on market $45,000 Active 7 DOM
-
2026-06-16days on market $45,000 Active 6 DOM
-
2026-06-15days on market $45,000 Active 5 DOM
-
2026-06-13statusdays on market $45,000 Active 3 DOM
-
2026-04-02status Pending
-
2026-03-31$45,000 Active
-
1993-04-02soldstatus $24,900
-
1992-08-01soldstatus $35,200
-
1984-06-01soldstatus $33,500
ⓘ Source: listings_history table (triggers on properties + properties_extension) + one-shot
backfill from property_details.listing_events for pre-trigger history.
Tax reassessment forecast FL · Resets to sale price
- Current annual tax
- $938 · $78/mo
- Projected year-2 tax
- $938 · $78/mo
- Expected delta
- $0/yr ($0/mo · 0.0%)
ⓘ Screening estimate from a state-policy table — verify with the county assessor before closing.
Climate risk First Street
- Flood 1/10 Low FEMA zone X (unshaded) · 0% chance over 30 yrs
- Wildfire 1/10 Low
- Heat 10/10 Extreme 7 d/yr ≥107°F today · 28 d/yr by 30 yrs out
- Wind 10/10 Extreme 99% chance of damaging wind over 30 yrs
- Air quality 3/10 Moderate 3 unhealthy d/yr today · 3 by 30 yrs out
Nearby sold comps map
Loading sold comps map…
Walkable amenities ~0.75 mi
Loading nearby amenities…
Taxation est. · year 1
- Rental income
- $18,293
- − Mortgage interest
- −$2,521
- − Property taxes
- −$938
- − Insurance
- −$225
- − Repairs & maintenance
- −$1,463
- − Management
- −$1,463
- − HOA
- −$6,456
- − Depreciation
- −$1,309
- Taxable income
- $3,918
- Est. tax owed @ 24.0%
- −$940
- After-tax cash flow
- $3,061/yr
For passive investors: Depreciation is non-cash, so a rental often shows a tax loss while cash-flowing — sheltering income. Rental losses are passive: they offset passive income freely, and up to $25,000/yr can offset ordinary (W-2) income if you actively participate and your MAGI is under $100k (phasing out to $0 by $150k); unused losses carry forward. On sale, claimed depreciation is recaptured at up to 25%, and gains may owe capital-gains tax (a 1031 exchange can defer both). Figures are a year-1 estimate at your 24.0% rate — not tax advice; consult a CPA.
Schools (NCES district)
- District
- Pinellas
- NCES district ID
- 1201560
- Math proficiency
- 51% ▼ -5.00%
- Reading proficiency
- 51% ▼ -3.00%
- Median HH income
- $46,270
- Composite
- 43.27/100
- National rank
- #3046
- State rank
- #31 of 73 in FL
Livability — Clearwater
- Score
- 82/100
- State rank
- #60
- US rank
- #988
Category grades
Schools grade is shown separately in the Schools card above.
Census & demographics
- Census place
- Clearwater, FL
- County
- Pinellas County · 939,478 people
- City population
- 170,933
- Metro
- Tampa-St. Petersburg-Clearwater, FL
- Population (ZIP)
- 17,557
- Household income
- $67,492
- Rent vs Own
- Severe rent burden
- 1209.0
Population outlook (Pinellas County) Hauer SSP2
- Today (2025)
- 1,027,532 people
- By 2030
- 1,063,586 · +3.5%
- By 2040
- 1,125,020 · +9.5%
- By 2050
- 1,168,637 · +13.7%
- By 2075
- 1,265,188 · +23.1%
- By 2100
- 1,260,357 · +22.7%
Race, ethnicity, and origin ACS 2023
- Neighborhood character
- Majority White (65%)
- Race & ethnicity
- White 65% Hispanic / Latino 19% Two or more races 14% Black 7% Asian 3%
- Hispanic origin (detail)
- Mexican 7% Puerto Rican 3% Cuban 3%
- Common ancestry
- Romanian 4% Slovak 3% Italian 2%
- Foreign-born
- 16% · Canada, Jamaica, Vietnam
- Languages at home
- 79% English-only · Spanish 12% Other Indo-European 4% Russian/Polish/Slavic 1%
Political lean MEDSL · Pinellas
- 2024 margin
- Lean R (+5.2) · D 46.9% · R 52.1%
- 2008→2024 swing
- -13.5pp toward R · 2008: 8.3pp · 2024: -5.2pp
- All cycles
- 2024: R+5.2 2020: D+0.2 2016: R+1.1 2012: D+5.6 2008: D+8.3
Not yet ingested
- Civics
- —
Market trends
- HPI YoY
- ▼ -249.16%
- Current HPI
- 343.0721
- Rent YoY
- ▼ -5.57%
- Metro
- Tampa-St. Petersburg-Clearwater, FL
- State GDP YoY
- ▲ 3.28%
- F500 in state
- 36
Industry mix (Fortune 500 HQ in FL)
| Industry | F500 HQs | Revenue |
|---|---|---|
| Industrial Technology | 2 | $29B |
|
||
| Insurance | 2 | $17B |
|
||
| Retail | 1 | $60B |
|
||
| Technology Distribution | 1 | $58B |
|
||
| Homebuilding | 1 | $35B |
|
||
| Technology Manufacturing | 1 | $35B |
|
||
Price history
+34.3% since first listed5 events — show timeline
- 2026-04-02 Pending — Stellar MLS as Distributed by MLS Grid
- 2026-03-31 Listed $45,000 Stellar MLS as Distributed by MLS Grid
- 1993-04-02 Sold (Public Records) $24,900 Public Records
- 1992-08-01 Sold (Public Records) $35,200 Public Records
- 1984-06-01 Sold (Public Records) $33,500 Public Records
Property tax history
+5.1%/yrLatest (2025): $938 · -21.0% YoY. Source: county tax records.
Cash-flow waterfall
monthlySold comps — $/sqft
last 12 mo · ≤1 miLoading sold comps…