 Multi-family
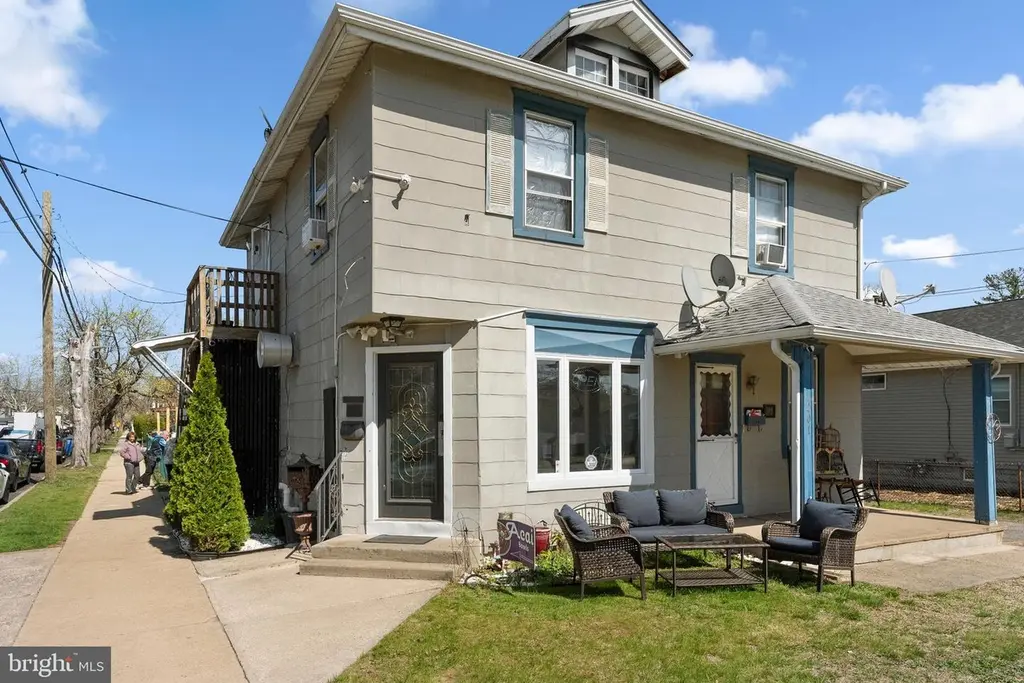
201 Rancocas Ave · Philadelphia, PA
Flood risk No data
- FEMA flood zone
- —
- Chance of flooding over 30 yrs
- —
- Est. flood insurance / yr
- —
Fire risk No data
- Est. fire insurance / yr
- —
Heat risk No data
- Hot days now (above threshold)
- —
- Hot days in 30 yrs
- —
Wind risk No data
- Chance of severe wind over 30 yrs
- —
Air-quality risk No data
- Unhealthy air days now
- —
- Unhealthy air days in 30 yrs
- —
Risk factors via First Street. Map © Google.
Why this score? — see what drove the B grade
The composite is a weighted blend of 9 inputs, each scored 0–100. Each bar is that input's sub-score; the figure is the points it added to the 100-point composite (weight × sub-score).
- Cash flow +30.0/30.0
- ARV discount +12.2/15.0
- DSCR +10.0/10.0
- 1% rule +9.1/10.0
- Livability +3.9/5.0
- Rent growth +2.5/5.0
- Condition / age +2.5/5.0
- Schools +1.3/10.0
- Appreciation +0.0/10.0
$369,900
🖨 Deal sheet 📄 Offer letter ✓ Due diligence
Multi-family units
County records classify this as Multi-Family (2-4 Unit). Listing-text estimate: 1 unit. estimate disagrees with records
Listing remarks
MIXED-USE INVESTMENT OPPORTUNITY - 2 APARTMENYS + RETAIL SPACE. Prime mixed-use investment opportunity on a high-exposure corner lot, ideal for expanding your rental portfolio or launching a small business in a well-trafficked location. This income-producing property features three distinct units: a popular Brazilian restaurant and a 1-bedroom apartment on the main level, plus a 2-bedroom unit upstairs—delivering multiple streams of revenue. All units are occupied by long-term tenants who would prefer to stay (currently leased at $1,300/month each), offering immediate, consistent cash flow. The commercial space offers excellent flexibility, well-suited for food service, retail, office
Key facts
- 7,998 sq ft lot
- 2 parking spots
- Built 1940
Property features AI
Finance
- Other: Fee simple ownership; Living area and year built sourced from assessor
- Financial info: Three total units with 3 currently leased; Gross scheduled income $46,800; Total actual rent $3,900 per month; Net operating income $36,800; Operating expenses approximately $10,000 (includes insurance); Vacancy allowance listed as 100%
Exterior
- Parking: Asphalt driveway with 2 driveway spaces; Total of 2 garage/parking spaces
- Utilities: Public water; Public sewer; Electric service for cooling; Natural gas for heating and hot water
- Home design: Detached building
- Construction: Frame construction; Concrete perimeter foundation
- Exterior features: Corner lot; Above-grade and below-grade structures noted
Interior
- Bedrooms: One studio/efficiency unit; One one-bedroom unit; Two two-bedroom units
- Heating & cooling: 90% forced air heating (natural gas); Window air conditioning units (electric); Natural gas hot water
- Interior features: Unfinished basement with shelving and outside entrance; Three total dwelling units (multifamily)
Neighborhood map
What this means for you Summary
Snapshot
- This is a 5-bed/?-bath multifamily listed at $370k.
Deal economics
- At list price, monthly cash flow is $2k ($19k/yr) — positive.
- The deal already cash-flows at list — no discount required.
- Meets the 1% rule at list price ($5k rent vs $370k).
- Cap rate 11.4% vs local median 3.5% in Philadelphia — top-decile yield for the area; either an underpriced asset or a hidden risk that comps aren't pricing in. Stress-test before assuming the spread holds.
Location & tenants
- Location reads 77/100 on livability (#348 in PA, #3,054 nationally) — a middle-class / working-renter tenant base. Strengths: amenities A+, commute A+, cost of living A+; Watch: employment C-, schools D+, crime F.
- Riverside Township School District (suburban): math 5% / reading 23% proficiency, ranked #455 of 472 in NJ (top 96%) — low school quality limits family demand, transient renter base, plan for 1-2y turnover.
- Market conditions: 3 comparable units currently listed for rent nearby; rentals leasing fast (median 2d on market — plan ~1-2 weeks tenant-placement turnaround); solid renter incomes; 2,161 units permitted in Burlington County in 2024 (988 in 5+ unit buildings).
- At $5,220/mo this rent would consume 66% of the median local household income ($94k/yr) (locally 1103% of renters already pay >50% of income on rent) — very limited rent-growth headroom before tenants either downsize or default.
Forward outlook
- Local home prices are declining (-3.0%/yr); year-one equity from $3k of loan paydown is wiped out by about $11k of value loss. Plan a longer hold.
- Burlington County population projected to shrink 5% by 2050 — rents likely to lag national; underwrite the cash flow, not the appreciation.
- At projected returns (-3.0% appreciation + 3.0% rent growth), your $104k cash investment doubles in ~7 years — after that, you're playing with house money.
Negotiation context
- Only 14 days on market — expect competitive offers; lowballing is unlikely to land.
- 5 sale attempts since 7y ago with the ask held roughly flat each time — persistent listings suggest the price (not the market) is what's stuck; bring a comps-based counter.
- Current owner paid $135k; list at $370k implies a 174% gain — meaningful room to come down on a strong offer.
Risks & watch-outs
- Watch-outs: built in 1940 — expect roof / HVAC / electrical / plumbing capex.
Questions for the listing agent
- Built in 1940 — when were the roof, HVAC, electrical panel, plumbing, and water heater last replaced?
- Is there a deadline driving the sale (1031 exchange, divorce, estate, relocation)? That informs how much negotiation room exists.
- Schools are D-rated, which usually means shorter tenancies and higher turnover. Who's the typical renter profile here, and what's been the actual vacancy rate?
- Crime grade is F in this area — have there been break-ins, vandalism, or insurance claims at this property in the last 3 years? What carrier currently insures it and at what premium?
- What's the average days-on-market for RENTAL listings here right now (not sales)? A rising rental-DOM trend means longer vacancies and softer asking-rent achievability than the comps imply.
- What's the recent tenant-quality profile in this submarket — average credit score on applications, eviction rate, late-payment / NSF rate, and stable-employment percentage? A property-management company in the area should have these aggregated.
- How much new apartment / multifamily construction is in the pipeline within 1–3 miles? Heavy new supply (>2% of stock underway) typically softens rents 12–24 months out; light construction supports rent growth.
Investment metrics
- 1% rule
- 1.41% ✓
- Cap rate
- 11.38%
- Cash-on-cash
- 18.16%
- DSCR
- 1.81
- GRM
- 5.9
CMA / ARV
- ARV (on-the-fly)
- $412,716
- Comps found
- 2
Show comp detail 2 sales within ~0.75 mi
| Address | Dist | Beds/Ba | Sqft | Sold | Price | $/sf | Match |
|---|---|---|---|---|---|---|---|
| 201 Rancocas Ave | 0.00mi | 5/— | 1,956 (0%) | 0mo | $369,900 | $189 | 100 |
| 121 Bridgeboro St | 0.59mi | 5/— | 1,848 (-6%) | 9mo | $390,000 | $211 | 55 |
Match score weights: distance 35% · size 25% · config 20% · recency 20%. Top-matched comps best support the ARV.
Projected returns pro-forma
-3.0% appreciation · 3.0% rent growth · sell at horizon
- IRR
- 9.8%
- Equity multiple
- 1.39×
- Total profit
- $39,974
- Equity at exit
- $55,153
- IRR
- 18.9%
- Equity multiple
- 2.58×
- Total profit
- $163,683
- Equity at exit
- $31,982
Cash invested: $103,572 (down + closing). Projections, not guarantees.
Monthly cashflow live
- Estimated rent
- $5,220 medium interval (Pro) →
- Mortgage (P&I)
- −$1,940
- Tax est. 1.5%
- −$462 /mo · $5,548/yr
- Insurance
- −$154
- HOA
- −$0
- Vacancy / Maint / Mgmt
- −$1,096
- Net cashflow
- $1,568
Break-even live
3-unit breakdown (identical units grouped — click to expand)
| Units | Beds | Baths | Est. rent |
|---|---|---|---|
| 1× unit | 1 | 1 | $1,625 |
| 2× units | 2 | 1 | $3,594 |
| #2 | 2 | 1 | $1,797 |
| #3 | 2 | 1 | $1,797 |
| Total (3 units) | $5,220 | ||
UW: 25.0% down · 7.5% · 30yr · 1.5% tax · 5.0% vac · 8.0% maint · 8.0% mgmt
Financing live
Cash to close
- Down payment
- $92,475
- Closing costs
- $11,097
- Reserves months
- —
- Total cash needed
- —
Loan-product check · same deal, 3 products live
Conventional
25% down · 7.5% · 30yr
- Down + closing
- —
- Monthly P&I
- —
- Monthly cashflow
- —
- DSCR
- —
- Eligible?
- —
Personal DTI + credit; lowest rate.
DSCR
20% down · 8.5% · 30yr
- Down + closing
- —
- Monthly P&I
- —
- Monthly cashflow
- —
- DSCR
- —
- Eligible?
- —
No personal income docs; deal must DSCR.
Hard money
10% down · 12.0% · 12mo
- Down + closing
- —
- Monthly P&I
- —
- Monthly cashflow
- —
- DSCR
- —
- Eligible?
- —
Short-term bridge; refi at stabilization.
Rent comps 3 comps
| Address | Beds | Baths | Sqft | Rent | $/sqft | DOM | Units | Dist |
|---|---|---|---|---|---|---|---|---|
| 136 Webster St Riverside, NJ | 4.0 | 1.0 | 1280 | $2,700 | $2.11 | 19d | 1 | 0.61mi |
| 420 Ash St Delanco, NJ | 4.0 | 1.5 | 1267 | $2,600 | $2.05 | 1d | 1 | 1.09mi |
| 419 Union Ave Delanco, NJ | 4.0 | 2.0 | 1444 | $2,750 | $1.90 | 1d | 1 | 1.19mi |
Listing history 15 events
-
2026-06-02status $369,900 Pending 14 DOM
-
2026-04-24historical Active Under Contract
-
2026-04-24historical
-
2026-04-11$369,900 Active
-
2026-04-11$369,900 Active
-
2026-03-18historical
-
2026-03-18historical $369,900
-
2024-05-10historical
-
2024-03-30price $300,000
-
2024-03-28$275,000 Active
-
2019-08-30soldstatus $135,000 Closed
-
2019-07-01status Pending
-
2019-05-11status Active
-
2019-03-05status Pending
-
2019-01-14$159,000 Active
ⓘ Source: listings_history table (triggers on properties + properties_extension) + one-shot
backfill from property_details.listing_events for pre-trigger history.
Nearby sold comps map
Loading sold comps map…
Walkable amenities ~0.75 mi
Loading nearby amenities…
Taxation est. · year 1
- Rental income
- $62,640
- − Mortgage interest
- −$20,720
- − Property taxes
- −$5,548
- − Insurance
- −$1,850
- − Repairs & maintenance
- −$5,011
- − Management
- −$5,011
- − Depreciation
- −$10,761
- Taxable income
- $13,739
- Est. tax owed @ 24.0%
- −$3,297
- After-tax cash flow
- $15,513/yr
For passive investors: Depreciation is non-cash, so a rental often shows a tax loss while cash-flowing — sheltering income. Rental losses are passive: they offset passive income freely, and up to $25,000/yr can offset ordinary (W-2) income if you actively participate and your MAGI is under $100k (phasing out to $0 by $150k); unused losses carry forward. On sale, claimed depreciation is recaptured at up to 25%, and gains may owe capital-gains tax (a 1031 exchange can defer both). Figures are a year-1 estimate at your 24.0% rate — not tax advice; consult a CPA.
Schools (NCES district)
- District
- Riverside Township School District
- NCES district ID
- 3414010
- Math proficiency
- 5% ▼ -12.00%
- Reading proficiency
- 23% ▼ -5.00%
- Median HH income
- $56,244
- Composite
- 13.46/100
- National rank
- #9522
- State rank
- #455 of 472 in NJ
Livability — Philadelphia
- Score
- 77/100
- State rank
- #348
- US rank
- #3054
Category grades
Schools grade is shown separately in the Schools card above.
Census & demographics
- County
- Burlington County
- City population
- 1,559,001
- Metro
- Philadelphia-Camden-Wilmington, PA-NJ-DE-MD
- Population (ZIP)
- 30,615
- Household income
- $94,407
- Rent vs Own
- Severe rent burden
- 1103.0
Population outlook (Burlington County) Hauer SSP2
- Today (2025)
- 453,425 people
- By 2030
- 452,359 · -0.2%
- By 2040
- 445,033 · -1.9%
- By 2050
- 431,760 · -4.8%
- By 2075
- 406,277 · -10.4%
- By 2100
- 364,732 · -19.6%
Race, ethnicity, and origin ACS 2023
- Neighborhood character
- Predominantly White (70%)
- Race & ethnicity
- White 70% Black 10% Hispanic / Latino 9% Two or more races 9% Asian 3%
- Hispanic origin (detail)
- Puerto Rican 3%
- Common ancestry
- Romanian 8% Estonian 3% Russian 2%
- Foreign-born
- 13% · Canada, China
- Languages at home
- 82% English-only · Other Indo-European 8% Spanish 6% Other Asian/Pacific 2%
Political lean MEDSL · Burlington
- 2024 margin
- D (+16.6) · D 57.6% · R 41.0% · Other 1.3%
- 2008→2024 swing
- -2.0pp toward R · 2008: 18.6pp · 2024: 16.6pp
- All cycles
- 2024: D+16.6 2020: D+19.5 2016: D+14.8 2012: D+18.7 2008: D+18.6
Not yet ingested
- Civics
- —
Market trends
- HPI YoY
- ▼ -396.76%
- Current HPI
- 281.8091
- Rent YoY
- —
- Metro
- Philadelphia-Camden-Wilmington, PA-NJ-DE-MD
- State GDP YoY
- ▲ 1.68%
- F500 in state
- 34
Industry mix (Fortune 500 HQ in PA)
| Industry | F500 HQs | Revenue |
|---|---|---|
| Healthcare | 2 | $309B |
|
||
| Insurance | 2 | $27B |
|
||
| Telecommunications / Media | 1 | $124B |
|
||
| Industrial Distribution | 1 | $22B |
|
||
| Financial Services | 1 | $20B |
|
||
| Chemicals / Materials | 1 | $18B |
|
||
Price history
+132.6% since first listed14 events — show timeline
- 2026-04-24 Contingent — BRIGHT MLS
- 2026-04-24 Listing Removed — BRIGHT MLS
- 2026-04-11 Listed $369,900 BRIGHT MLS
- 2026-04-11 Listed $369,900 BRIGHT MLS
- 2026-03-18 Coming Soon — BRIGHT MLS
- 2026-03-18 Coming Soon $369,900 BRIGHT MLS
- 2024-05-10 Listing Removed — BRIGHT MLS
- 2024-03-30 Price Changed $300,000 BRIGHT MLS
- 2024-03-28 Listed $275,000 BRIGHT MLS
- 2019-08-30 Sold (MLS) $135,000 BRIGHT MLS
- 2019-07-01 Pending — BRIGHT MLS
- 2019-05-11 Relisted — BRIGHT MLS
- 2019-03-05 Pending — BRIGHT MLS
- 2019-01-14 Listed $159,000 BRIGHT MLS
Cash-flow waterfall
monthlySold comps — $/sqft
last 12 mo · ≤1 miLoading sold comps…