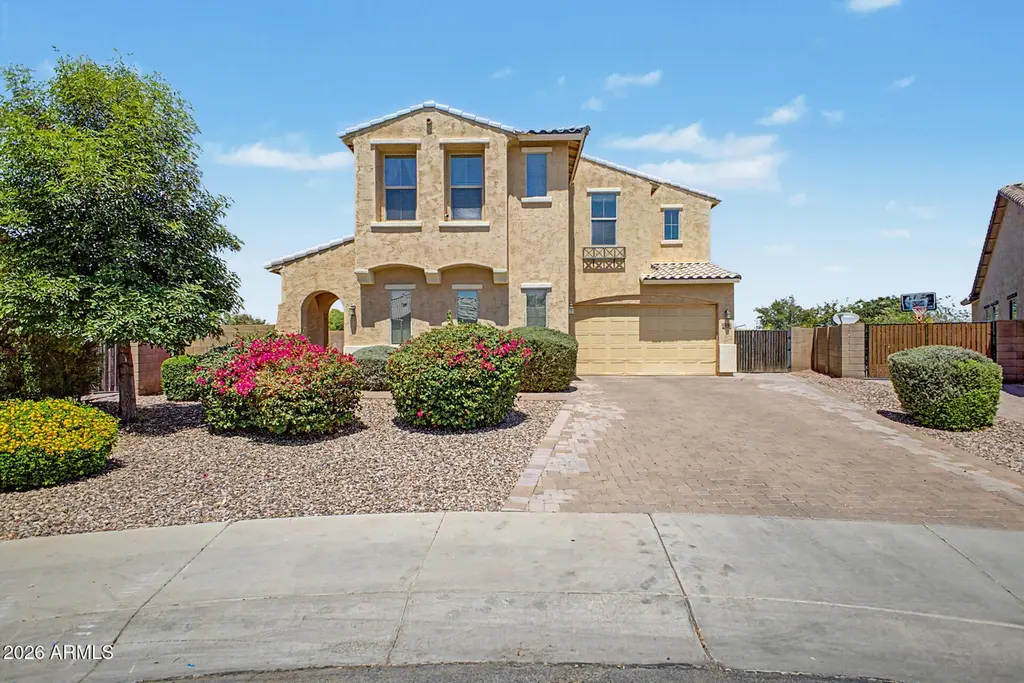
5286 S Ponderosa Dr · Gilbert, AZ
Flood risk 1/10 · Minimal
- FEMA flood zone
- X (shaded)
- Chance of flooding over 30 yrs
- 0.0%
- Est. flood insurance / yr
- $507 – $1,088
Fire risk 5/10 · Moderate
- Est. fire insurance / yr
- $610 – $1,132
Heat risk 9/10 · Severe
- Hot days now (above 111°F)
- 7 days/yr
- Hot days in 30 yrs
- 19 days/yr
Wind risk 1/10 · Minimal
- Chance of severe wind over 30 yrs
- —
Air-quality risk 2/10 · Minimal
- Unhealthy air days now
- 1 days/yr
- Unhealthy air days in 30 yrs
- 1 days/yr
Risk factors via First Street. Map © Google.
Why this score? — see what drove the D+ grade
The composite is a weighted blend of 9 inputs, each scored 0–100. Each bar is that input's sub-score; the figure is the points it added to the 100-point composite (weight × sub-score).
- ARV discount +15.0/15.0
- Appreciation +9.2/10.0
- Cash flow +6.3/30.0
- Schools +5.2/10.0
- Livability +4.4/5.0
- Rent growth +3.6/5.0
- Condition / age +2.5/5.0
- DSCR +0.6/10.0
- 1% rule +0.5/10.0
$839,999
🖨 Deal sheet (PDF) 📄 Offer letter ✓ Due diligence
Listing remarks
Experience elevated living in one of Gilbert's most sought-after communities, The Bridges. Situated on an oversized lot with no neighbors behind, this expansive residence offers the perfect blend of comfort, and privacy. Boasting 5 spacious bedrooms, 4 bathrooms, a dedicated den, versatile loft, and a 3-car garage, there is room for every lifestyle and every occasion. The thoughtfully designed floor plan provides generous living spaces, ideal for both everyday living and entertaining. Step outside to a backyard with mature fruit trees, dedicated gardening area and endless possibilities to enjoy the peace and openness that comes with this premium homesite. Located just moments from top-rated
Key facts
- Premium homesite
- Dedicated den
- Oversized lot
Tags
Property features AI
Finance
- Financial info: Current financing: Conventional
- HOA & community: Homeowner association with quarterly fee; Association fee includes grounds maintenance; Community features include a lake and biking/walking path
Exterior
- Parking: 3 covered parking spaces; 4 open parking spaces; 3-car garage with garage door opener
- Utilities: City water; Public sewer
- Home design: Single family residence; Fee simple ownership
- Construction: Built with stucco and wood frame (painted); Tile roof
- Exterior features: Private pool with variable speed pump; Private spa; Sprinklers front and rear; Gravel/stone front and back; Block and wrought iron fencing
Interior
- Kitchen: Built-in microwave; Walk-in pantry; Non-laminate counters; Reverse osmosis; Dishwasher; Garbage disposal
- Bedrooms: Up to 7 possible bedrooms; Upstairs bedroom(s)
- Flooring: Carpet; Tile
- Bathrooms: 3 full bathrooms; 1 half bathroom
- Heating & cooling: Natural gas heating; Central air; Ceiling fans; Programmable thermostat
- Interior features: Granite counters; Double vanity; Eat-in kitchen; Breakfast bar; 9+ foot flat ceilings; Kitchen island; Separate shower and tub; Dual pane windows; Multi-zone climate control
- Laundry & utility: Upstairs laundry; Washer/Dryer hookups
Neighborhood map
What this means for you Summary
Snapshot
- This is a 5-bed/5.0-bath single-family listed at $840k.
Deal economics
- At list price, monthly cash flow is $-1k ($-18k/yr) — negative.
- To cash-flow at today's rent, offer at most $575k (31.5% below list).
- To meet the 1% rule (rent ≥ 1% of price), the offer needs to be $461k (45.1% below list).
- Recommended offer: $461k (45.1% below list) — sets the bar for 1% rule.
- Cap rate 4.2% vs local median 3.2% in Gilbert — meaningfully above typical; check what's discounted (condition, days-on-market, listing class) to confirm the premium yield is real.
Location & tenants
- Location reads 87/100 on livability (#1 in AZ, #240 nationally) — a professional / high-income tenant draw. Strengths: amenities A+, employment A+, housing A+; Watch: health & safety C-, cost of living F.
- Higley Unified School District (4248) (suburban): math 56% / reading 58% proficiency, ranked #21 of 249 in AZ (top 8%) — acceptable for families but not a draw, mixed tenant base, ~2y average lease; only 15% free/reduced lunch — higher-income household profile.
- Zoned schools: Bridges Elementary School (math 80% / reading 79%, grade A, #13 of 1,109 statewide, top 1%, 759 students, 7% FRL); Sossaman Middle School (math 59% / reading 60%, grade B, #4 of 218 statewide, top 1%, 1,043 students, 13% FRL); Higley High School (math 49% / reading 47%, grade D, #46 of 381 statewide, top 12%, 2,137 students, 12% FRL) — zoned schools at 11% FRL track the district average.
- Market conditions: Rents rising fast (+4.3%/yr); 340 active listings in the ZIP; 8 comparable units currently listed for rent nearby; rentals at typical pace (median 17d on market — plan ~3-4 weeks tenant-placement turnaround); high-income renter base; 36,011 units permitted in Maricopa County in 2024 (12,801 in 5+ unit buildings).
- This rent runs 35% of the median local income ($156k/yr) — at the standard rent-burdened threshold; future hikes will face affordability resistance.
Forward outlook
- In year one you build about $76k of equity ($6k loan paydown + $70k appreciation (8.4% local appreciation)).
- Maricopa County population projected at +38% by 2050 — long-run rental-demand tailwind backs the buy-and-hold thesis.
- By year 2, paydown + projected appreciation supports a ~$122k cash-out refi (75% LTV) — recoverable capital for the next deal without selling this one.
Negotiation context
- It's been on market 16 days — a 2% lower offer ($827k) is reasonable based on typical stale-listing flexibility.
Risks & watch-outs
- Climate carrying-cost: moderate wildfire risk; extreme-heat days projected 7→19/yr by 2055 (HVAC capex compounding) — expect insurance premiums to compound above CPI over the hold.
Questions for the listing agent
- What do current leases actually rent for vs. the listed asking? Can we see a recent rent roll and the last 12 months of T-12 income?
- What does the HOA fee cover, when was the last increase, and are there any pending special assessments or reserve-fund shortfalls?
- Is there a deadline driving the sale (1031 exchange, divorce, estate, relocation)? That informs how much negotiation room exists.
- Schools are A-rated — typically a magnet for longer-tenancy family renters. What's the average tenant stay here, and is there a school-zone premium baked into asking?
- The area grade is low — what's the realistic commute time and amenity access for the typical tenant pool here? Any planned neighborhood developments (good or bad) we should know about?
- What's the average days-on-market for RENTAL listings here right now (not sales)? A rising rental-DOM trend means longer vacancies and softer asking-rent achievability than the comps imply.
- What's the recent tenant-quality profile in this submarket — average credit score on applications, eviction rate, late-payment / NSF rate, and stable-employment percentage? A property-management company in the area should have these aggregated.
- How much new for-sale + rental construction is in the pipeline within 1–3 miles? Heavy new supply typically softens prices + rents 12–24 months out; constrained supply supports both.
Investment metrics
- 1% rule
- 0.55% ✗
- Cap rate
- 4.15%
- Cash-on-cash
- -7.64%
- DSCR
- 0.66
- GRM
- 15.2
CMA / ARV
- ARV (on-the-fly)
- $1,054,035
- Comps found
- 12
Show comp detail 12 sales within ~0.75 mi
| Address | Dist | Beds/Ba | Sqft | Sold | Price | $/sf | Match |
|---|---|---|---|---|---|---|---|
| 5124 S Ponderosa Dr | 0.22mi | 5/3.5 | 3,501 (-2%) | 1mo | $970,000 | $277 | 80 |
| 3767 E Mia Ln | 0.25mi | 4/3.5 (-1) | 3,499 (-2%) | 0mo | $1,145,000 | $327 | 74 |
| 5085 S Ponderosa Dr | 0.27mi | 5/3.5 | 3,501 (-2%) | 8mo | $1,175,000 | $336 | 71 |
| 5012 S Girard St | 0.43mi | 5/4.0 | 3,456 (-3%) | 1mo | $739,500 | $214 | 69 |
| 5123 S Mariposa Dr | 0.20mi | 5/3.5 | 3,925 (+10%) | 7mo | $860,000 | $219 | 62 |
| 3683 E Cassia Ln | 0.43mi | 5/3.5 | 3,774 (+6%) | 7mo | $1,274,000 | $338 | 59 |
| 3811 E Lodgepole Dr | 0.36mi | 5/3.5 | 3,186 (-11%) | 1mo | $840,000 | $264 | 58 |
| 4868 S Hemet St | 0.52mi | 4/3.0 (-1) | 3,465 (-3%) | 3mo | $1,250,000 | $361 | 55 |
| 3249 E Nightingale Ln | 0.55mi | 4/3.5 (-1) | 3,392 (-5%) | 2mo | $1,000,000 | $295 | 53 |
| 5547 S Tatum Ct | 0.39mi | 5/3.5 | 4,036 (+13%) | 3mo | $885,000 | $219 | 51 |
| 3964 E Penedes Dr | 0.64mi | 5/5.5 | 4,039 (+13%) | 0mo | $2,040,000 | $505 | 46 |
| 5283 S Joshua Tree Ln | 0.46mi | 4/3.0 (-1) | 3,054 (-14%) | 5mo | $885,000 | $290 | 38 |
Match score weights: distance 35% · size 25% · config 20% · recency 20%. Top-matched comps best support the ARV.
Projected returns pro-forma
8.36% appreciation · 4.31% rent growth · sell at horizon
- IRR
- 15.4%
- Equity multiple
- 2.17×
- Total profit
- $276,070
- Equity at exit
- $659,021
- IRR
- 15.3%
- Equity multiple
- 4.77×
- Total profit
- $885,789
- Equity at exit
- $1,328,554
Cash invested: $235,200 (down + closing). Projections, not guarantees.
Landlord ↔ Tenant lean methodology
- Overall (STATE)
- 87 Strongly Landlord-Friendly
- State Arizona
- 87 Strongly Landlord-Friendly · R+3
- County
- — inherits STATE
- City
- — inherits STATE
ZIP-level market 85298
- Home prices YoY
- 2.5%
- Rents YoY
- 4.3%
- Active inventory
- 340
- Price-to-rent
- 15.2×
Monthly cashflow live
- Estimated rent
- $4,607 high interval (Pro) →
- Mortgage (P&I)
- −$4,405
- Tax from tax record
- −$247 /mo · $2,967/yr
- Insurance
- −$350
- HOA
- −$135
- Vacancy / Maint / Mgmt
- −$968
- Net cashflow
- $-1,497
Break-even live
Sensitivity live
| Price | -10% $-1,022 | -5% $-1,260 | +0% $-1,497 | +5% $-1,735 | +10% $-1,973 |
|---|---|---|---|---|---|
| Rent | -10% $-1,861 | -5% $-1,679 | +0% $-1,497 | +5% $-1,315 | +10% $-1,133 |
| Rate | -1.0pp $-1,074 | -0.5pp $-1,284 | base $-1,497 | +0.5pp $-1,715 | +1.0pp $-1,937 |
UW: 25.0% down · 7.5% · 30yr · 1.5% tax · 5.0% vac · 8.0% maint · 8.0% mgmt
Financing live
Cash to close
- Down payment
- $210,000
- Closing costs
- $25,200
- Reserves months
- —
- Total cash needed
- —
Loan-product check · same deal, 3 products live
Conventional
25% down · 7.5% · 30yr
- Down + closing
- —
- Monthly P&I
- —
- Monthly cashflow
- —
- DSCR
- —
- Eligible?
- —
Personal DTI + credit; lowest rate.
DSCR
20% down · 8.5% · 30yr
- Down + closing
- —
- Monthly P&I
- —
- Monthly cashflow
- —
- DSCR
- —
- Eligible?
- —
No personal income docs; deal must DSCR.
Hard money
10% down · 12.0% · 12mo
- Down + closing
- —
- Monthly P&I
- —
- Monthly cashflow
- —
- DSCR
- —
- Eligible?
- —
Short-term bridge; refi at stabilization.
Rent comps 8 comps
| Address | Beds | Baths | Sqft | Rent | $/sqft | DOM | Units | Dist |
|---|---|---|---|---|---|---|---|---|
| 3355 E Indigo St Gilbert, AZ | 6.0 | 5.0 | 4036 | $6,900 | $1.71 | 4d | 1 | 0.33mi |
| 3484 E Coconino Way Gilbert, AZ | 5.0 | 3.0 | 2928 | $3,400 | $1.16 | 16d | 1 | 0.74mi |
| 4091 E Carriage Way Gilbert, AZ | 5.0 | 3.0 | 2667 | $3,420 | $1.28 | 3d | 1 | 0.95mi |
| 3436 E Casa Mader Dr Gilbert, AZ | 6.0 | 4.5 | 4120 | $3,900 | $0.95 | 45d | 1 | 1.08mi |
| 5475 S Cardinal St Gilbert, AZ | 4.0 | 2.5 | 2708 | $4,000 | $1.48 | 3d | 1 | 1.31mi |
| 3440 E Flower St Gilbert, AZ | 4.0 | 2.5 | 2943 | $2,800 | $0.95 | 26d | 1 | 1.35mi |
| 2543 E Penedes Dr Gilbert, AZ | 4.0 | 3.0 | 2496 | $2,695 | $1.08 | 45d | 1 | 1.40mi |
| 3570 E Meadowview Dr Gilbert, AZ | 4.0 | 3.0 | 2536 | $3,200 | $1.26 | 4d | 1 | 1.48mi |
HOA detail
- Monthly dues
- $135 · $1,620/yr
Listing history 10 events
-
2026-06-21days on market $839,999 Active 16 DOM
-
2026-06-18days on market $839,999 Active 13 DOM
-
2026-06-17days on market $839,999 Active 12 DOM
-
2026-06-16days on market $839,999 Active 11 DOM
-
2026-06-15days on market $839,999 Active 10 DOM
-
2026-06-13days on market $839,999 Active 8 DOM
-
2026-06-09days on market $839,999 Active 4 DOM
-
2026-06-08days on market $839,999 Active 3 DOM
-
2026-06-07remarks 699-char remark
-
2026-06-07$839,999 Active 2 DOM
ⓘ Source: listings_history table (triggers on properties + properties_extension) + one-shot
backfill from property_details.listing_events for pre-trigger history.
Tax reassessment forecast AZ · Resets to sale price
- Current annual tax
- $2,967 · $247/mo
- Projected year-2 tax
- $5,544 · $462/mo
- Expected delta
- +$2,577/yr (+$215/mo · 86.8%)
ⓘ Screening estimate from a state-policy table — verify with the county assessor before closing.
Climate risk First Street
- Flood 1/10 Low FEMA zone X (shaded) · 0% chance over 30 yrs
- Wildfire 5/10 Major
- Heat 9/10 Extreme 7 d/yr ≥111°F today · 19 d/yr by 30 yrs out
- Wind 1/10 Low
- Air quality 2/10 Low 1 unhealthy d/yr today · 1 by 30 yrs out
Nearby sold comps map
Loading sold comps map…
Walkable amenities ~0.75 mi
Loading nearby amenities…
Taxation est. · year 1
- Rental income
- $55,289
- − Mortgage interest
- −$47,053
- − Property taxes
- −$2,967
- − Insurance
- −$4,200
- − Repairs & maintenance
- −$4,423
- − Management
- −$4,423
- − HOA
- −$1,620
- − Depreciation
- −$24,436
- Taxable loss
- −$33,834
- Est. tax savings @ 24.0%
- +$8,120
- After-tax cash flow
- $-9,849/yr
For passive investors: Depreciation is non-cash, so a rental often shows a tax loss while cash-flowing — sheltering income. Rental losses are passive: they offset passive income freely, and up to $25,000/yr can offset ordinary (W-2) income if you actively participate and your MAGI is under $100k (phasing out to $0 by $150k); unused losses carry forward. On sale, claimed depreciation is recaptured at up to 25%, and gains may owe capital-gains tax (a 1031 exchange can defer both). Figures are a year-1 estimate at your 24.0% rate — not tax advice; consult a CPA.
Schools (NCES district)
- District
- Higley Unified School District (4248)
- NCES district ID
- 0403780
- Math proficiency
- 56% ▼ -10.00%
- Reading proficiency
- 58% ▼ -8.00%
- Median HH income
- $82,526
- Composite
- 51.7/100
- National rank
- #1688
- State rank
- #21 of 249 in AZ
Livability — Gilbert
- Score
- 87/100
- State rank
- #1
- US rank
- #240
Category grades
Schools grade is shown separately in the Schools card above.
Census & demographics
- Census place
- Gilbert, AZ
- County
- Maricopa County · 4,537,380 people
- City population
- 281,769
- Metro
- Phoenix-Mesa-Chandler, AZ
- Population (ZIP)
- 44,114
- Household income
- $156,425
- Rent vs Own
- Severe rent burden
- 173.0
Population outlook (Maricopa County) Hauer SSP2
- Today (2025)
- 4,979,203 people
- By 2030
- 5,378,229 · +8.0%
- By 2040
- 6,156,598 · +23.6%
- By 2050
- 6,872,376 · +38.0%
- By 2075
- 8,401,270 · +68.7%
- By 2100
- 9,247,439 · +85.7%
Race, ethnicity, and origin ACS 2023
- Neighborhood character
- Predominantly White (72%)
- Race & ethnicity
- White 72% Hispanic / Latino 14% Two or more races 11% Asian 7% Black 2%
- Hispanic origin (detail)
- Mexican 10%
- Common ancestry
- Italian 4% Romanian 3% Lithuanian 3%
- Foreign-born
- 9% · Canada, China, Vietnam
- Languages at home
- 85% English-only · Spanish 7% Other Indo-European 2% Chinese 1%
Political lean MEDSL · Maricopa
- 2024 margin
- Toss-up / Even · D 47.7% · R 51.2% · Other 1.1%
- 2008→2024 swing
- +7.1pp toward D · 2008: -10.6pp · 2024: -3.5pp
- All cycles
- 2024: R+3.5 2020: D+2.2 2016: R+3.5 2012: R+12.0 2008: R+10.6
Not yet ingested
- Civics
- —
Market trends
- HPI YoY
- ▲ 8.36%
- Current HPI
- 343.6932
- Rent YoY
- ▲ 4.31%
- Metro
- Phoenix-Mesa-Chandler, AZ
- State GDP YoY
- ▲ 4.54%
- F500 in state
- 20
Industry mix (Fortune 500 HQ in AZ)
| Industry | F500 HQs | Revenue |
|---|---|---|
| Technology | 2 | $13B |
|
||
| Mining / Metals | 1 | $23B |
|
||
| Environmental Services | 1 | $16B |
|
||
| Metals / Steel | 1 | $14B |
|
||
| Technology Distribution | 1 | $9B |
|
||
| Homebuilding | 1 | $8B |
|
||
Price history
1 event — show timeline
- 2026-06-05 Listed $839,999 ARMLS
Property tax history
+5.7%/yrLatest (2025): $2,967 · -5.8% YoY. Source: county tax records.
Cash-flow waterfall
monthlySold comps — $/sqft
last 12 mo · ≤1 miLoading sold comps…