 Duplex
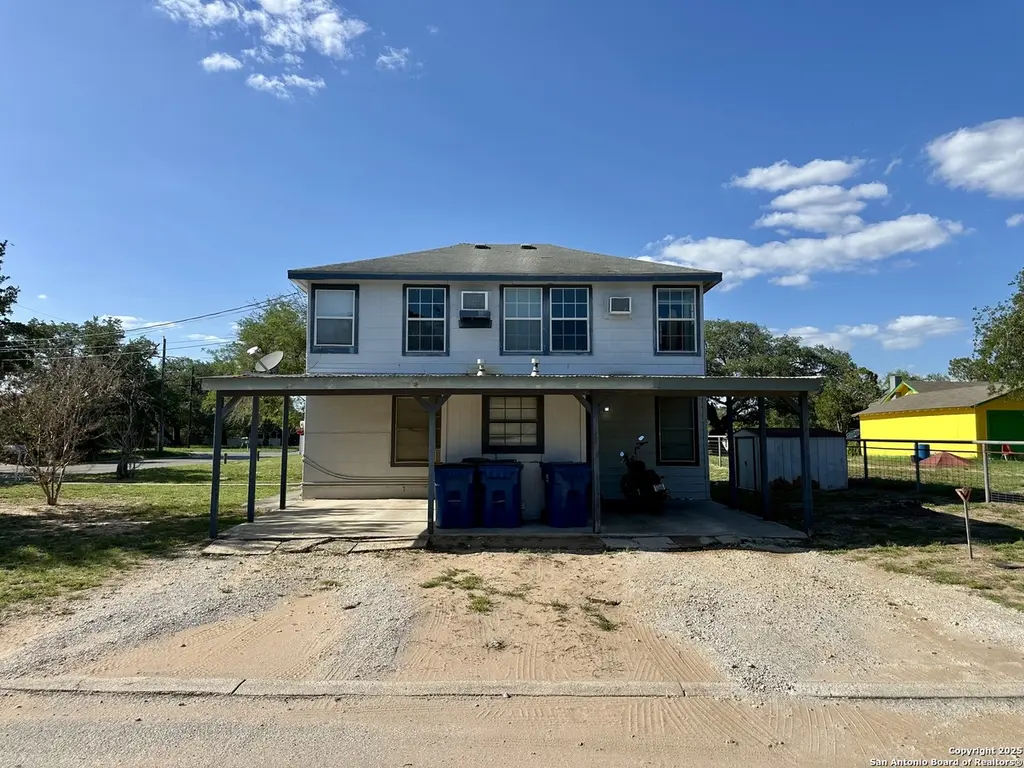
545 A&b Bensdale · Pleasanton, TX
Flood risk No data
- FEMA flood zone
- —
- Chance of flooding over 30 yrs
- —
- Est. flood insurance / yr
- —
Fire risk No data
- Est. fire insurance / yr
- —
Heat risk No data
- Hot days now (above threshold)
- —
- Hot days in 30 yrs
- —
Wind risk No data
- Chance of severe wind over 30 yrs
- —
Air-quality risk No data
- Unhealthy air days now
- —
- Unhealthy air days in 30 yrs
- —
Risk factors via First Street. Map © Google.
Why this score? — see what drove the C+ grade
The composite is a weighted blend of 9 inputs, each scored 0–100. Each bar is that input's sub-score; the figure is the points it added to the 100-point composite (weight × sub-score).
- Cash flow +27.8/30.0
- DSCR +9.8/10.0
- 1% rule +7.6/10.0
- ARV discount +7.5/15.0
- Schools +3.2/10.0
- Livability +3.2/5.0
- Rent growth +2.5/5.0
- Condition / age +2.2/5.0
- Appreciation +0.0/10.0
$149,000
🖨 Deal sheet (PDF) 📄 Offer letter ✓ Due diligence
Multi-family units
County records classify this as Multi-Family (2-4 Unit). Listing-text estimate: 2 units. confirmed
Listing remarks MLS
Don't miss this great investment opportunity! This charming duplex sits on a large lot with plenty of space to add additional units. Each unit offers approximately 675 sq ft of comfortable living space, featuring one bedroom, one full bathroom, a walk-in closet, and carpet flooring throughout most of the living areas. Residents will enjoy relaxing on the inviting front porch and benefit from a dedicated covered parking space for each unit. If you're looking to start or expand your rental portfolio, this property offers significant potential with room for growth.
Key facts
- Walk-in closet
- Front porch
- Large lot
Tags
Neighborhood map
What this means for you Summary
Snapshot
- This is a 2 × 1-bed/1.0-bath units multifamily listed at $149k. Condition is rated fair.
Deal economics
- At list price, monthly cash flow is $453 ($5k/yr) — positive. Per door: $227/mo.
- The deal already cash-flows at list — no discount required.
- Meets the 1% rule at list price ($2k rent vs $149k).
- Recommended offer: $131k (12.0% below list) — sets the bar for market timing.
- Cap rate 9.9% vs local median 3.3% in Pleasanton — top-decile yield for the area; either an underpriced asset or a hidden risk that comps aren't pricing in. Stress-test before assuming the spread holds.
Location & tenants
- Location reads 65/100 on livability (#679 in TX) — a middle-class / working-renter tenant base. Strengths: cost of living A+, housing A+, employment B; Watch: amenities F, commute F, health & safety F.
- Pleasanton ISD (town): math 36% / reading 37% proficiency, ranked #470 of 826 in TX (top 57%) — families likely to look elsewhere, expect single-tenant / working-renter base with shorter leases.
- Zoned schools: Pleasanton El (math 35% / reading 35%, grade F, #1,965 of 4,322 statewide, top 46%, 958 students, 70% FRL); Pleasanton J H (math 30% / reading 34%, grade F, #971 of 1,662 statewide, top 60%, 772 students, 66% FRL); Pleasanton H S (math 59% / reading 51%, grade C, #373 of 1,632 statewide, top 23%, 944 students, 60% FRL).
- Market conditions: 244 active listings in the ZIP; 4 comparable units currently listed for rent nearby; rentals lingering (median 46d on market — plan ~5-8 weeks vacancy on turnover, expect pricing pressure); 50% of comp listings sitting > 30 days — soft ceiling on asking rent; 224 units permitted in Atascosa County in 2024 (0 in 5+ unit buildings).
Forward outlook
- Local home prices are declining (-3.0%/yr); year-one equity from $1k of loan paydown is wiped out by about $4k of value loss. Plan a longer hold.
- Atascosa County population projected at +41% by 2050 — long-run rental-demand tailwind backs the buy-and-hold thesis.
- At projected returns (-3.0% appreciation + 3.0% rent growth), your $42k cash investment doubles in ~9 years — after that, you're playing with house money.
Negotiation context
- It's been on market 358 days — a 12% lower offer ($131k) is reasonable based on typical stale-listing flexibility.
Risks & watch-outs
- Watch-outs: built in 1958 — expect roof / HVAC / electrical / plumbing capex.
Questions for the listing agent
- It's been on market 358 days. Have you received any prior offers? Is the seller open to a 12% concession, seller financing, or rate buy-down credit?
- Can we see the unit-by-unit rent roll, current vacancy, and any below-market leases? What's the average tenancy length?
- What capital expenditures (roof, boiler, parking lot, exteriors) have been made in the last 5 years, and what's planned in the next 2?
- Have any recent inspections been done? Can we get a copy of the seller's disclosures and any deferred-maintenance estimates?
- Built in 1958 — when were the roof, HVAC, electrical panel, plumbing, and water heater last replaced?
- Why hasn't it sold? Are there any deal-killer items the seller is aware of (foundation, flood, title, zoning, code violations)?
- Is there a deadline driving the sale (1031 exchange, divorce, estate, relocation)? That informs how much negotiation room exists.
- What's the average days-on-market for RENTAL listings here right now (not sales)? A rising rental-DOM trend means longer vacancies and softer asking-rent achievability than the comps imply.
- What's the recent tenant-quality profile in this submarket — average credit score on applications, eviction rate, late-payment / NSF rate, and stable-employment percentage? A property-management company in the area should have these aggregated.
- How much new apartment / multifamily construction is in the pipeline within 1–3 miles? Heavy new supply (>2% of stock underway) typically softens rents 12–24 months out; light construction supports rent growth.
Investment metrics
- 1% rule
- 1.26% ✓
- Cap rate
- 9.94%
- Cash-on-cash
- 13.03%
- DSCR
- 1.58
- GRM
- 6.6
CMA / ARV
No comps found within radius.
Projected returns pro-forma
-3.0% appreciation · 3.0% rent growth · sell at horizon
- IRR
- 3.0%
- Equity multiple
- 1.11×
- Total profit
- $4,744
- Equity at exit
- $22,216
- IRR
- 12.5%
- Equity multiple
- 1.99×
- Total profit
- $41,407
- Equity at exit
- $12,883
Cash invested: $41,720 (down + closing). Projections, not guarantees.
Landlord ↔ Tenant lean methodology
- Overall (STATE)
- 87 Strongly Landlord-Friendly
- State Texas
- 87 Strongly Landlord-Friendly · R+5
- County
- — inherits STATE
- City
- — inherits STATE
ZIP-level market 78064
- Home prices YoY
- -32.7%
- Active inventory
- 244
- Price-to-rent
- 13.2×
Monthly cashflow live
- Estimated rent
- $1,877 medium interval (Pro) →
- Mortgage (P&I)
- −$781
- Tax est. 1.5%
- −$186 /mo · $2,235/yr
- Insurance
- −$62
- HOA
- −$0
- Vacancy / Maint / Mgmt
- −$394
- Net cashflow
- $453
Break-even live
Sensitivity live
| Price | -10% $556 | -5% $505 | +0% $453 | +5% $402 | +10% $350 |
|---|---|---|---|---|---|
| Rent | -10% $305 | -5% $379 | +0% $453 | +5% $527 | +10% $601 |
| Rate | -1.0pp $528 | -0.5pp $491 | base $453 | +0.5pp $415 | +1.0pp $375 |
2-unit breakdown (identical units grouped — click to expand)
| Units | Beds | Baths | Est. rent |
|---|---|---|---|
| 2× units | 1 | 1 | $1,878 |
| #1 | 1 | 1 | $939 |
| #2 | 1 | 1 | $939 |
| Total (2 units) | $1,877 | ||
UW: 25.0% down · 7.5% · 30yr · 1.5% tax · 5.0% vac · 8.0% maint · 8.0% mgmt
Financing live
Cash to close
- Down payment
- $37,250
- Closing costs
- $4,470
- Reserves months
- —
- Total cash needed
- —
Loan-product check · same deal, 3 products live
Conventional
25% down · 7.5% · 30yr
- Down + closing
- —
- Monthly P&I
- —
- Monthly cashflow
- —
- DSCR
- —
- Eligible?
- —
Personal DTI + credit; lowest rate.
DSCR
20% down · 8.5% · 30yr
- Down + closing
- —
- Monthly P&I
- —
- Monthly cashflow
- —
- DSCR
- —
- Eligible?
- —
No personal income docs; deal must DSCR.
Hard money
10% down · 12.0% · 12mo
- Down + closing
- —
- Monthly P&I
- —
- Monthly cashflow
- —
- DSCR
- —
- Eligible?
- —
Short-term bridge; refi at stabilization.
Rent comps 4 comps
| Address | Beds | Baths | Sqft | Rent | $/sqft | DOM | Units | Dist |
|---|---|---|---|---|---|---|---|---|
| 535 Austin St Pleasanton, TX | 3.0 | 2.0 | 1536 | $1,675 | $1.09 | 46d | 1 | 0.32mi |
| 541 Dallas St Unit B Pleasanton, TX | 3.0 | 1.5 | 1080 | $1,000 | $0.93 | 26d | 1 | 0.35mi |
| 631 Commerce St Pleasanton, TX | 3.0 | 2.0 | 1324 | $1,500 | $1.13 | 46d | 1 | 0.38mi |
| 404 High Meadow Dr Pleasanton, TX | 3.0 | 2.0 | 1428 | $1,800 | $1.26 | 20d | 1 | 1.24mi |
Listing history 4 events
-
2026-05-31days on market $149,000 Active 358 DOM
-
2025-08-04price $149,000 568-char remark
Show marketing remark (568 chars)
Don't miss this great investment opportunity! This charming duplex sits on a large lot with plenty of space to add additional units. Each unit offers approximately 675 sq ft of comfortable living space, featuring one bedroom, one full bathroom, a walk-in closet, and carpet flooring throughout most of the living areas. Residents will enjoy relaxing on the inviting front porch and benefit from a dedicated covered parking space for each unit. If you're looking to start or expand your rental portfolio, this property offers significant potential with room for growth.
-
2025-07-01price $154,000 568-char remark
Show marketing remark (568 chars)
Don't miss this great investment opportunity! This charming duplex sits on a large lot with plenty of space to add additional units. Each unit offers approximately 675 sq ft of comfortable living space, featuring one bedroom, one full bathroom, a walk-in closet, and carpet flooring throughout most of the living areas. Residents will enjoy relaxing on the inviting front porch and benefit from a dedicated covered parking space for each unit. If you're looking to start or expand your rental portfolio, this property offers significant potential with room for growth.
-
2025-06-07$159,000 New 568-char remark
Show marketing remark (568 chars)
Don't miss this great investment opportunity! This charming duplex sits on a large lot with plenty of space to add additional units. Each unit offers approximately 675 sq ft of comfortable living space, featuring one bedroom, one full bathroom, a walk-in closet, and carpet flooring throughout most of the living areas. Residents will enjoy relaxing on the inviting front porch and benefit from a dedicated covered parking space for each unit. If you're looking to start or expand your rental portfolio, this property offers significant potential with room for growth.
ⓘ Source: listings_history table (triggers on properties + properties_extension) + one-shot
backfill from property_details.listing_events for pre-trigger history.
Nearby sold comps map
Loading sold comps map…
Walkable amenities ~0.75 mi
Loading nearby amenities…
Taxation est. · year 1
- Rental income
- $22,524
- − Mortgage interest
- −$8,346
- − Property taxes
- −$2,235
- − Insurance
- −$745
- − Repairs & maintenance
- −$1,802
- − Management
- −$1,802
- − Depreciation
- −$4,335
- Taxable income
- $3,259
- Est. tax owed @ 24.0%
- −$782
- After-tax cash flow
- $4,655/yr
For passive investors: Depreciation is non-cash, so a rental often shows a tax loss while cash-flowing — sheltering income. Rental losses are passive: they offset passive income freely, and up to $25,000/yr can offset ordinary (W-2) income if you actively participate and your MAGI is under $100k (phasing out to $0 by $150k); unused losses carry forward. On sale, claimed depreciation is recaptured at up to 25%, and gains may owe capital-gains tax (a 1031 exchange can defer both). Figures are a year-1 estimate at your 24.0% rate — not tax advice; consult a CPA.
Condition & rehab AI · 12 photos
This multi-family property requires moderate rehabilitation to address structural issues and improve curb appeal, increasing its resale and rental value.
Repairs flagged
- Major Exterior siding — Exposed structural issues
- Major Foundation repair — Exposed structural issues
- Minor Landscaping — Untended yard
Value-add opportunities
- Both Exterior siding repair — Improves curb appeal and value
- Both Foundation repair — Stabilizes structure and increases value
- Both Landscaping — Enhances curb appeal and value
- Both Kitchen and bathroom upgrades — Modernizes spaces and increases value
Renovation cost estimate screening
| Repair item | Severity | Est. cost |
|---|---|---|
| Exterior siding · Exposed structural issues | Major | $15,000–50,000 |
| Foundation repair · Exposed structural issues | Major | $15,000–50,000 |
| Landscaping · Untended yard | Minor | $500–3,000 |
| Total estimated repair cost · 3 items | $30,500–103,000 |
Value-add ROI direction
- Both Exterior siding repair — Improves curb appeal and value ↑
- Both Foundation repair — Stabilizes structure and increases value ↑
- Both Landscaping — Enhances curb appeal and value ↑
- Both Kitchen and bathroom upgrades — Modernizes spaces and increases value ↑
ⓘ Cost ranges are severity-bucket heuristics (US national rule-of-thumb). Get contractor quotes + a written scope before underwriting a rehab budget.
Schools (NCES district)
- District
- Pleasanton ISD
- NCES district ID
- 4835190
- Math proficiency
- 36% ▼ -2.00%
- Reading proficiency
- 37% ▲ 4.00%
- Median HH income
- $53,885
- Composite
- 31.97/100
- National rank
- #5843
- State rank
- #470 of 826 in TX
Livability — Pleasanton
- Score
- 65/100
- State rank
- #679
- US rank
- #12731
Category grades
Schools grade is shown separately in the Schools card above.
Census & demographics
- Census place
- Pleasanton, TX
- Population (ZIP)
- 16,420
Population outlook (Atascosa County) Hauer SSP2
- Today (2025)
- 57,233 people
- By 2030
- 61,729 · +7.9%
- By 2040
- 71,122 · +24.3%
- By 2050
- 80,906 · +41.4%
- By 2075
- 106,134 · +85.4%
- By 2100
- 122,415 · +113.9%
Race, ethnicity, and origin ACS 2023
- Neighborhood character
- Majority Hispanic (55%)
- Race & ethnicity
- Hispanic / Latino 55% White 41% Two or more races 27% Black 2%
- Hispanic origin (detail)
- Mexican 49%
- Common ancestry
- Romanian 2% Lithuanian 2% Portuguese 1%
- Foreign-born
- 7% · Canada
- Languages at home
- 67% English-only · Spanish 32% Other Indo-European 1% German/W. Germanic 1%
Political lean MEDSL · Atascosa
- 2024 margin
- Solid R (+43.3) · D 27.9% · R 71.3%
- 2008→2024 swing
- -32.8pp toward R · 2008: -10.5pp · 2024: -43.3pp
- All cycles
- 2024: R+43.3 2020: R+34.0 2016: R+29.1 2012: R+18.3 2008: R+10.5
Not yet ingested
- Civics
- —
Market trends
- HPI YoY
- ▼ -91.53%
- Current HPI
- 188.725
- Rent YoY
- —
- Metro
- —
- State GDP YoY
- ▲ 3.95%
- F500 in state
- 110
Industry mix (Fortune 500 HQ in TX)
| Industry | F500 HQs | Revenue |
|---|---|---|
| Energy | 16 | $1,198B |
|
||
| Technology | 5 | $198B |
|
||
| Engineering / Construction | 4 | $72B |
|
||
| Energy Services | 3 | $60B |
|
||
| Utilities | 3 | $41B |
|
||
| Healthcare | 2 | $330B |
|
||
Price history
-6.3% since first listed3 events — show timeline
- 2025-08-04 Price Changed $149,000 LERA
- 2025-07-01 Price Changed $154,000 LERA
- 2025-06-07 Listed $159,000 LERA
Cash-flow waterfall
monthlySold comps — $/sqft
last 12 mo · ≤1 miLoading sold comps…