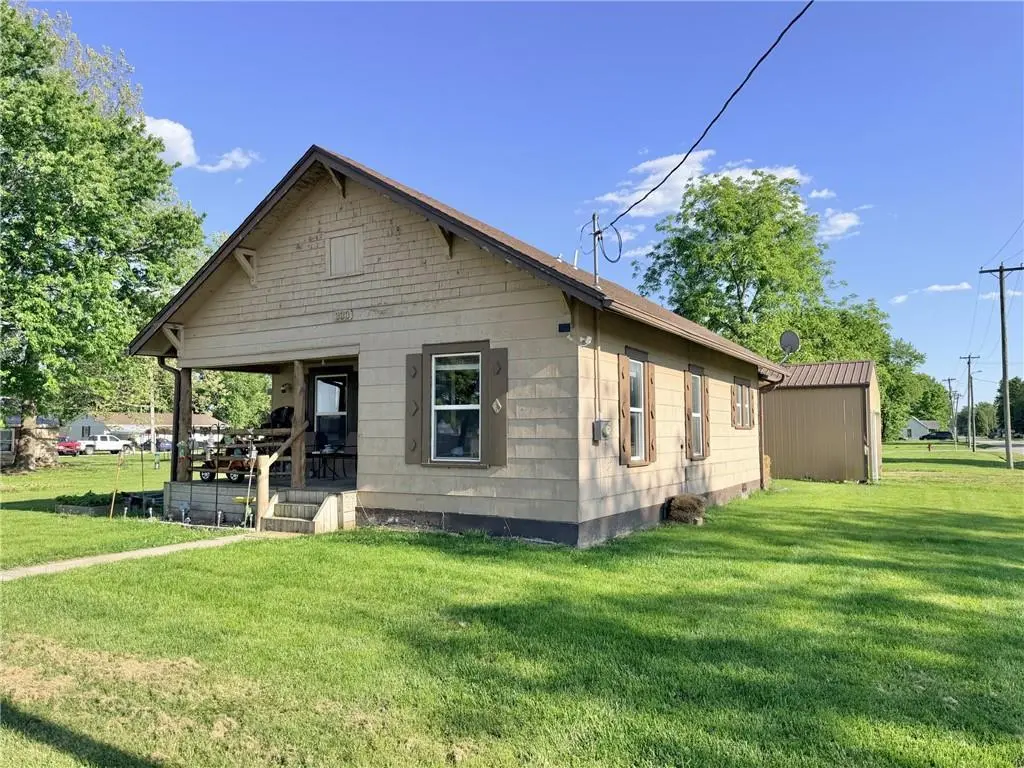
333 3rd St · Gilman City, MO
Flood risk 1/10 · Minimal
- FEMA flood zone
- —
- Chance of flooding over 30 yrs
- 0.0%
- Est. flood insurance / yr
- —
Fire risk 1/10 · Minimal
- Est. fire insurance / yr
- $1,054 – $1,958
Heat risk 3/10 · Minor
- Hot days now (above 104°F)
- 7 days/yr
- Hot days in 30 yrs
- 15 days/yr
Wind risk 2/10 · Minimal
- Chance of severe wind over 30 yrs
- —
Air-quality risk 2/10 · Minimal
- Unhealthy air days now
- 0 days/yr
- Unhealthy air days in 30 yrs
- 2 days/yr
Risk factors via First Street. Map © Google.
Why this score? — see what drove the B- grade
The composite is a weighted blend of 9 inputs, each scored 0–100. Each bar is that input's sub-score; the figure is the points it added to the 100-point composite (weight × sub-score).
- Cash flow +26.9/30.0
- DSCR +9.3/10.0
- ARV discount +7.5/15.0
- 1% rule +6.3/10.0
- Appreciation +5.0/10.0
- Schools +3.4/10.0
- Livability +2.9/5.0
- Rent growth +2.5/5.0
- Condition / age +2.5/5.0
$75,000
🖨 Deal sheet 📄 Offer letter ✓ Due diligence
Listing remarks
Small-Town Charm Meets Cozy Country Living Welcome home to this adorable country chic bungalow nestled in the heart of Gilman City, Missouri — the very definition of a “Mayberry” kind of town. With its friendly neighbors, small-town values, and close-knit school community, Gilman City offers the peaceful lifestyle so many buyers are searching for. This inviting 2-bedroom, 1-bath home is full of warmth and character, featuring beautiful wood ceilings, cozy living spaces, and charming vintage touches throughout. The spacious country kitchen offers plenty of cabinet storage and comes with the stove. Just off the kitchen, you’ll find a convenient laundry nook with washe
Key facts
- Large level yard
- Central heat and air
- 0.23 acre lot
Tags
Property features AI
Finance
- Other: Lot approximately 10,000 sq ft (100 x 100)
- HOA & community: No association fees
Exterior
- Parking: Attached garage (1 car)
- Utilities: Public water; Public sewer; Paved road access
- Home design: Single family residence; Residential property; Bungalow; One-story (main level living)
- Construction: Composition roof; Other construction materials; Basement: concrete and crawl space; Estimated age: 76–100 years
- Exterior features: Porch
Interior
- Kitchen: Electric range
- Bedrooms: 2 bedrooms (both on main level)
- Flooring: Carpet; Laminate
- Bathrooms: 1 full bathroom (on main level)
- Heating & cooling: Forced air heating (propane); Electric cooling
- Interior features: Thermal windows; Family room; Formal dining area; Bungalow floor plan
- Laundry & utility: Laundry room off the kitchen; Washer; Dryer
Neighborhood map
What this means for you Summary
Snapshot
- This is a 2-bed/1.0-bath other listed at $75k.
Deal economics
- At list price, monthly cash flow is $207 ($2k/yr) — positive.
- The deal already cash-flows at list — no discount required.
- Meets the 1% rule at list price ($849 rent vs $75k).
- Recommended offer: $74k (1.5% below list) — sets the bar for market timing.
Location & tenants
- Location reads 58/100 on livability (#621 in MO) — a working-class tenant base; expect higher turnover. Strengths: cost of living A+, housing A+; Watch: schools C-, employment D+, crime F.
- Gilman City R-IV (rural): math 35% / reading 40% proficiency, ranked #360 of 535 in MO (top 67%) — families likely to look elsewhere, expect single-tenant / working-renter base with shorter leases.
- Market conditions: 4 active listings in the ZIP; 2 units permitted in Harrison County in 2024 (0 in 5+ unit buildings).
Forward outlook
- In year one you build about $3k of equity ($519 loan paydown + $2k appreciation (3.0% local appreciation)).
- Harrison County population projected at -22% by 2050 — secular population decline; favor cash flow + early exit over multi-decade hold.
- At projected returns (3.0% appreciation + 3.0% rent growth), your $21k cash investment doubles in ~4 years — after that, you're playing with house money.
Negotiation context
- It's been on market 16 days — a 2% lower offer ($74k) is reasonable based on typical stale-listing flexibility.
- Current owner paid $14k; list at $75k implies a 436% gain — meaningful room to come down on a strong offer.
Risks & watch-outs
- Watch-outs: built in 1930 — expect roof / HVAC / electrical / plumbing capex.
Questions for the listing agent
- Built in 1930 — when were the roof, HVAC, electrical panel, plumbing, and water heater last replaced?
- Is there a deadline driving the sale (1031 exchange, divorce, estate, relocation)? That informs how much negotiation room exists.
- Crime grade is F in this area — have there been break-ins, vandalism, or insurance claims at this property in the last 3 years? What carrier currently insures it and at what premium?
- What's the average days-on-market for RENTAL listings here right now (not sales)? A rising rental-DOM trend means longer vacancies and softer asking-rent achievability than the comps imply.
- What's the recent tenant-quality profile in this submarket — average credit score on applications, eviction rate, late-payment / NSF rate, and stable-employment percentage? A property-management company in the area should have these aggregated.
- How much new for-sale + rental construction is in the pipeline within 1–3 miles? Heavy new supply typically softens prices + rents 12–24 months out; constrained supply supports both.
Investment metrics
- 1% rule
- 1.13% ✓
- Cap rate
- 9.60%
- Cash-on-cash
- 11.80%
- DSCR
- 1.53
- GRM
- 7.4
CMA / ARV
- ARV (median comp)
- $49,388
- List price
- $75,000
- Delta
- 51.86%
- Verdict
- OVERPRICED
- Comps
- 3 within 1.0 mi
Projected returns pro-forma
3.0% appreciation · 3.0% rent growth · sell at horizon
- IRR
- 18.5%
- Equity multiple
- 2.06×
- Total profit
- $22,170
- Equity at exit
- $33,723
- IRR
- 19.9%
- Equity multiple
- 3.88×
- Total profit
- $60,470
- Equity at exit
- $51,972
Cash invested: $21,000 (down + closing). Projections, not guarantees.
Landlord ↔ Tenant lean methodology
- Overall (STATE)
- 81 Strongly Landlord-Friendly
- State Missouri
- 81 Strongly Landlord-Friendly · R+10
- County
- — inherits STATE
- City
- — inherits STATE
ZIP-level market 64642
- Active inventory
- 4
- Price-to-rent
- 7.4×
Monthly cashflow live
- Estimated rent
- $849 medium interval (Pro) →
- Mortgage (P&I)
- −$393
- Tax from tax record
- −$39 /mo · $472/yr
- Insurance
- −$31
- HOA
- −$0
- Vacancy / Maint / Mgmt
- −$178
- Net cashflow
- $207
Break-even live
UW: 25.0% down · 7.5% · 30yr · 1.5% tax · 5.0% vac · 8.0% maint · 8.0% mgmt
Financing live
Cash to close
- Down payment
- $18,750
- Closing costs
- $2,250
- Reserves months
- —
- Total cash needed
- —
Loan-product check · same deal, 3 products live
Conventional
25% down · 7.5% · 30yr
- Down + closing
- —
- Monthly P&I
- —
- Monthly cashflow
- —
- DSCR
- —
- Eligible?
- —
Personal DTI + credit; lowest rate.
DSCR
20% down · 8.5% · 30yr
- Down + closing
- —
- Monthly P&I
- —
- Monthly cashflow
- —
- DSCR
- —
- Eligible?
- —
No personal income docs; deal must DSCR.
Hard money
10% down · 12.0% · 12mo
- Down + closing
- —
- Monthly P&I
- —
- Monthly cashflow
- —
- DSCR
- —
- Eligible?
- —
Short-term bridge; refi at stabilization.
Listing history 4 events
-
2026-05-12$75,000 Active 1175-char remark
-
2017-09-01soldstatus $14,000
-
2009-07-23soldstatus $12,000
-
1997-11-28soldstatus
ⓘ Source: listings_history table (triggers on properties + properties_extension) + one-shot
backfill from property_details.listing_events for pre-trigger history.
Tax reassessment forecast MO · Resets to sale price
- Current annual tax
- $472 · $39/mo
- Projected year-2 tax
- $728 · $61/mo
- Expected delta
- +$255/yr (+$21/mo · 54.0%)
ⓘ Screening estimate from a state-policy table — verify with the county assessor before closing.
Climate risk First Street
- Flood 1/10 Low 0% chance over 30 yrs
- Wildfire 1/10 Low
- Heat 3/10 Moderate 7 d/yr ≥104°F today · 15 d/yr by 30 yrs out
- Wind 2/10 Low
- Air quality 2/10 Low 0 unhealthy d/yr today · 2 by 30 yrs out
Nearby sold comps map
Loading sold comps map…
Walkable amenities ~0.75 mi
Loading nearby amenities…
Taxation est. · year 1
- Rental income
- $10,185
- − Mortgage interest
- −$4,201
- − Property taxes
- −$472
- − Insurance
- −$375
- − Repairs & maintenance
- −$815
- − Management
- −$815
- − Depreciation
- −$2,182
- Taxable income
- $1,325
- Est. tax owed @ 24.0%
- −$318
- After-tax cash flow
- $2,161/yr
For passive investors: Depreciation is non-cash, so a rental often shows a tax loss while cash-flowing — sheltering income. Rental losses are passive: they offset passive income freely, and up to $25,000/yr can offset ordinary (W-2) income if you actively participate and your MAGI is under $100k (phasing out to $0 by $150k); unused losses carry forward. On sale, claimed depreciation is recaptured at up to 25%, and gains may owe capital-gains tax (a 1031 exchange can defer both). Figures are a year-1 estimate at your 24.0% rate — not tax advice; consult a CPA.
Schools (NCES district)
- District
- Gilman City R-IV
- NCES district ID
- 2912870
- Math proficiency
- 35% ▼ -5.00%
- Reading proficiency
- 40% ▬ 0.00%
- Median HH income
- $38,873
- Composite
- 33.88/100
- National rank
- #10356
- State rank
- #360 of 535 in MO
Livability — Gilman City
- Score
- 58/100
- State rank
- #621
- US rank
- #21447
Category grades
Schools grade is shown separately in the Schools card above.
Census & demographics
- Census place
- Gilman City, MO
- Population (ZIP)
- 694
Population outlook (Harrison County) Hauer SSP2
- Today (2025)
- 7,893 people
- By 2030
- 7,511 · -4.8%
- By 2040
- 6,811 · -13.7%
- By 2050
- 6,131 · -22.3%
- By 2075
- 4,814 · -39.0%
- By 2100
- 3,643 · -53.8%
Race, ethnicity, and origin ACS 2023
- Neighborhood character
- Predominantly White (91%)
- Race & ethnicity
- White 91% Two or more races 6% Hispanic / Latino 5% Black 1%
- Common ancestry
- Scotch-Irish 4% Slovak 3% Iranian 2%
- Foreign-born
- 2% · Canada
Political lean MEDSL · Harrison
- 2024 margin
- Solid R (+71.8) · D 13.9% · R 85.6%
- 2008→2024 swing
- -40.5pp toward R · 2008: -31.3pp · 2024: -71.8pp
- All cycles
- 2024: R+71.8 2020: R+68.0 2016: R+64.9 2012: R+44.4 2008: R+31.3
Not yet ingested
- Civics
- —
Market trends
- HPI YoY
- —
- Current HPI
- —
- Rent YoY
- —
- Metro
- —
- State GDP YoY
- ▲ 1.84%
- F500 in state
- 20
Industry mix (Fortune 500 HQ in MO)
| Industry | F500 HQs | Revenue |
|---|---|---|
| Healthcare | 1 | $163B |
|
||
| Insurance | 1 | $21B |
|
||
| Industrial Technology | 1 | $17B |
|
||
| Retail | 1 | $16B |
|
||
| Industrial Distribution | 1 | $10B |
|
||
| Utilities | 1 | $9B |
|
||
Price history
+525.0% since first listed5 events — show timeline
- 2026-05-29 Pending — Heartland MLS as Distributed by MLS Grid
- 2026-05-12 Listed $75,000 Heartland MLS as Distributed by MLS Grid
- 2017-09-01 Sold (Public Records) $14,000 Public Records
- 2009-07-23 Sold (Public Records) $12,000 Public Records
- 1997-11-28 Sold (Public Records) — Public Records
Property tax history
+8.6%/yrLatest (2025): $472 · +11.3% YoY. Source: county tax records.
Cash-flow waterfall
monthlySold comps — $/sqft
last 12 mo · ≤1 miLoading sold comps…