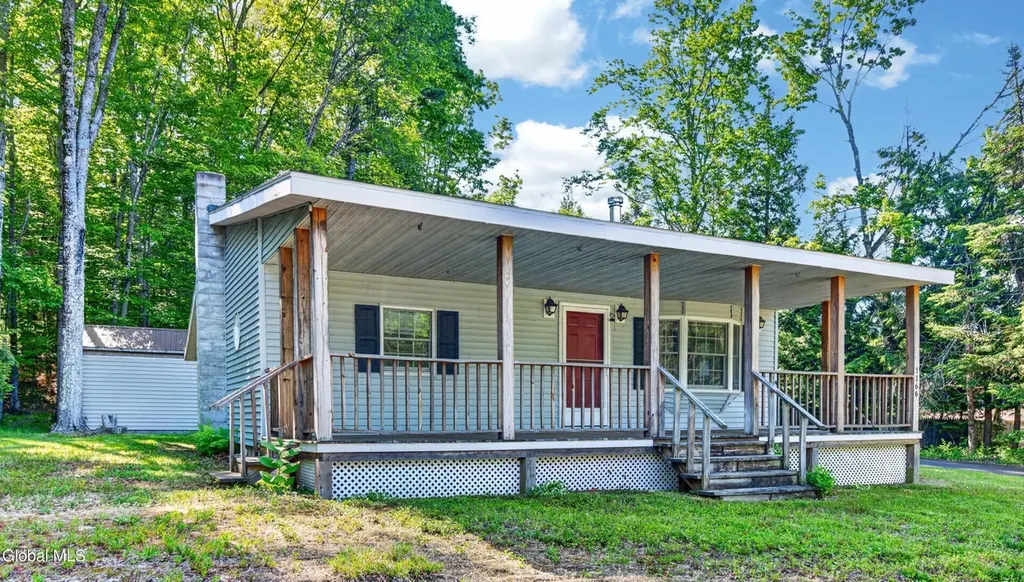
1166 County Road 110 · Broadalbin, NY
Flood risk 1/10 · Minimal
- FEMA flood zone
- X
- Chance of flooding over 30 yrs
- 0.0%
- Est. flood insurance / yr
- $473 – $860
Fire risk 3/10 · Minor
- Est. fire insurance / yr
- $691 – $1,283
Heat risk 2/10 · Minimal
- Hot days now (above 92°F)
- 7 days/yr
- Hot days in 30 yrs
- 16 days/yr
Wind risk 2/10 · Minimal
- Chance of severe wind over 30 yrs
- 3.0%
Air-quality risk 1/10 · Minimal
- Unhealthy air days now
- 0 days/yr
- Unhealthy air days in 30 yrs
- 0 days/yr
Risk factors via First Street. Map © Google.
Why this score? — see what drove the D+ grade
The composite is a weighted blend of 9 inputs, each scored 0–100. Each bar is that input's sub-score; the figure is the points it added to the 100-point composite (weight × sub-score).
- ARV discount +15.0/15.0
- Appreciation +10.0/10.0
- Cash flow +7.0/30.0
- Schools +4.8/10.0
- Livability +3.7/5.0
- Rent growth +2.5/5.0
- Condition / age +2.5/5.0
- 1% rule +2.3/10.0
- DSCR +1.2/10.0
$185,000
🖨 Deal sheet (PDF) 📄 Offer letter ✓ Due diligence
Listing remarks MLS
This well maintained 2 bedroom stick built ranch home with a full basement and work area has a 10' Great Sacandaga Lake permit with a mooring just a short drive away. The carport is 2 years old and the home has a newer roof with architectural shingles and a transferable warranty. Enjoy relaxing on the covered porch or entertaining on the patio in the private backyard for barbecue's and entertaining. Mooring, Good Condition
Key facts
- Drilled wells
- Back yard
- Wood stove
Tags
Property features AI
Exterior
- Parking: Two garage spaces; Total parking for six vehicles; Carport; Driveway; On-site storage
- Utilities: 150 amp electrical service with circuit breakers; Septic tank
- Home design: Single family residence
- Construction: Vinyl siding; Block foundation; Asphalt roof
- Exterior features: Covered patio/porch and deck with front porch; Driveway paved; Shed(s); Deeded water access to Great Sacandaga Lake (permit required); Level lot with road frontage
Interior
- Kitchen: Range; Refrigerator
- Bedrooms: Two bedrooms on the first floor
- Flooring: Tile
- Bathrooms: One full bathroom on the first floor
- Heating & cooling: Forced air heating; Oil heating
- Interior features: High speed internet; Wood burning stove fireplace; Full unfinished basement
- Laundry & utility: Laundry in basement
Neighborhood map
What this means for you Summary
Snapshot
- This is a 2-bed/1.0-bath single-family listed at $185k.
Deal economics
- At list price, monthly cash flow is $-272 ($-3k/yr) — negative.
- To cash-flow at today's rent, offer at most $137k (26.0% below list).
- To meet the 1% rule (rent ≥ 1% of price), the offer needs to be $136k (26.5% below list).
- Recommended offer: $136k (26.5% below list) — sets the bar for 1% rule.
- Cap rate 4.5% vs local median 3.2% in Broadalbin — top-decile yield for the area; either an underpriced asset or a hidden risk that comps aren't pricing in. Stress-test before assuming the spread holds.
Location & tenants
- Location reads 74/100 on livability (#290 in NY, #4,681 nationally) — a middle-class / working-renter tenant base. Strengths: housing A+, crime A, employment A-; Watch: amenities F, commute F, health & safety D-.
- Broadalbin-Perth Central School District (rural): math 50% / reading 62% proficiency, ranked #286 of 590 in NY (top 48%) — acceptable for families but not a draw, mixed tenant base, ~2y average lease.
- Zoned schools: Broadalbin-Perth Elementary School (math 44% / reading 57%, grade D+, #1,053 of 2,108 statewide, top 50%, 897 students, 39% FRL); Broadalbin-Perth Junior-Senior High School (math 58% / reading 69%, grade B-, #810 of 1,100 statewide, top 74%, 796 students, 0% FRL).
- Market conditions: 37 active listings in the ZIP; 112 units permitted in Fulton County in 2024 (50 in 5+ unit buildings).
Forward outlook
- In year one you build about $20k of equity ($1k loan paydown + $18k appreciation (10.0% local appreciation)).
- Fulton County population projected at -23% by 2050 — secular population decline; favor cash flow + early exit over multi-decade hold.
- By year 2, paydown + projected appreciation supports a ~$32k cash-out refi (75% LTV) — recoverable capital for the next deal without selling this one.
Negotiation context
- It's been on market 17 days — a 2% lower offer ($182k) is reasonable based on typical stale-listing flexibility.
- 4 sale attempts since 17y ago with the ask held roughly flat each time — persistent listings suggest the price (not the market) is what's stuck; bring a comps-based counter.
- Current owner paid $160k; 16% above their basis — modest negotiation headroom, anchor on the comps not their cost.
Questions for the listing agent
- What do current leases actually rent for vs. the listed asking? Can we see a recent rent roll and the last 12 months of T-12 income?
- Is there a deadline driving the sale (1031 exchange, divorce, estate, relocation)? That informs how much negotiation room exists.
- Schools are A-rated — typically a magnet for longer-tenancy family renters. What's the average tenant stay here, and is there a school-zone premium baked into asking?
- The area grade is low — what's the realistic commute time and amenity access for the typical tenant pool here? Any planned neighborhood developments (good or bad) we should know about?
- What's the average days-on-market for RENTAL listings here right now (not sales)? A rising rental-DOM trend means longer vacancies and softer asking-rent achievability than the comps imply.
- What's the recent tenant-quality profile in this submarket — average credit score on applications, eviction rate, late-payment / NSF rate, and stable-employment percentage? A property-management company in the area should have these aggregated.
- How much new for-sale + rental construction is in the pipeline within 1–3 miles? Heavy new supply typically softens prices + rents 12–24 months out; constrained supply supports both.
Investment metrics
- 1% rule
- 0.73% ✗
- Cap rate
- 4.53%
- Cash-on-cash
- -6.30%
- DSCR
- 0.72
- GRM
- 11.3
CMA / ARV
- ARV (on-the-fly)
- $251,900
- Comps found
- 3
Show comp detail 3 sales within ~0.75 mi
| Address | Dist | Beds/Ba | Sqft | Sold | Price | $/sf | Match |
|---|---|---|---|---|---|---|---|
| 127 Ridgewood Ave | 0.20mi | 2/1.0 | 1,188 (+8%) | 21mo | $277,000 | $233 | 60 |
| 134 Vunk Rd Unit EXT. | 0.19mi | 2/1.0 | 960 (-13%) | 20mo | $220,000 | $229 | 54 |
| 123 Chase St | 0.54mi | 3/1.0 (+1) | 1,088 (-1%) | 20mo | $185,000 | $170 | 52 |
Match score weights: distance 35% · size 25% · config 20% · recency 20%. Top-matched comps best support the ARV.
Projected returns pro-forma
10.0% appreciation · 3.0% rent growth · sell at horizon
- IRR
- 19.8%
- Equity multiple
- 2.61×
- Total profit
- $83,505
- Equity at exit
- $166,663
- IRR
- 18.2%
- Equity multiple
- 6.01×
- Total profit
- $259,646
- Equity at exit
- $359,414
Cash invested: $51,800 (down + closing). Projections, not guarantees.
Landlord ↔ Tenant lean methodology
- Overall (STATE)
- 15 Strongly Tenant-Friendly
- State New York
- 15 Strongly Tenant-Friendly · D+10
- County
- — inherits STATE
- City
- — inherits STATE
ZIP-level market 12025
- Home prices YoY
- 13.4%
- Active inventory
- 37
- Price-to-rent
- 11.3×
Monthly cashflow live
- Estimated rent
- $1,359 medium interval (Pro) →
- Mortgage (P&I)
- −$970
- Tax from tax record
- −$298 /mo · $3,577/yr
- Insurance
- −$77
- HOA
- −$0
- Vacancy / Maint / Mgmt
- −$285
- Net cashflow
- $-272
Break-even live
Sensitivity live
| Price | -10% $-167 | -5% $-219 | +0% $-272 | +5% $-324 | +10% $-377 |
|---|---|---|---|---|---|
| Rent | -10% $-379 | -5% $-325 | +0% $-272 | +5% $-218 | +10% $-164 |
| Rate | -1.0pp $-179 | -0.5pp $-225 | base $-272 | +0.5pp $-320 | +1.0pp $-369 |
UW: 25.0% down · 7.5% · 30yr · 1.5% tax · 5.0% vac · 8.0% maint · 8.0% mgmt
Financing live
Cash to close
- Down payment
- $46,250
- Closing costs
- $5,550
- Reserves months
- —
- Total cash needed
- —
Loan-product check · same deal, 3 products live
Conventional
25% down · 7.5% · 30yr
- Down + closing
- —
- Monthly P&I
- —
- Monthly cashflow
- —
- DSCR
- —
- Eligible?
- —
Personal DTI + credit; lowest rate.
DSCR
20% down · 8.5% · 30yr
- Down + closing
- —
- Monthly P&I
- —
- Monthly cashflow
- —
- DSCR
- —
- Eligible?
- —
No personal income docs; deal must DSCR.
Hard money
10% down · 12.0% · 12mo
- Down + closing
- —
- Monthly P&I
- —
- Monthly cashflow
- —
- DSCR
- —
- Eligible?
- —
Short-term bridge; refi at stabilization.
Listing history 16 events
-
2026-06-22days on market $185,000 Active 17 DOM
-
2026-06-21days on market $185,000 Active 16 DOM
-
2026-06-21days on market $185,000 Active 15 DOM
-
2026-06-18days on market $185,000 Active 13 DOM
-
2026-06-18remarks 699-char remark
-
2026-06-17days on market $185,000 Active 12 DOM
-
2026-06-16days on market $185,000 Active 11 DOM
-
2026-06-15days on market $185,000 Active 10 DOM
-
2026-06-13days on market $185,000 Active 8 DOM
-
2026-06-12days on market $185,000 Active 7 DOM
-
2026-06-09days on market $185,000 Active 4 DOM
-
2026-06-09remarks 623-char remark
-
2026-06-08days on market $185,000 Active 3 DOM
-
2026-06-07days on market $185,000 Active 2 DOM
-
2026-06-07remarks 598-char remark
-
2026-06-07$185,000 Active 1 DOM
ⓘ Source: listings_history table (triggers on properties + properties_extension) + one-shot
backfill from property_details.listing_events for pre-trigger history.
Tax reassessment forecast NY · Partial reset (capped growth)
- Current annual tax
- $3,577 · $298/mo
- Projected year-2 tax
- $3,577 · $298/mo
- Expected delta
- $0/yr ($0/mo · 0.0%)
ⓘ Screening estimate from a state-policy table — verify with the county assessor before closing.
Climate risk First Street
- Flood 1/10 Low FEMA zone X · 0% chance over 30 yrs
- Wildfire 3/10 Moderate
- Heat 2/10 Low 7 d/yr ≥92°F today · 16 d/yr by 30 yrs out
- Wind 2/10 Low 3% chance of damaging wind over 30 yrs
- Air quality 1/10 Low 0 unhealthy d/yr today · 0 by 30 yrs out
Nearby sold comps map
Loading sold comps map…
Walkable amenities ~0.75 mi
Loading nearby amenities…
Taxation est. · year 1
- Rental income
- $16,307
- − Mortgage interest
- −$10,363
- − Property taxes
- −$3,577
- − Insurance
- −$925
- − Repairs & maintenance
- −$1,305
- − Management
- −$1,305
- − Depreciation
- −$5,382
- Taxable loss
- −$6,549
- Est. tax savings @ 24.0%
- +$1,572
- After-tax cash flow
- $-1,690/yr
For passive investors: Depreciation is non-cash, so a rental often shows a tax loss while cash-flowing — sheltering income. Rental losses are passive: they offset passive income freely, and up to $25,000/yr can offset ordinary (W-2) income if you actively participate and your MAGI is under $100k (phasing out to $0 by $150k); unused losses carry forward. On sale, claimed depreciation is recaptured at up to 25%, and gains may owe capital-gains tax (a 1031 exchange can defer both). Figures are a year-1 estimate at your 24.0% rate — not tax advice; consult a CPA.
Schools (NCES district)
- District
- Broadalbin-Perth Central School District
- NCES district ID
- 3600005
- Math proficiency
- 50% ▼ -7.00%
- Reading proficiency
- 62% ▲ 13.00%
- Median HH income
- $55,862
- Composite
- 48.28/100
- National rank
- #2154
- State rank
- #286 of 590 in NY
Livability — Broadalbin
- Score
- 74/100
- State rank
- #290
- US rank
- #4681
Category grades
Schools grade is shown separately in the Schools card above.
Census & demographics
- Population (ZIP)
- 5,278
Population outlook (Fulton County) Hauer SSP2
- Today (2025)
- 51,132 people
- By 2030
- 49,114 · -3.9%
- By 2040
- 44,373 · -13.2%
- By 2050
- 39,321 · -23.1%
- By 2075
- 28,503 · -44.3%
- By 2100
- 19,268 · -62.3%
Race, ethnicity, and origin ACS 2023
- Neighborhood character
- Predominantly White (89%)
- Race & ethnicity
- White 89% Two or more races 7% Hispanic / Latino 4% Asian 1%
- Common ancestry
- Romanian 8% Lithuanian 7% Iranian 5%
- Foreign-born
- 2% · China, Canada
- Languages at home
- 97% English-only · Chinese 1% Other Indo-European 1% Spanish 1%
Political lean MEDSL · Fulton
- 2024 margin
- Solid R (+35.9) · D 32.1% · R 67.9%
- 2008→2024 swing
- -26.6pp toward R · 2008: -9.2pp · 2024: -35.9pp
- All cycles
- 2024: R+35.9 2020: R+31.4 2016: R+35.5 2012: R+10.5 2008: R+9.2
Not yet ingested
- Civics
- —
Market trends
- HPI YoY
- ▲ 40.87%
- Current HPI
- 344.7778
- Rent YoY
- —
- Metro
- —
- State GDP YoY
- ▲ 2.60%
- F500 in state
- 92
Industry mix (Fortune 500 HQ in NY)
| Industry | F500 HQs | Revenue |
|---|---|---|
| Financial Services | 10 | $950B |
|
||
| Consumer Goods | 9 | $162B |
|
||
| Insurance | 4 | $225B |
|
||
| Telecommunications | 2 | $144B |
|
||
| Pharmaceuticals | 2 | $112B |
|
||
| Media / Entertainment | 2 | $69B |
|
||
Price history
+55.5% since first listed17 events — show timeline
- 2026-06-05 Listed $185,000 Global MLS
- 2021-08-13 Sold (Public Records) $160,000 Public Records
- 2021-08-12 Sold (MLS) $160,000 Global MLS
- 2021-06-21 Pending — Global MLS
- 2021-05-27 Price Changed $199,900 Global MLS
- 2021-04-29 Price Changed $220,000 Global MLS
- 2021-04-01 Price Changed $235,000 Global MLS
- 2021-03-03 Price Changed $245,000 Global MLS
- 2021-02-25 Price Changed $260,000 Global MLS
- 2021-02-17 Price Changed $265,000 Global MLS
- 2021-02-09 Listed $270,000 Global MLS
- 2015-12-18 Sold (Public Records) $118,500 Public Records
- 2015-12-16 Sold (MLS) $118,500 Global MLS
- 2015-09-29 Pending — Global MLS
- 2015-09-16 Listed $119,000 Global MLS
- 2010-03-15 Listing Removed — Global MLS
- 2009-09-14 Listed $119,000 Global MLS
Property tax history
+5.3%/yrLatest (2025): $3,577 · +1.4% YoY. Source: county tax records.
Cash-flow waterfall
monthlySold comps — $/sqft
last 12 mo · ≤1 miLoading sold comps…