3300 Pebblebrook Dr #50 · Seabrook, TX
Flood risk 8/10 · Major
- FEMA flood zone
- X (shaded)
- Chance of flooding over 30 yrs
- 0.97%
- Est. flood insurance / yr
- $507 – $1,088
Fire risk 1/10 · Minimal
- Est. fire insurance / yr
- $1,222 – $2,270
Heat risk 10/10 · Severe
- Hot days now (above 108°F)
- 7 days/yr
- Hot days in 30 yrs
- 25 days/yr
Wind risk 9/10 · Severe
- Chance of severe wind over 30 yrs
- 99.0%
Air-quality risk 2/10 · Minimal
- Unhealthy air days now
- 1 days/yr
- Unhealthy air days in 30 yrs
- 1 days/yr
Risk factors via First Street. Map © Google.
Why this score? — see what drove the B- grade
The composite is a weighted blend of 9 inputs, each scored 0–100. Each bar is that input's sub-score; the figure is the points it added to the 100-point composite (weight × sub-score).
- Cash flow +27.1/30.0
- DSCR +9.4/10.0
- 1% rule +8.3/10.0
- ARV discount +7.5/15.0
- Schools +4.6/10.0
- Rent growth +3.7/5.0
- Livability +3.5/5.0
- Condition / age +2.5/5.0
- Appreciation +0.0/10.0
$82,500
🖨 Deal sheet 📄 Offer letter ✓ Due diligence
Listing remarks MLS
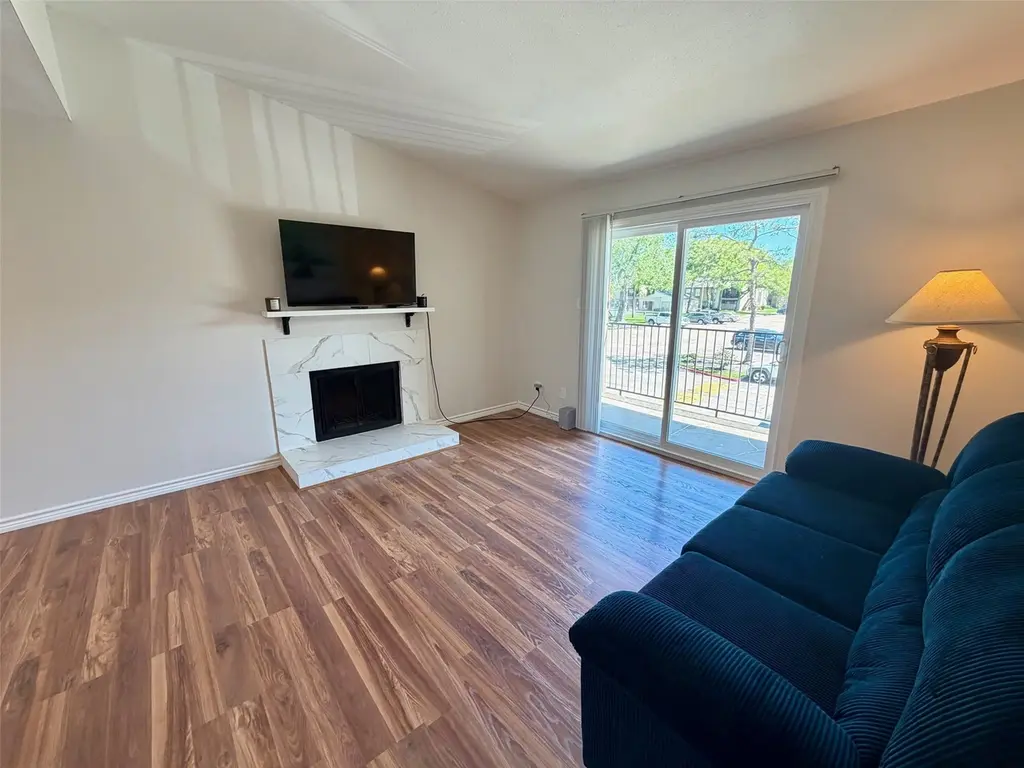
This beautifully updated condo is ready to move in and enjoy or be a great income generating property! Recent updates include new vinyl sliding glass doors to the balcony, freshly painted interior, pretty laminate wood flooring throughout, fireplace quartz tile, mantle and wall mount TV, updated lighting and ceiling fans, the kitchen has been updated with gorgeous butcher block wood counter tops, new cabinetry and new appliances, the bath has been updated with new vanity, countertops,backsplash, mirrors, toilet, tub and pretty quarts tile surround,tile flooring, faucets and lighting. The primary bed features a huge walk in closet plus a secondary closet and the kitchen has a laundry area for a stack washer and dryer (not included). This one is turn-key, easy to show and ready for a quick closing!
Key facts
- Laundry area
- Quartz tile surround
- New cabinetry
Tags
Neighborhood map
What this means for you Summary
Snapshot
- This is a 1-bed/1.0-bath condo listed at $82k.
Deal economics
- At list price, monthly cash flow is $168 ($2k/yr) — positive.
- The deal already cash-flows at list — no discount required.
- Meets the 1% rule at list price ($1k rent vs $82k).
- Recommended offer: $78k (6.0% below list) — sets the bar for market timing.
- Cap rate 9.7% vs local median 2.2% in Seabrook — top-decile yield for the area; either an underpriced asset or a hidden risk that comps aren't pricing in. Stress-test before assuming the spread holds.
Location & tenants
- Location reads 70/100 on livability (#359 in TX) — a middle-class / working-renter tenant base. Strengths: employment A+, housing A+, cost of living B+; Watch: amenities F, commute F.
- Clear Creek ISD (suburban): math 48% / reading 54% proficiency, ranked #114 of 826 in TX (top 14%) — acceptable for families but not a draw, mixed tenant base, ~2y average lease.
- Market conditions: Rents rising fast (+4.9%/yr); 326 active listings in the ZIP; 40 comparable units currently listed for rent nearby; rentals leasing fast (median 12d on market — plan ~1-2 weeks tenant-placement turnaround); high-income renter base; 29,883 units permitted in Harris County in 2024 (8,621 in 5+ unit buildings).
- This rent is only 12% of the median local income ($114k/yr) — well below the 30% rent-burden line; pricing power to push rent on renewal without tenant pushback.
Forward outlook
- Local home prices are declining (-3.0%/yr); year-one equity from $570 of loan paydown is wiped out by about $2k of value loss. Plan a longer hold.
- Harris County population projected at +47% by 2050 — long-run rental-demand tailwind backs the buy-and-hold thesis.
- At projected returns (-3.0% appreciation + 4.9% rent growth), your $23k cash investment doubles in ~10 years — after that, you're playing with house money.
Negotiation context
- It's been on market 73 days — a 6% lower offer ($78k) is reasonable based on typical stale-listing flexibility.
- 4 sale attempts; this cycle's ask is 7400% above the opening price — seller raised mid-cycle; expect resistance to lowballs.
- Current owner paid $22k; list at $82k implies a 284% gain — meaningful room to come down on a strong offer.
Risks & watch-outs
- Watch-outs: flood insurance adds $66/mo.
- Climate carrying-cost: severe flood risk; severe wind risk, 99% chance of damaging wind over 30y; extreme-heat days projected 7→25/yr by 2055 (HVAC capex compounding) — expect insurance premiums to compound above CPI over the hold.
Questions for the listing agent
- It's been on market 73 days. Have you received any prior offers? Is the seller open to a 6% concession, seller financing, or rate buy-down credit?
- What's the actual annual flood-insurance premium (NFIP or private), and is the property in a SFHA with mandatory coverage?
- What does the HOA fee cover, when was the last increase, and are there any pending special assessments or reserve-fund shortfalls?
- Any open or pending special assessments — roof, HVAC, plumbing, elevator, façade? What's the per-unit balance and payoff schedule, and is the seller paying it off at close or rolling it to the buyer?
- Why hasn't it sold? Are there any deal-killer items the seller is aware of (foundation, flood, title, zoning, code violations)?
- Is there a deadline driving the sale (1031 exchange, divorce, estate, relocation)? That informs how much negotiation room exists.
- Schools are B-rated — typically a magnet for longer-tenancy family renters. What's the average tenant stay here, and is there a school-zone premium baked into asking?
- What's the average days-on-market for RENTAL listings here right now (not sales)? A rising rental-DOM trend means longer vacancies and softer asking-rent achievability than the comps imply.
- What's the recent tenant-quality profile in this submarket — average credit score on applications, eviction rate, late-payment / NSF rate, and stable-employment percentage? A property-management company in the area should have these aggregated.
- How much new apartment / multifamily construction is in the pipeline within 1–3 miles? Heavy new supply (>2% of stock underway) typically softens rents 12–24 months out; light construction supports rent growth.
Investment metrics
- 1% rule
- 1.33% ✓
- Cap rate
- 9.71%
- Cash-on-cash
- 12.20%
- DSCR
- 1.54
- GRM
- 6.2
CMA / ARV
No comps found within radius.
Projected returns pro-forma
-3.0% appreciation · 4.86% rent growth · sell at horizon
- IRR
- -0.5%
- Equity multiple
- 0.98×
- Total profit
- $-453
- Equity at exit
- $12,301
- IRR
- 11.4%
- Equity multiple
- 1.98×
- Total profit
- $22,745
- Equity at exit
- $7,133
Cash invested: $23,100 (down + closing). Projections, not guarantees.
Landlord ↔ Tenant lean methodology
- Overall (STATE)
- 87 Strongly Landlord-Friendly
- State Texas
- 87 Strongly Landlord-Friendly · R+5
- County
- — inherits STATE
- City
- — inherits STATE
ZIP-level market 77586
- Rents YoY
- 4.9%
- Active inventory
- 326
- Price-to-rent
- 6.2×
Monthly cashflow live
- Estimated rent
- $1,101 high interval (Pro) →
- Mortgage (P&I)
- −$433
- Tax from tax record
- −$129 /mo · $1,544/yr
- Insurance
- −$34
- Flood insurance flood zone
- −$66 /mo · $798/yr
- HOA
- −$39
- Vacancy / Maint / Mgmt
- −$231
- Net cashflow
- $168
Break-even live
UW: 25.0% down · 7.5% · 30yr · 1.5% tax · 5.0% vac · 8.0% maint · 8.0% mgmt
Financing live
Cash to close
- Down payment
- $20,625
- Closing costs
- $2,475
- Reserves months
- —
- Total cash needed
- —
Loan-product check · same deal, 3 products live
Conventional
25% down · 7.5% · 30yr
- Down + closing
- —
- Monthly P&I
- —
- Monthly cashflow
- —
- DSCR
- —
- Eligible?
- —
Personal DTI + credit; lowest rate.
DSCR
20% down · 8.5% · 30yr
- Down + closing
- —
- Monthly P&I
- —
- Monthly cashflow
- —
- DSCR
- —
- Eligible?
- —
No personal income docs; deal must DSCR.
Hard money
10% down · 12.0% · 12mo
- Down + closing
- —
- Monthly P&I
- —
- Monthly cashflow
- —
- DSCR
- —
- Eligible?
- —
Short-term bridge; refi at stabilization.
Rent comps 40 comps
| Address | Beds | Baths | Sqft | Rent | $/sqft | DOM | Units | Dist |
|---|---|---|---|---|---|---|---|---|
| 2401 Repsdorph Rd Seabrook, TX | 1.0–2.0 | 1.0–2.0 | 842 | $1,054 | $1.25 | 1d | 22 | 0.10mi |
| 2561 Repsdorph Rd Seabrook, TX | 1.0 | 1.0 | 640 | $1,129 | $1.76 | 44d | 1 | 0.15mi |
| 2555 Repsdorph Rd Unit 2576 Seabrook, TX | 1.0 | 1.0 | 695 | $1,244 | $1.79 | 13d | 1 | 0.22mi |
| 2555 Repsdorph Rd Unit 2570 Seabrook, TX | 1.0 | 1.0 | 695 | $1,249 | $1.80 | 12d | 1 | 0.22mi |
| 2555 Repsdorph Rd Seabrook, TX | 1.0 | 1.0 | 695 | $1,198 | $1.72 | 13d | 1 | 0.23mi |
| 2555 Repsdorph Rd Seabrook, TX | 1.0–3.0 | 1.0–2.0 | 867 | $1,167 | $1.35 | 1d | 26 | 0.23mi |
| 3010 E Nasa Pkwy Unit 1112 Seabrook, TX | 1.0 | 1.0 | 670 | $952 | $1.42 | 3d | 1 | 0.42mi |
| 3010 E Nasa Pkwy Unit 3031 Seabrook, TX | 1.0 | 1.0 | 644 | $980 | $1.52 | 44d | 1 | 0.42mi |
| 3010 E Nasa Pkwy Unit 3031 Seabrook, TX | 1.0 | 1.0 | 670 | $994 | $1.48 | 10d | 1 | 0.42mi |
| 3010 E Nasa Pkwy Unit 1162 Seabrook, TX | 1.0 | 1.0 | 670 | $955 | $1.43 | 5d | 1 | 0.42mi |
| 2601 Repsdorph Rd Unit 1162 Seabrook, TX | 1.0 | 1.0 | 532 | $765 | $1.44 | 7d | 1 | 0.45mi |
| 2601 Repsdorph Rd Unit 2675 Seabrook, TX | 1.0 | 1.0 | 532 | $793 | $1.49 | 13d | 1 | 0.45mi |
| 2601 Repsdorph Rd Unit 2652 Seabrook, TX | 1.0 | 1.0 | 532 | $754 | $1.42 | 13d | 1 | 0.45mi |
| 2601 Repsdorph Rd Unit 2675 Seabrook, TX | 1.0 | 1.0 | 532 | $762 | $1.43 | 3d | 1 | 0.45mi |
| 1901 Lakeside Dr Seabrook, TX | 1.0 | 1.0 | 638 | $864 | $1.35 | 13d | 1 | 0.45mi |
| 3010 E Nasa Pkwy Unit 324 Seabrook, TX | 1.0 | 1.0 | 670 | $955 | $1.43 | 7d | 1 | 0.46mi |
| 3010 E NASA Pkwy Seabrook, TX | 1.0 | 1.0 | 644 | $900 | $1.40 | 15d | 1 | 0.50mi |
| 1901 Lakeside Dr Unit 1922 Seabrook, TX | 1.0 | 1.0 | 638 | $872 | $1.37 | 3d | 1 | 0.51mi |
| 1901 Lakeside Dr Unit 1922 Seabrook, TX | 1.0 | 1.0 | 638 | $910 | $1.43 | 13d | 1 | 0.51mi |
| 1901 Lakeside Dr Unit 324 Seabrook, TX | 1.0 | 1.0 | 638 | $875 | $1.37 | 7d | 1 | 0.51mi |
| 1901 Lakeside Dr Unit 1162 Seabrook, TX | 1.0 | 1.0 | 638 | $875 | $1.37 | 5d | 1 | 0.51mi |
| 1901 Lakeside Dr Unit 1952 Seabrook, TX | 1.0 | 1.0 | 638 | $905 | $1.42 | 44d | 1 | 0.51mi |
| 1907 Lakeside Dr Seabrook, TX | 1.0 | 1.0 | 638 | $1,019 | $1.60 | 44d | 1 | 0.55mi |
| 2800 E Nasa Pkwy Unit 1047 Seabrook, TX | 1.0 | 1.0 | 561 | $925 | $1.65 | 11d | 1 | 0.57mi |
| 2800 E Nasa Pkwy Seabrook, TX | 1.0 | 1.0 | 561 | $874 | $1.56 | 13d | 1 | 0.58mi |
| 2800 E Nasa Pkwy Unit 2874 Seabrook, TX | 1.0 | 1.0 | 561 | $882 | $1.57 | 3d | 1 | 0.65mi |
| 2800 E Nasa Pkwy Unit 2851 Seabrook, TX | 1.0 | 1.0 | 645 | $955 | $1.48 | 44d | 1 | 0.65mi |
| 2800 E Nasa Pkwy Unit 2821 Seabrook, TX | 1.0 | 1.0 | 645 | $960 | $1.49 | 13d | 1 | 0.65mi |
| 2800 E Nasa Pkwy Unit 324 Seabrook, TX | 1.0 | 1.0 | 561 | $885 | $1.58 | 7d | 1 | 0.65mi |
| 2800 E Nasa Pkwy Unit 1162 Seabrook, TX | 1.0 | 1.0 | 561 | $885 | $1.58 | 5d | 1 | 0.65mi |
| 2727 E Nasa Pkwy Unit 2748 Seabrook, TX | 1.0 | 1.0 | 600 | $1,119 | $1.86 | 13d | 1 | 0.74mi |
| 2727 E Nasa Pkwy Unit 2801 Seabrook, TX | 1.0 | 1.0 | 600 | $1,023 | $1.71 | 10d | 1 | 0.74mi |
| 2727 E Nasa Pkwy Unit 1162 Seabrook, TX | 1.0 | 1.0 | 600 | $984 | $1.64 | 5d | 1 | 0.74mi |
| 2727 E Nasa Pkwy Apt 324 Seabrook, TX | 1.0 | 1.0 | 600 | $984 | $1.64 | 7d | 1 | 0.74mi |
| 2727 E Nasa Pkwy Unit 1112 Seabrook, TX | 1.0 | 1.0 | 600 | $981 | $1.64 | 3d | 1 | 0.74mi |
| 2727 E Nasa Pkwy Seabrook, TX | 1.0 | 1.0 | 600 | $973 | $1.62 | 13d | 1 | 0.77mi |
| 4107 E Nasa Pkwy El Lago, TX | 1.0 | 1.0 | 700 | $1,050 | $1.50 | 44d | 1 | 0.86mi |
| 4101 E Nasa Pkwy Unit 4152 El Lago, TX | 1.0 | 1.0 | 700 | $915 | $1.31 | 44d | 1 | 0.88mi |
| 4101 E Nasa Pkwy Unit 4122 El Lago, TX | 1.0 | 1.0 | 700 | $920 | $1.31 | 24d | 1 | 0.88mi |
| 4101 E Nasa Pkwy El Lago, TX | 1.0–3.0 | 1.0–2.0 | 1050 | $950 | $0.90 | 7d | 8 | 0.88mi |
HOA detail condo
- Monthly dues
- $39 · $468/yr
- Assessments
- None detected in remarks — confirm with the listing agent.
Listing history 21 events
-
2026-06-09days on market $82,500 Active 73 DOM
-
2026-06-08days on market $82,500 Active 72 DOM
-
2026-06-07days on market $82,500 Active 71 DOM
-
2026-06-04days on market $82,500 Active 68 DOM
-
2026-06-03days on market $82,500 Active 67 DOM
-
2026-06-02days on market $82,500 Active 66 DOM
-
2026-06-01days on market $82,500 Active 65 DOM
-
2026-05-31days on market $82,500 Active 64 DOM
-
2026-03-29$1,100
-
2026-03-28$82,500 Active 807-char remark
Show marketing remark (807 chars)
This beautifully updated condo is ready to move in and enjoy or be a great income generating property! Recent updates include new vinyl sliding glass doors to the balcony, freshly painted interior, pretty laminate wood flooring throughout, fireplace quartz tile, mantle and wall mount TV, updated lighting and ceiling fans, the kitchen has been updated with gorgeous butcher block wood counter tops, new cabinetry and new appliances, the bath has been updated with new vanity, countertops,backsplash, mirrors, toilet, tub and pretty quarts tile surround,tile flooring, faucets and lighting. The primary bed features a huge walk in closet plus a secondary closet and the kitchen has a laundry area for a stack washer and dryer (not included). This one is turn-key, easy to show and ready for a quick closing!
-
2025-12-04historical $1,100
-
2025-08-28historical
-
2025-08-02$1,100
-
2025-05-20price $90,500
-
2025-04-14price $92,500
-
2025-04-07price $94,500
-
2025-03-27price $94,900
-
2025-03-18price $96,500
-
2025-02-28$99,500 Active
-
1999-12-08soldstatus
-
1999-05-01soldstatus $21,500
ⓘ Source: listings_history table (triggers on properties + properties_extension) + one-shot
backfill from property_details.listing_events for pre-trigger history.
Tax reassessment forecast TX · Resets to sale price
- Current annual tax
- $1,544 · $129/mo
- Projected year-2 tax
- $1,544 · $129/mo
- Expected delta
- $0/yr ($0/mo · 0.0%)
ⓘ Screening estimate from a state-policy table — verify with the county assessor before closing.
Climate risk First Street
- Flood 8/10 Severe FEMA zone X (shaded) · 97% chance over 30 yrs
- Wildfire 1/10 Low
- Heat 10/10 Extreme 7 d/yr ≥108°F today · 25 d/yr by 30 yrs out
- Wind 9/10 Extreme 99% chance of damaging wind over 30 yrs
- Air quality 2/10 Low 1 unhealthy d/yr today · 1 by 30 yrs out
Nearby sold comps map
Loading sold comps map…
Walkable amenities ~0.75 mi
Loading nearby amenities…
Taxation est. · year 1
- Rental income
- $13,206
- − Mortgage interest
- −$4,621
- − Property taxes
- −$1,544
- − Insurance
- −$1,210
- − Repairs & maintenance
- −$1,057
- − Management
- −$1,057
- − HOA
- −$468
- − Depreciation
- −$2,400
- Taxable income
- $851
- Est. tax owed @ 24.0%
- −$204
- After-tax cash flow
- $1,816/yr
For passive investors: Depreciation is non-cash, so a rental often shows a tax loss while cash-flowing — sheltering income. Rental losses are passive: they offset passive income freely, and up to $25,000/yr can offset ordinary (W-2) income if you actively participate and your MAGI is under $100k (phasing out to $0 by $150k); unused losses carry forward. On sale, claimed depreciation is recaptured at up to 25%, and gains may owe capital-gains tax (a 1031 exchange can defer both). Figures are a year-1 estimate at your 24.0% rate — not tax advice; consult a CPA.
Schools (NCES district)
- District
- Clear Creek ISD
- NCES district ID
- 4814280
- Math proficiency
- 48% ▼ -10.00%
- Reading proficiency
- 54% ▼ -4.00%
- Median HH income
- $80,240
- Composite
- 46.49/100
- National rank
- #2431
- State rank
- #114 of 826 in TX
Livability — Seabrook
- Score
- 70/100
- State rank
- #359
- US rank
- #7749
Category grades
Schools grade is shown separately in the Schools card above.
Census & demographics
- Census place
- Seabrook, TX
- County
- Harris County · 4,702,590 people
- City population
- 24,019
- Metro
- Houston-The Woodlands-Sugar Land, TX
- Population (ZIP)
- 23,807
- Household income
- $114,057
- Rent vs Own
- Severe rent burden
- 616.0
Population outlook (Harris County) Hauer SSP2
- Today (2025)
- 5,571,493 people
- By 2030
- 6,089,821 · +9.3%
- By 2040
- 7,142,806 · +28.2%
- By 2050
- 8,185,864 · +46.9%
- By 2075
- 10,574,329 · +89.8%
- By 2100
- 12,109,958 · +117.4%
Race, ethnicity, and origin ACS 2023
- Neighborhood character
- Predominantly White (69%)
- Race & ethnicity
- White 69% Hispanic / Latino 19% Two or more races 10% Asian 5% Black 3%
- Hispanic origin (detail)
- Mexican 15%
- Common ancestry
- Lithuanian 5% Italian 4% Romanian 2%
- Foreign-born
- 10% · Canada, China, Vietnam
- Languages at home
- 83% English-only · Spanish 12% Tagalog/Filipino 1% Other Asian/Pacific 1%
Political lean MEDSL · Harris
- 2024 margin
- Lean D (+5.5) · D 52.0% · R 46.4% · Other 1.6%
- 2008→2024 swing
- +3.9pp toward D · 2008: 1.6pp · 2024: 5.5pp
- All cycles
- 2024: D+5.5 2020: D+13.3 2016: D+12.4 2012: D+0.1 2008: D+1.6
Not yet ingested
- Civics
- —
Market trends
- HPI YoY
- ▼ -130.37%
- Current HPI
- 228.2611
- Rent YoY
- ▲ 4.86%
- Metro
- Houston-The Woodlands-Sugar Land, TX
- State GDP YoY
- ▲ 3.95%
- F500 in state
- 110
Industry mix (Fortune 500 HQ in TX)
| Industry | F500 HQs | Revenue |
|---|---|---|
| Energy | 16 | $1,198B |
|
||
| Technology | 5 | $198B |
|
||
| Engineering / Construction | 4 | $72B |
|
||
| Energy Services | 3 | $60B |
|
||
| Utilities | 3 | $41B |
|
||
| Healthcare | 2 | $330B |
|
||
Price history
-94.9% since first listed13 events — show timeline
- 2026-03-29 Listed for Rent $1,100 HARMLS
- 2026-03-28 Listed $82,500 HARMLS
- 2025-12-04 Rental Removed $1,100 HARMLS
- 2025-08-28 Listing Removed — HARMLS
- 2025-08-02 Listed for Rent $1,100 HARMLS
- 2025-05-20 Price Changed $90,500 HARMLS
- 2025-04-14 Price Changed $92,500 HARMLS
- 2025-04-07 Price Changed $94,500 HARMLS
- 2025-03-27 Price Changed $94,900 HARMLS
- 2025-03-18 Price Changed $96,500 HARMLS
- 2025-02-28 Listed $99,500 HARMLS
- 1999-12-08 Sold (Public Records) — Public Records
- 1999-05-01 Sold (Public Records) $21,500 Public Records
Property tax history
+7.0%/yrLatest (2025): $1,544 · -13.4% YoY. Source: county tax records.
Cash-flow waterfall
monthlySold comps — $/sqft
last 12 mo · ≤1 miLoading sold comps…