2949 Highway 188 · Crystal Springs, AR
Flood risk 1/10 · Minimal
- FEMA flood zone
- —
- Chance of flooding over 30 yrs
- 0.0%
- Est. flood insurance / yr
- —
Fire risk 3/10 · Minor
- Est. fire insurance / yr
- $1,499 – $2,785
Heat risk 6/10 · Moderate
- Hot days now (above 110°F)
- 7 days/yr
- Hot days in 30 yrs
- 20 days/yr
Wind risk 2/10 · Minimal
- Chance of severe wind over 30 yrs
- 4.0%
Air-quality risk 1/10 · Minimal
- Unhealthy air days now
- 0 days/yr
- Unhealthy air days in 30 yrs
- 0 days/yr
Risk factors via First Street. Map © Google.
Why this score? — see what drove the D- grade
The composite is a weighted blend of 9 inputs, each scored 0–100. Each bar is that input's sub-score; the figure is the points it added to the 100-point composite (weight × sub-score).
- Cash flow +10.5/30.0
- ARV discount +7.5/15.0
- Appreciation +4.4/10.0
- Schools +3.3/10.0
- 1% rule +3.1/10.0
- DSCR +3.0/10.0
- Rent growth +2.5/5.0
- Livability +2.5/5.0
- Condition / age +2.2/5.0
$139,900
🖨 Deal sheet 📄 Offer letter ✓ Due diligence
Listing remarks
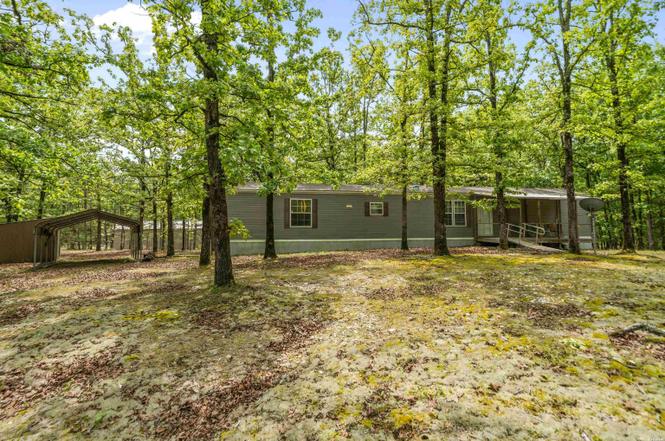
This home sits on just under an acre and a half and is less than one mile to Little Fir boat ramp on beautiful Lake Ouachita! 2015 Mobile home with 3 bedrooms and 2 full baths. This property gives you plenty of room to park your boat and all your toys, perfect location to enjoy Lake Ouachita and have a place to call home. Would be great as a weekender or a full time residence. Home is selling furnished!
Key facts
- 2 garage spots
- Built 2015
- Listed 56 days
Property features AI
Exterior
- Parking: Detached 2-car garage
- Utilities: Private well water; Septic tank sewer
- Home design: Manufactured (modular) home; Single-story
- Construction: Vinyl siding
- Exterior features: Deck; Porch
Interior
- Kitchen: Electric range
- Flooring: Laminate
- Bathrooms: 2 full bathrooms
- Heating & cooling: Electric central heating
- Interior features: Electric range; Laminate flooring
Neighborhood map
What this means for you Summary
Snapshot
- This is a 3-bed/2.0-bath single-family listed at $140k. Condition is rated fair.
Deal economics
- At list price, monthly cash flow is $-71 ($-852/yr) — negative.
- To cash-flow at today's rent, offer at most $130k (7.3% below list).
- To meet the 1% rule (rent ≥ 1% of price), the offer needs to be $113k (18.9% below list).
- Recommended offer: $113k (18.9% below list) — sets the bar for 1% rule.
- Cap rate 5.7% vs local median 1.1% in Crystal Springs — top-decile yield for the area; either an underpriced asset or a hidden risk that comps aren't pricing in. Stress-test before assuming the spread holds.
Location & tenants
- Location reads: area grade D — affects rentability + tenant quality, not the cash-flow math above.
- Mount Ida School District (rural): math 33% / reading 45% proficiency, ranked #79 of 238 in AR (top 33%) — families likely to look elsewhere, expect single-tenant / working-renter base with shorter leases.
- Market conditions: 204 active listings in the ZIP.
Forward outlook
- Local home prices are declining (-1.2%/yr); year-one equity from $967 of loan paydown is wiped out by about $2k of value loss. Plan a longer hold.
- Montgomery County population projected at -37% by 2050 — secular population decline; favor cash flow + early exit over multi-decade hold.
Negotiation context
- It's been on market 56 days — a 3% lower offer ($136k) is reasonable based on typical stale-listing flexibility.
- 3 sale attempts since 2y ago with the ask held roughly flat each time — persistent listings suggest the price (not the market) is what's stuck; bring a comps-based counter.
Risks & watch-outs
- Climate carrying-cost: extreme-heat days projected 7→20/yr by 2055 (HVAC capex compounding) — expect insurance premiums to compound above CPI over the hold.
Questions for the listing agent
- What do current leases actually rent for vs. the listed asking? Can we see a recent rent roll and the last 12 months of T-12 income?
- It's been on market 56 days. Have you received any prior offers? Is the seller open to a 19% concession, seller financing, or rate buy-down credit?
- Have any recent inspections been done? Can we get a copy of the seller's disclosures and any deferred-maintenance estimates?
- Is there a deadline driving the sale (1031 exchange, divorce, estate, relocation)? That informs how much negotiation room exists.
- The area grade is low — what's the realistic commute time and amenity access for the typical tenant pool here? Any planned neighborhood developments (good or bad) we should know about?
- What's the average days-on-market for RENTAL listings here right now (not sales)? A rising rental-DOM trend means longer vacancies and softer asking-rent achievability than the comps imply.
- What's the recent tenant-quality profile in this submarket — average credit score on applications, eviction rate, late-payment / NSF rate, and stable-employment percentage? A property-management company in the area should have these aggregated.
- How much new for-sale + rental construction is in the pipeline within 1–3 miles? Heavy new supply typically softens prices + rents 12–24 months out; constrained supply supports both.
Investment metrics
- 1% rule
- 0.81% ✗
- Cap rate
- 5.68%
- Cash-on-cash
- -2.17%
- DSCR
- 0.90
- GRM
- 10.3
CMA / ARV
No comps found within radius.
Projected returns pro-forma
-1.18% appreciation · 3.0% rent growth · sell at horizon
- IRR
- -9.7%
- Equity multiple
- 0.59×
- Total profit
- $-16,201
- Equity at exit
- $32,531
- IRR
- -2.7%
- Equity multiple
- 0.75×
- Total profit
- $-9,654
- Equity at exit
- $33,115
Cash invested: $39,172 (down + closing). Projections, not guarantees.
Landlord ↔ Tenant lean methodology
- Overall (STATE)
- 92 Strongly Landlord-Friendly
- State Arkansas
- 92 Strongly Landlord-Friendly · R+14
- County
- — inherits STATE
- City
- — inherits STATE
ZIP-level market 71953
- Home prices YoY
- -0.4%
- Active inventory
- 204
- Price-to-rent
- 10.3×
Monthly cashflow live
- Estimated rent
- $1,134 medium interval (Pro) →
- Mortgage (P&I)
- −$734
- Tax est. 1.5%
- −$175 /mo · $2,098/yr
- Insurance
- −$58
- HOA
- −$0
- Vacancy / Maint / Mgmt
- −$238
- Net cashflow
- $-71
Break-even live
UW: 25.0% down · 7.5% · 30yr · 1.5% tax · 5.0% vac · 8.0% maint · 8.0% mgmt
Financing live
Cash to close
- Down payment
- $34,975
- Closing costs
- $4,197
- Reserves months
- —
- Total cash needed
- —
Loan-product check · same deal, 3 products live
Conventional
25% down · 7.5% · 30yr
- Down + closing
- —
- Monthly P&I
- —
- Monthly cashflow
- —
- DSCR
- —
- Eligible?
- —
Personal DTI + credit; lowest rate.
DSCR
20% down · 8.5% · 30yr
- Down + closing
- —
- Monthly P&I
- —
- Monthly cashflow
- —
- DSCR
- —
- Eligible?
- —
No personal income docs; deal must DSCR.
Hard money
10% down · 12.0% · 12mo
- Down + closing
- —
- Monthly P&I
- —
- Monthly cashflow
- —
- DSCR
- —
- Eligible?
- —
Short-term bridge; refi at stabilization.
Listing history 20 events
-
2026-06-16status $139,900 Pending 56 DOM
-
2026-06-15days on market $139,900 Active Under Contract 56 DOM
-
2026-06-14days on market $139,900 Active Under Contract 54 DOM
-
2026-06-12days on market $139,900 Active Under Contract 53 DOM
-
2026-06-09days on market $139,900 Active Under Contract 50 DOM
-
2026-06-08days on market $139,900 Active Under Contract 49 DOM
-
2026-06-07days on market $139,900 Active Under Contract 48 DOM
-
2026-06-07days on market $139,900 Active Under Contract 47 DOM
-
2026-06-04days on market $139,900 Active Under Contract 44 DOM
-
2026-06-02days on market $139,900 Active Under Contract 43 DOM
-
2026-06-01days on market $139,900 Active Under Contract 42 DOM
-
2026-05-31days on market $139,900 Active Under Contract 41 DOM
-
2026-05-31days on market $139,900 Active Under Contract 40 DOM
-
2026-04-23historical Active Under Contract
-
2026-04-20$139,900 Active
-
2025-09-14historical
-
2025-03-13$205,000 New Listing
-
2025-01-06historical
-
2024-08-28price $299,000
-
2024-07-30$447,000 New Listing
ⓘ Source: listings_history table (triggers on properties + properties_extension) + one-shot
backfill from property_details.listing_events for pre-trigger history.
Climate risk First Street
- Flood 1/10 Low 0% chance over 30 yrs
- Wildfire 3/10 Moderate
- Heat 6/10 Major 7 d/yr ≥110°F today · 20 d/yr by 30 yrs out
- Wind 2/10 Low 4% chance of damaging wind over 30 yrs
- Air quality 1/10 Low 0 unhealthy d/yr today · 0 by 30 yrs out
Nearby sold comps map
Loading sold comps map…
Walkable amenities ~0.75 mi
Loading nearby amenities…
Taxation est. · year 1
- Rental income
- $13,608
- − Mortgage interest
- −$7,837
- − Property taxes
- −$2,098
- − Insurance
- −$700
- − Repairs & maintenance
- −$1,089
- − Management
- −$1,089
- − Depreciation
- −$4,070
- Taxable loss
- −$3,274
- Est. tax savings @ 24.0%
- +$786
- After-tax cash flow
- $-66/yr
For passive investors: Depreciation is non-cash, so a rental often shows a tax loss while cash-flowing — sheltering income. Rental losses are passive: they offset passive income freely, and up to $25,000/yr can offset ordinary (W-2) income if you actively participate and your MAGI is under $100k (phasing out to $0 by $150k); unused losses carry forward. On sale, claimed depreciation is recaptured at up to 25%, and gains may owe capital-gains tax (a 1031 exchange can defer both). Figures are a year-1 estimate at your 24.0% rate — not tax advice; consult a CPA.
Condition & rehab AI · 6 photos
This single-family home on a wooded lot needs moderate repairs and updates to improve its condition and value. The property is located near Lake Ouachita, making it a great location for a weekend retreat or full-time residence.
Repairs flagged
- Major Siding — Weathered and peeling
- Major Flooring — Worn-out and in need of replacement
- Moderate Windows — Old window frames
Value-add opportunities
- Both Painting and updating the exterior — Enhances curb appeal and resale value
- Both Replacing the flooring — Improves living space and rental appeal
- Both Updating the windows — Enhances energy efficiency and resale value
Renovation cost estimate screening
| Repair item | Severity | Est. cost |
|---|---|---|
| Siding · Weathered and peeling | Major | $15,000–50,000 |
| Flooring · Worn-out and in need of replacement | Major | $15,000–50,000 |
| Windows · Old window frames | Moderate | $3,000–15,000 |
| Total estimated repair cost · 3 items | $33,000–115,000 |
Value-add ROI direction
- Both Painting and updating the exterior — Enhances curb appeal and resale value ↑
- Both Replacing the flooring — Improves living space and rental appeal ↑
- Both Updating the windows — Enhances energy efficiency and resale value ↑
ⓘ Cost ranges are severity-bucket heuristics (US national rule-of-thumb). Get contractor quotes + a written scope before underwriting a rehab budget.
Schools (NCES district)
- District
- Mount Ida School District
- NCES district ID
- 0509990
- Math proficiency
- 33% ▼ -13.00%
- Reading proficiency
- 45% ▼ -2.00%
- Median HH income
- $38,629
- Composite
- 32.53/100
- National rank
- #5698
- State rank
- #79 of 238 in AR
Livability — Crystal Springs
No livability data for this city. (Only ~50 U.S. cities are tracked.)
Census & demographics
- Population (ZIP)
- 13,412
Population outlook (Montgomery County) Hauer SSP2
- Today (2025)
- 7,889 people
- By 2030
- 7,283 · -7.7%
- By 2040
- 6,086 · -22.9%
- By 2050
- 5,005 · -36.6%
- By 2075
- 3,310 · -58.0%
- By 2100
- 2,271 · -71.2%
Race, ethnicity, and origin ACS 2023
- Neighborhood character
- Predominantly White (91%)
- Race & ethnicity
- White 91% Two or more races 5% Hispanic / Latino 3% Native American 1%
- Common ancestry
- Lithuanian 3% Slovak 2% Iranian 1%
- Foreign-born
- 2% · Canada
- Languages at home
- 98% English-only · Spanish 1% German/W. Germanic 1%
Political lean MEDSL · Montgomery
- 2024 margin
- Solid R (+63.2) · D 17.4% · R 80.6% · Other 2.0%
- 2008→2024 swing
- -28.0pp toward R · 2008: -35.1pp · 2024: -63.2pp
- All cycles
- 2024: R+63.2 2020: R+59.8 2016: R+53.4 2012: R+42.6 2008: R+35.1
Not yet ingested
- Civics
- —
Market trends
- HPI YoY
- ▼ -1.18%
- Current HPI
- 278.2854
- Rent YoY
- —
- Metro
- —
- State GDP YoY
- ▲ 3.80%
- F500 in state
- 10
Industry mix (Fortune 500 HQ in AR)
| Industry | F500 HQs | Revenue |
|---|---|---|
| Retail | 1 | $681B |
|
||
| Food / Agriculture | 1 | $53B |
|
||
| Retail / Energy | 1 | $22B |
|
||
| Transportation / Logistics | 1 | $12B |
|
||
| Energy | 1 | $4B |
|
||
Price history
-68.7% since first listed7 events — show timeline
- 2026-04-23 Contingent — HSBOR
- 2026-04-20 Listed $139,900 HSBOR
- 2025-09-14 Listing Removed — CARMLS
- 2025-03-13 Listed $205,000 CARMLS
- 2025-01-06 Listing Removed — CARMLS
- 2024-08-28 Price Changed $299,000 CARMLS
- 2024-07-30 Listed $447,000 CARMLS
Cash-flow waterfall
monthlySold comps — $/sqft
last 12 mo · ≤1 miLoading sold comps…