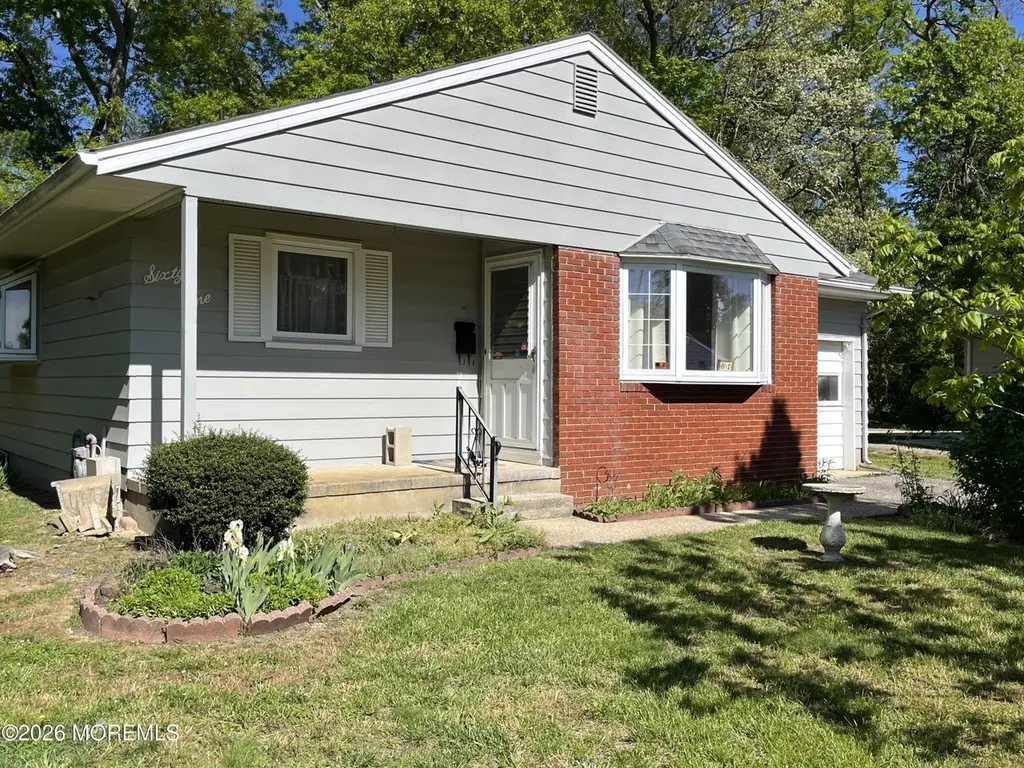
61 Morning Glory Ct · Toms River, NJ
Flood risk 1/10 · Minimal
- FEMA flood zone
- X (unshaded)
- Chance of flooding over 30 yrs
- 0.0%
- Est. flood insurance / yr
- $507 – $1,088
Fire risk 3/10 · Minor
- Est. fire insurance / yr
- $526 – $976
Heat risk 7/10 · Major
- Hot days now (above 100°F)
- 7 days/yr
- Hot days in 30 yrs
- 15 days/yr
Wind risk 6/10 · Moderate
- Chance of severe wind over 30 yrs
- 71.0%
Air-quality risk 3/10 · Minor
- Unhealthy air days now
- 3 days/yr
- Unhealthy air days in 30 yrs
- 4 days/yr
Risk factors via First Street. Map © Google.
Why this score? — see what drove the C grade
The composite is a weighted blend of 9 inputs, each scored 0–100. Each bar is that input's sub-score; the figure is the points it added to the 100-point composite (weight × sub-score).
- Cash flow +21.3/30.0
- ARV discount +12.1/15.0
- DSCR +6.8/10.0
- 1% rule +5.4/10.0
- Livability +4.0/5.0
- Schools +2.9/10.0
- Rent growth +2.5/5.0
- Condition / age +2.5/5.0
- Appreciation +0.0/10.0
$225,000
🖨 Deal sheet (PDF) 📄 Offer letter ✓ Due diligence
Listing remarks MLS
Rare Robin Model with large rooms,recent updates(laminate flooring,remodeled kitchen,bathroom,roof)located in the popular Gardens Of Pleasant Plains. This age 55+ community offers low property taxes and fee.Located only minutes to shopping,medical facilities,places of worship,Garden State Pkwy.,New York express buses and the beautiful Jersey Shore beaches. Only 55 minutes to Atlantic City! Stay home and enjoy the bright Florida room overlooking the large treed lot.This is the perfect location to live the good life at the Jersey Shore.
Key facts
- 6,969 sq ft lot
- Garage
- Built 1970
Property features AI
Finance
- HOA & community: HOA with clubhouse and common areas; Annual association fee of $300 covering trash and common area maintenance; Association: Gardens of Pleasant Plains
Exterior
- Parking: Attached 1-car garage
- Utilities: Public sewer
- Home design: Model: Robin; Fee simple ownership; Living area approximately 896
- Construction: Crawl space basement; Garage (first floor)
- Exterior features: Shingle roof; Level lot; Florida room (first floor)
Interior
- Kitchen: Stove; Microwave; Dishwasher; Refrigerator
- Bedrooms: 1 bedroom (first floor)
- Bathrooms: 1 full bathroom (first floor)
- Heating & cooling: Heating; Multi-unit cooling
- Interior features: Ceiling fans; Light fixtures; Garage door opener; Gas cooking
- Laundry & utility: Washer; Dryer; Laundry room (first floor)
Neighborhood map
What this means for you Summary
Snapshot
- This is a 1-bed/1.0-bath single-family listed at $225k.
Deal economics
- At list price, monthly cash flow is $331 ($4k/yr) — positive.
- The deal already cash-flows at list — no discount required.
- Meets the 1% rule at list price ($2k rent vs $225k).
- Cap rate 8.1% vs local median 3.8% in Toms River — top-decile yield for the area; either an underpriced asset or a hidden risk that comps aren't pricing in. Stress-test before assuming the spread holds.
Location & tenants
- Location reads 81/100 on livability (#61 in NJ, #1,538 nationally) — a professional / high-income tenant draw. Strengths: employment A+, housing A+, health & safety A+; Watch: commute D, cost of living F.
- Toms River Regional School District (suburban): math 18% / reading 44% proficiency, ranked #316 of 472 in NJ (top 67%) — families likely to look elsewhere, expect single-tenant / working-renter base with shorter leases.
- Market conditions: 262 active listings in the ZIP; 5 comparable units currently listed for rent nearby; rentals lingering (median 45d on market — plan ~5-8 weeks vacancy on turnover, expect pricing pressure); 60% of comp listings sitting > 30 days — soft ceiling on asking rent; solid renter incomes; 4,434 units permitted in Ocean County in 2024 (868 in 5+ unit buildings).
- This rent runs 32% of the median local income ($88k/yr) — at the standard rent-burdened threshold; future hikes will face affordability resistance.
Forward outlook
- Local home prices are declining (-3.0%/yr); year-one equity from $2k of loan paydown is wiped out by about $7k of value loss. Plan a longer hold.
- Ocean County population projected to shrink 8% by 2050 — rents likely to lag national; underwrite the cash flow, not the appreciation.
Negotiation context
- Only 6 days on market — expect competitive offers; lowballing is unlikely to land.
- 4 sale attempts since 9y ago; this cycle's ask is 137% above the opening price — seller raised mid-cycle; expect resistance to lowballs.
- Current owner paid $100k; list at $225k implies a 125% gain — meaningful room to come down on a strong offer.
Risks & watch-outs
- Climate carrying-cost: major wind risk, 71% chance of damaging wind over 30y; extreme-heat days projected 7→15/yr by 2055 (HVAC capex compounding) — expect insurance premiums to compound above CPI over the hold.
Questions for the listing agent
- Built in 1970 — when were the roof, HVAC, electrical panel, plumbing, and water heater last replaced?
- What does the HOA fee cover, when was the last increase, and are there any pending special assessments or reserve-fund shortfalls?
- Is there a deadline driving the sale (1031 exchange, divorce, estate, relocation)? That informs how much negotiation room exists.
- What's the average days-on-market for RENTAL listings here right now (not sales)? A rising rental-DOM trend means longer vacancies and softer asking-rent achievability than the comps imply.
- What's the recent tenant-quality profile in this submarket — average credit score on applications, eviction rate, late-payment / NSF rate, and stable-employment percentage? A property-management company in the area should have these aggregated.
- How much new for-sale + rental construction is in the pipeline within 1–3 miles? Heavy new supply typically softens prices + rents 12–24 months out; constrained supply supports both.
Investment metrics
- 1% rule
- 1.04% ✓
- Cap rate
- 8.06%
- Cash-on-cash
- 6.30%
- DSCR
- 1.28
- GRM
- 8.0
CMA / ARV
- ARV (on-the-fly)
- $250,880
- Comps found
- 12
Show comp detail 12 sales within ~0.75 mi
| Address | Dist | Beds/Ba | Sqft | Sold | Price | $/sf | Match |
|---|---|---|---|---|---|---|---|
| 16 Hare Bell Holw | 0.13mi | 2/1.0 (+1) | 916 (+2%) | 3mo | $260,000 | $284 | 83 |
| 153 Fox Glove Run | 0.12mi | 2/1.0 (+1) | 916 (+2%) | 8mo | $270,000 | $295 | 79 |
| 74 Fox Glove | 0.28mi | 2/1.0 (+1) | 916 (+2%) | 2mo | $295,000 | $322 | 77 |
| 61 Golden Glow Circus | 0.33mi | 2/1.0 (+1) | 896 (0%) | 7mo | $300,000 | $335 | 74 |
| 95 Larkspur Ct | 0.47mi | 2/1.0 (+1) | 916 (+2%) | 3mo | $193,500 | $211 | 67 |
| 28 Bellflower Ct | 0.63mi | 2/1.0 (+1) | 896 (0%) | 6mo | $251,000 | $280 | 61 |
| 28 Cheddar Pink Cv | 0.30mi | 2/1.5 (+1) | 966 (+8%) | 8mo | $259,999 | $269 | 60 |
| 44 Gardenia Way | 0.49mi | 2/1.0 (+1) | 966 (+8%) | 3mo | $270,000 | $280 | 57 |
| 33 Gardenia Way | 0.53mi | 2/1.0 (+1) | 960 (+7%) | 4mo | $253,000 | $264 | 55 |
| 23 Wall Cress Ct | 0.37mi | 2/1.0 (+1) | 1,024 (+14%) | 1mo | $279,000 | $272 | 53 |
| 33 Sunflower Ln | 0.56mi | 2/1.0 (+1) | 966 (+8%) | 7mo | $240,000 | $248 | 50 |
| 49 Green Dr | 0.59mi | 2/1.0 (+1) | 1,024 (+14%) | 6mo | $180,000 | $176 | 38 |
Match score weights: distance 35% · size 25% · config 20% · recency 20%. Top-matched comps best support the ARV.
Projected returns pro-forma
-3.0% appreciation · 3.0% rent growth · sell at horizon
- IRR
- -6.6%
- Equity multiple
- 0.76×
- Total profit
- $-15,386
- Equity at exit
- $33,548
- IRR
- 3.0%
- Equity multiple
- 1.22×
- Total profit
- $13,770
- Equity at exit
- $19,454
Cash invested: $63,000 (down + closing). Projections, not guarantees.
Landlord ↔ Tenant lean methodology
- Overall (STATE)
- 21 Tenant-Leaning
- State New Jersey
- 21 Tenant-Leaning · D+6
- County
- — inherits STATE
- City
- — inherits STATE
ZIP-level market 08755
- Active inventory
- 262
- Price-to-rent
- 8.0×
Monthly cashflow live
- Estimated rent
- $2,338 high interval (Pro) →
- Mortgage (P&I)
- −$1,180
- Tax from tax record
- −$218 /mo · $2,612/yr
- Insurance
- −$94
- HOA
- −$25
- Vacancy / Maint / Mgmt
- −$491
- Net cashflow
- $331
Break-even live
Sensitivity live
| Price | -10% $458 | -5% $394 | +0% $331 | +5% $267 | +10% $203 |
|---|---|---|---|---|---|
| Rent | -10% $146 | -5% $238 | +0% $331 | +5% $423 | +10% $515 |
| Rate | -1.0pp $444 | -0.5pp $388 | base $331 | +0.5pp $272 | +1.0pp $213 |
UW: 25.0% down · 7.5% · 30yr · 1.5% tax · 5.0% vac · 8.0% maint · 8.0% mgmt
Financing live
Cash to close
- Down payment
- $56,250
- Closing costs
- $6,750
- Reserves months
- —
- Total cash needed
- —
Loan-product check · same deal, 3 products live
Conventional
25% down · 7.5% · 30yr
- Down + closing
- —
- Monthly P&I
- —
- Monthly cashflow
- —
- DSCR
- —
- Eligible?
- —
Personal DTI + credit; lowest rate.
DSCR
20% down · 8.5% · 30yr
- Down + closing
- —
- Monthly P&I
- —
- Monthly cashflow
- —
- DSCR
- —
- Eligible?
- —
No personal income docs; deal must DSCR.
Hard money
10% down · 12.0% · 12mo
- Down + closing
- —
- Monthly P&I
- —
- Monthly cashflow
- —
- DSCR
- —
- Eligible?
- —
Short-term bridge; refi at stabilization.
Rent comps 5 comps
| Address | Beds | Baths | Sqft | Rent | $/sqft | DOM | Units | Dist |
|---|---|---|---|---|---|---|---|---|
| 1255 NJ-166 Toms River, NJ | 1.0 | 1.0 | 940 | $1,994 | $2.12 | 44d | 1 | 1.32mi |
| 1255 NJ-166 Toms River, NJ | 1.0 | 1.0 | 940 | $2,199 | $2.34 | 25d | 1 | 1.32mi |
| 1255 New Jersey 166 Unit D9 Toms River, NJ | 1.0 | 1.0 | 940 | $2,199 | $2.34 | 44d | 1 | 1.36mi |
| 1255 New Jersey 166 Unit A4 Toms River, NJ | 1.0 | 2.0 | 990 | $2,045 | $2.07 | 44d | 1 | 1.36mi |
| 3600 Cypress Point Dr Toms River, NJ | 1.0–2.0 | 1.0–2.0 | 1170 | $2,408 | $2.06 | 2d | 18 | 1.48mi |
HOA detail
- Monthly dues
- $25 · $300/yr
Listing history 7 events
-
2026-06-18days on market $225,000 Active 6 DOM
-
2026-06-17days on market $225,000 Active 5 DOM
-
2026-06-16days on market $225,000 Active 4 DOM
-
2026-06-15days on market $225,000 Active 3 DOM
-
2026-06-13status $225,000 Active 1 DOM
-
2026-06-09remarks 699-char remark
-
2026-06-09$225,000 Coming Soon 1 DOM
ⓘ Source: listings_history table (triggers on properties + properties_extension) + one-shot
backfill from property_details.listing_events for pre-trigger history.
Tax reassessment forecast NJ · Partial reset (capped growth)
- Current annual tax
- $2,612 · $218/mo
- Projected year-2 tax
- $4,107 · $342/mo
- Expected delta
- +$1,495/yr (+$125/mo · 57.3%)
ⓘ Screening estimate from a state-policy table — verify with the county assessor before closing.
Climate risk First Street
- Flood 1/10 Low FEMA zone X (unshaded) · 0% chance over 30 yrs
- Wildfire 3/10 Moderate
- Heat 7/10 Severe 7 d/yr ≥100°F today · 15 d/yr by 30 yrs out
- Wind 6/10 Major 71% chance of damaging wind over 30 yrs
- Air quality 3/10 Moderate 3 unhealthy d/yr today · 4 by 30 yrs out
Nearby sold comps map
Loading sold comps map…
Walkable amenities ~0.75 mi
Loading nearby amenities…
Taxation est. · year 1
- Rental income
- $28,056
- − Mortgage interest
- −$12,603
- − Property taxes
- −$2,612
- − Insurance
- −$1,125
- − Repairs & maintenance
- −$2,244
- − Management
- −$2,244
- − HOA
- −$300
- − Depreciation
- −$6,545
- Taxable income
- $381
- Est. tax owed @ 24.0%
- −$92
- After-tax cash flow
- $3,877/yr
For passive investors: Depreciation is non-cash, so a rental often shows a tax loss while cash-flowing — sheltering income. Rental losses are passive: they offset passive income freely, and up to $25,000/yr can offset ordinary (W-2) income if you actively participate and your MAGI is under $100k (phasing out to $0 by $150k); unused losses carry forward. On sale, claimed depreciation is recaptured at up to 25%, and gains may owe capital-gains tax (a 1031 exchange can defer both). Figures are a year-1 estimate at your 24.0% rate — not tax advice; consult a CPA.
Schools (NCES district)
- District
- Toms River Regional School District
- NCES district ID
- 3416230
- Math proficiency
- 18% ▼ -19.00%
- Reading proficiency
- 44% ▼ -10.00%
- Median HH income
- $72,370
- Composite
- 29.07/100
- National rank
- #6602
- State rank
- #316 of 472 in NJ
Livability — Toms River
- Score
- 81/100
- State rank
- #61
- US rank
- #1538
Category grades
Schools grade is shown separately in the Schools card above.
Census & demographics
- Census place
- Toms River, NJ
- County
- Ocean County · 439,426 people
- City population
- 131,205
- Metro
- New York-Newark-Jersey City, NY-NJ-PA
- Population (ZIP)
- 29,670
- Household income
- $87,575
- Rent vs Own
- Severe rent burden
- 529.0
Population outlook (Ocean County) Hauer SSP2
- Today (2025)
- 586,991 people
- By 2030
- 581,403 · -1.0%
- By 2040
- 564,913 · -3.8%
- By 2050
- 538,149 · -8.3%
- By 2075
- 468,845 · -20.1%
- By 2100
- 350,297 · -40.3%
Race, ethnicity, and origin ACS 2023
- Neighborhood character
- Predominantly White (73%)
- Race & ethnicity
- White 73% Hispanic / Latino 11% Black 9% Two or more races 8% Asian 4%
- Hispanic origin (detail)
- Puerto Rican 6%
- Common ancestry
- Romanian 5% Italian 2% Scotch-Irish 2%
- Foreign-born
- 10% · Canada, Jamaica, South Korea
- Languages at home
- 84% English-only · Spanish 7% Other Indo-European 2% Tagalog/Filipino 2%
Political lean MEDSL · Ocean
- 2024 margin
- Solid R (+36.0) · D 31.4% · R 67.4% · Other 1.2%
- 2008→2024 swing
- -17.6pp toward R · 2008: -18.4pp · 2024: -36.0pp
- All cycles
- 2024: R+36.0 2020: R+28.7 2016: R+34.0 2012: R+17.7 2008: R+18.4
Not yet ingested
- Civics
- —
Market trends
- HPI YoY
- ▼ -223.51%
- Current HPI
- 303.2721
- Rent YoY
- —
- Metro
- New York-Newark-Jersey City, NY-NJ-PA
- State GDP YoY
- ▲ 2.05%
- F500 in state
- 34
Industry mix (Fortune 500 HQ in NJ)
| Industry | F500 HQs | Revenue |
|---|---|---|
| Consumer Goods | 3 | $31B |
|
||
| Pharmaceuticals | 2 | $153B |
|
||
| Technology | 2 | $21B |
|
||
| Insurance | 2 | $20B |
|
||
| Healthcare | 2 | $19B |
|
||
| Financial Services | 1 | $70B |
|
||
Price history
+462.5% since first listed15 events — show timeline
- 2026-06-09 Coming Soon $225,000 MOMLS
- 2018-07-31 Sold (Public Records) $100,000 Public Records
- 2018-07-27 Sold (MLS) $100,000 MOMLS
- 2018-06-20 Pending — MOMLS
- 2018-06-15 Relisted — MOMLS
- 2018-06-11 Pending — MOMLS
- 2018-06-04 Relisted — MOMLS
- 2018-05-08 Pending — MOMLS
- 2018-04-30 Listed $94,900 MOMLS
- 2017-03-16 Sold (Public Records) $80,000 Public Records
- 2017-03-03 Sold (MLS) $80,000 MOMLS
- 2017-01-31 Pending — MOMLS
- 2017-01-07 Listed $88,000 MOMLS
- 1986-01-15 Sold (Public Records) $56,900 Public Records
- 1982-06-01 Sold (Public Records) $40,000 Public Records
Property tax history
+3.5%/yrLatest (2025): $2,612 · +7.3% YoY. Source: county tax records.
Cash-flow waterfall
monthlySold comps — $/sqft
last 12 mo · ≤1 miLoading sold comps…