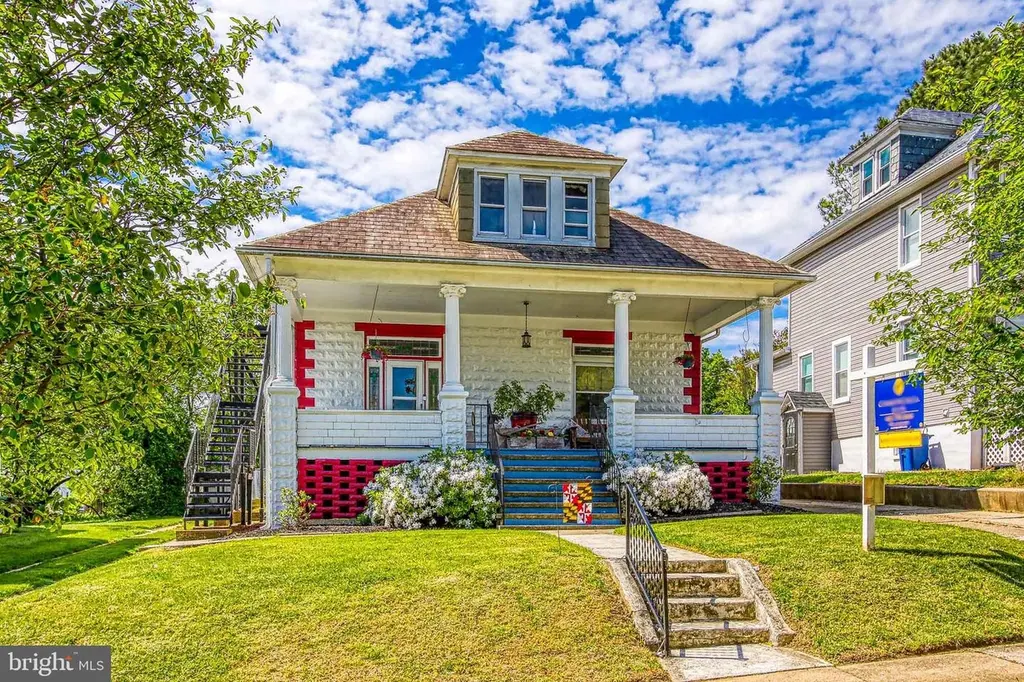
4227 Belmar Ave · Baltimore, MD
Flood risk 1/10 · Minimal
- FEMA flood zone
- X (unshaded)
- Chance of flooding over 30 yrs
- 0.0%
- Est. flood insurance / yr
- $473 – $860
Fire risk 1/10 · Minimal
- Est. fire insurance / yr
- $755 – $1,403
Heat risk 7/10 · Major
- Hot days now (above 103°F)
- 7 days/yr
- Hot days in 30 yrs
- 15 days/yr
Wind risk 6/10 · Moderate
- Chance of severe wind over 30 yrs
- 27.0%
Air-quality risk 4/10 · Minor
- Unhealthy air days now
- 5 days/yr
- Unhealthy air days in 30 yrs
- 7 days/yr
Risk factors via First Street. Map © Google.
Why this score? — see what drove the B- grade
The composite is a weighted blend of 9 inputs, each scored 0–100. Each bar is that input's sub-score; the figure is the points it added to the 100-point composite (weight × sub-score).
- Cash flow +25.2/30.0
- ARV discount +15.0/15.0
- 1% rule +8.8/10.0
- DSCR +8.3/10.0
- Livability +3.8/5.0
- Rent growth +3.6/5.0
- Condition / age +2.5/5.0
- Schools +1.0/10.0
- Appreciation +0.0/10.0
$205,000
🖨 Deal sheet 📄 Offer letter ✓ Due diligence
Listing remarks
HUD is reviewing an offer. HUD Case # 244-276461, IE (Insured Escrow) subject to appraisal and may qualify for FHA financing with a repair escrow. Property is Owned by the US Dept. of HUD and is Equal Housing Opportunity. Seller makes no representations or warranties as to property condition. HUD property is sold in "as is" condition Buyers are responsible for utility activation de-winterize and re-winterize at their own expenses. Buyer responsible for payment of transfer taxes any and all inspections / certifications. HUD will contribute up to 3% for buyer's closing costs, upon bid submission. Visit Hudhomestoregov for more information. Built before 1978, LBP applies. Buyer's age
Key facts
- Near schools
- Near shopping
- Pellet stove
Tags
Property features AI
Exterior
- Parking: Asphalt driveway; Driveway parking
- Utilities: Public water; Public sewer
- Home design: Detached structure; Good property condition; Above-grade finished area per assessor
- Construction: Brick construction; Concrete perimeter foundation; Other structures above and below grade
- Exterior features: Property in city limits; No tidal water
Interior
- Bedrooms: Two bedrooms on the main level; Two bedrooms on the first upper level; One bedroom on the first lower level
- Bathrooms: Three full bathrooms (one on main level, one on first upper level, one on first lower level)
- Heating & cooling: Electric baseboard heating; Cooling: Other; Hot water provided by a 60+ gallon tank
- Interior features: Fully finished basement
Neighborhood map
What this means for you Summary
Snapshot
- This is a 5-bed/3.0-bath single-family listed at $205k.
Deal economics
- At list price, monthly cash flow is $459 ($6k/yr) — positive.
- The deal already cash-flows at list — no discount required.
- Meets the 1% rule at list price ($3k rent vs $205k).
- Cap rate 9.0% vs local median 6.0% in Baltimore — top-decile yield for the area; either an underpriced asset or a hidden risk that comps aren't pricing in. Stress-test before assuming the spread holds.
Location & tenants
- Location reads 76/100 on livability (#90 in MD, #3,396 nationally) — a middle-class / working-renter tenant base. Strengths: amenities A+, commute A+, housing A+; Watch: schools D, crime F.
- Baltimore City Public Schools (urban): math 7% / reading 16% proficiency, ranked #24 of 24 in MD (top 100%) — low school quality limits family demand, transient renter base, plan for 1-2y turnover; 79% free/reduced lunch — lower-income household profile, screen leases tightly.
- Market conditions: Rents rising fast (+4.4%/yr); 173 active listings in the ZIP; 2 comparable units currently listed for rent nearby; 1,273 units permitted in Baltimore city in 2024 (1,104 in 5+ unit buildings).
- At $2,837/mo this rent would consume 53% of the median local household income ($65k/yr) (locally 2317% of renters already pay >50% of income on rent) — very limited rent-growth headroom before tenants either downsize or default.
Forward outlook
- Local home prices are declining (-3.0%/yr); year-one equity from $1k of loan paydown is wiped out by about $6k of value loss. Plan a longer hold.
- Baltimore County population projected to shrink 4% by 2050 — rents likely to lag national; underwrite the cash flow, not the appreciation.
- At projected returns (-3.0% appreciation + 4.4% rent growth), your $57k cash investment doubles in ~9 years — after that, you're playing with house money.
Negotiation context
- Only 10 days on market — expect competitive offers; lowballing is unlikely to land.
- 9 sale attempts since 22y ago with the ask held roughly flat each time — persistent listings suggest the price (not the market) is what's stuck; bring a comps-based counter.
Risks & watch-outs
- Watch-outs: property tax is 3.6% of price; built in 1920 — expect roof / HVAC / electrical / plumbing capex.
- Climate carrying-cost: major wind risk, 27% chance of damaging wind over 30y; extreme-heat days projected 7→15/yr by 2055 (HVAC capex compounding) — expect insurance premiums to compound above CPI over the hold.
Questions for the listing agent
- Built in 1920 — when were the roof, HVAC, electrical panel, plumbing, and water heater last replaced?
- Property tax is high relative to price — has the assessment been appealed recently, and will the sale trigger a re-assessment?
- Is there a deadline driving the sale (1031 exchange, divorce, estate, relocation)? That informs how much negotiation room exists.
- Schools are D-rated, which usually means shorter tenancies and higher turnover. Who's the typical renter profile here, and what's been the actual vacancy rate?
- Crime grade is F in this area — have there been break-ins, vandalism, or insurance claims at this property in the last 3 years? What carrier currently insures it and at what premium?
- What's the average days-on-market for RENTAL listings here right now (not sales)? A rising rental-DOM trend means longer vacancies and softer asking-rent achievability than the comps imply.
- What's the recent tenant-quality profile in this submarket — average credit score on applications, eviction rate, late-payment / NSF rate, and stable-employment percentage? A property-management company in the area should have these aggregated.
- How much new for-sale + rental construction is in the pipeline within 1–3 miles? Heavy new supply typically softens prices + rents 12–24 months out; constrained supply supports both.
Investment metrics
- 1% rule
- 1.38% ✓
- Cap rate
- 8.98%
- Cash-on-cash
- 9.60%
- DSCR
- 1.43
- GRM
- 6.0
CMA / ARV
- ARV (median comp)
- $366,357
- List price
- $205,000
- Delta
- -44.04%
- Verdict
- UNDERPRICED
- Comps
- 20 within 1.0 mi
Show comp detail 8 sales within ~0.75 mi
| Address | Dist | Beds/Ba | Sqft | Sold | Price | $/sf | Match |
|---|---|---|---|---|---|---|---|
| 4012 Chesley Ave | 0.51mi | 5/3.0 | 3,065 (+4%) | 3mo | $448,000 | $146 | 67 |
| 6226 Everall Ave | 0.40mi | 6/3.0 (+1) | 2,792 (-5%) | 16mo | $375,000 | $134 | 54 |
| 4401 Raspe Ave | 0.24mi | 5/1.5 | 2,570 (-13%) | 14mo | $350,000 | $136 | 50 |
| 3907 Fleetwood Ave | 0.38mi | 4/4.0 (-1) | 2,596 (-12%) | 7mo | $345,000 | $133 | 47 |
| 5938 Kavon Ave | 0.56mi | 4/3.5 (-1) | 3,010 (+2%) | 20mo | $319,900 | $106 | 47 |
| 6206 Everall Ave | 0.43mi | 4/3.0 (-1) | 2,593 (-12%) | 15mo | $357,000 | $138 | 42 |
| 6304 Elinore Ave | 0.64mi | 6/3.0 (+1) | 2,655 (-10%) | 11mo | $399,000 | $150 | 39 |
| 6812 Everall Ave | 0.70mi | 4/3.5 (-1) | 2,600 (-12%) | 18mo | $450,000 | $173 | 26 |
Match score weights: distance 35% · size 25% · config 20% · recency 20%. Top-matched comps best support the ARV.
Projected returns pro-forma
-3.0% appreciation · 4.43% rent growth · sell at horizon
- IRR
- 0.2%
- Equity multiple
- 1.01×
- Total profit
- $434
- Equity at exit
- $30,566
- IRR
- 11.6%
- Equity multiple
- 1.99×
- Total profit
- $56,613
- Equity at exit
- $17,725
Cash invested: $57,400 (down + closing). Projections, not guarantees.
Landlord ↔ Tenant lean methodology
- Overall (CITY)
- 12 Strongly Tenant-Friendly
- State Maryland
- 27 Tenant-Leaning · D+14
- County
- — inherits STATE
- City Baltimore
- 12 Strongly Tenant-Friendly · D+58
ZIP-level market 21206
- Rents YoY
- 4.4%
- Active inventory
- 173
- Price-to-rent
- 6.0×
Monthly cashflow live
- Estimated rent
- $2,837 medium interval (Pro) →
- Mortgage (P&I)
- −$1,075
- Tax from tax record
- −$622 /mo · $7,460/yr
- Insurance
- −$85
- HOA
- −$0
- Vacancy / Maint / Mgmt
- −$596
- Net cashflow
- $459
Break-even live
UW: 25.0% down · 7.5% · 30yr · 1.5% tax · 5.0% vac · 8.0% maint · 8.0% mgmt
Financing live
Cash to close
- Down payment
- $51,250
- Closing costs
- $6,150
- Reserves months
- —
- Total cash needed
- —
Loan-product check · same deal, 3 products live
Conventional
25% down · 7.5% · 30yr
- Down + closing
- —
- Monthly P&I
- —
- Monthly cashflow
- —
- DSCR
- —
- Eligible?
- —
Personal DTI + credit; lowest rate.
DSCR
20% down · 8.5% · 30yr
- Down + closing
- —
- Monthly P&I
- —
- Monthly cashflow
- —
- DSCR
- —
- Eligible?
- —
No personal income docs; deal must DSCR.
Hard money
10% down · 12.0% · 12mo
- Down + closing
- —
- Monthly P&I
- —
- Monthly cashflow
- —
- DSCR
- —
- Eligible?
- —
Short-term bridge; refi at stabilization.
Rent comps 2 comps
| Address | Beds | Baths | Sqft | Rent | $/sqft | DOM | Units | Dist |
|---|---|---|---|---|---|---|---|---|
| 6504 Rosemont Ave Baltimore, MD | 5.0 | 3.0 | 2098 | $2,900 | $1.38 | 44d | 1 | 0.29mi |
| 3021 Glenmore Ave Baltimore, MD | 5.0 | 2.0 | 2692 | $1,950 | $0.72 | 4d | 1 | 1.40mi |
Listing history 32 events
-
2026-06-10statusdays on market $205,000 Pending 10 DOM
-
2026-05-15historical
-
2026-05-05$205,000 Active
-
2024-12-31historical
-
2024-11-20status Active
-
2024-11-20historical
-
2024-11-05price $335,000
-
2024-07-01status Active
-
2024-06-30historical
-
2024-05-22price $350,000
-
2024-05-22status Active
-
2024-02-16historical Active Under Contract
-
2024-01-08status Active
-
2023-12-31historical
-
2023-11-20price $335,000
-
2023-10-22price $345,000
-
2023-10-05status Active
-
2023-09-29status Pending
-
2023-09-14price $350,000
-
2023-08-15price $360,000
-
2023-07-18$370,000 Active
-
2023-05-22historical
-
2023-05-22historical
-
2021-11-03soldstatus $314,500
-
2021-07-18soldstatus $314,500 Closed
-
2021-06-03status Pending
-
2021-05-26$305,000 Active
-
2004-11-04soldstatus $154,900
-
2004-11-03soldstatus $154,900
-
2004-09-03historical
-
2004-08-13$164,900
-
1982-11-29soldstatus $75,000
ⓘ Source: listings_history table (triggers on properties + properties_extension) + one-shot
backfill from property_details.listing_events for pre-trigger history.
Tax reassessment forecast MD · Partial reset (capped growth)
- Current annual tax
- $7,460 · $622/mo
- Projected year-2 tax
- $7,460 · $622/mo
- Expected delta
- $0/yr ($0/mo · 0.0%)
ⓘ Screening estimate from a state-policy table — verify with the county assessor before closing.
Climate risk First Street
- Flood 1/10 Low FEMA zone X (unshaded) · 0% chance over 30 yrs
- Wildfire 1/10 Low
- Heat 7/10 Severe 7 d/yr ≥103°F today · 15 d/yr by 30 yrs out
- Wind 6/10 Major 27% chance of damaging wind over 30 yrs
- Air quality 4/10 Moderate 5 unhealthy d/yr today · 7 by 30 yrs out
Nearby sold comps map
Loading sold comps map…
Walkable amenities ~0.75 mi
Loading nearby amenities…
Taxation est. · year 1
- Rental income
- $34,045
- − Mortgage interest
- −$11,483
- − Property taxes
- −$7,460
- − Insurance
- −$1,025
- − Repairs & maintenance
- −$2,724
- − Management
- −$2,724
- − Depreciation
- −$5,964
- Taxable income
- $2,666
- Est. tax owed @ 24.0%
- −$640
- After-tax cash flow
- $4,870/yr
For passive investors: Depreciation is non-cash, so a rental often shows a tax loss while cash-flowing — sheltering income. Rental losses are passive: they offset passive income freely, and up to $25,000/yr can offset ordinary (W-2) income if you actively participate and your MAGI is under $100k (phasing out to $0 by $150k); unused losses carry forward. On sale, claimed depreciation is recaptured at up to 25%, and gains may owe capital-gains tax (a 1031 exchange can defer both). Figures are a year-1 estimate at your 24.0% rate — not tax advice; consult a CPA.
Schools (NCES district)
- District
- Baltimore City Public Schools
- NCES district ID
- 2400090
- Math proficiency
- 7% ▼ -9.00%
- Reading proficiency
- 16% ▼ -5.00%
- Median HH income
- $42,108
- Composite
- 10.08/100
- National rank
- #9805
- State rank
- #24 of 24 in MD
Livability — Baltimore
- Score
- 76/100
- State rank
- #90
- US rank
- #3396
Category grades
Schools grade is shown separately in the Schools card above.
Census & demographics
- Census place
- Baltimore, MD
- County
- Baltimore City · 558,601 people
- City population
- 588,727
- Metro
- Baltimore-Columbia-Towson, MD
- Population (ZIP)
- 48,902
- Household income
- $64,531
- Rent vs Own
- Severe rent burden
- 2317.0
Population outlook (Baltimore County) Hauer SSP2
- Today (2025)
- 624,249 people
- By 2030
- 621,541 · -0.4%
- By 2040
- 609,756 · -2.3%
- By 2050
- 597,249 · -4.3%
- By 2075
- 552,236 · -11.5%
- By 2100
- 513,934 · -17.7%
Race, ethnicity, and origin ACS 2023
- Neighborhood character
- Predominantly Black (73%)
- Race & ethnicity
- Black 73% White 20% Two or more races 3% Hispanic / Latino 3% Asian 2%
- Common ancestry
- Romanian 3% Ukrainian 1%
- Foreign-born
- 8% · Canada
- Languages at home
- 92% English-only · Spanish 2% Arabic 2% Other Indo-European 1%
Political lean MEDSL · Baltimore
- 2024 margin
- Solid D (+73.0) · D 85.2% · R 12.2% · Other 2.6%
- 2008→2024 swing
- -2.5pp toward R · 2008: 75.5pp · 2024: 73.0pp
- All cycles
- 2024: D+73.0 2020: D+76.6 2016: D+74.6 2012: D+76.4 2008: D+75.5
Not yet ingested
- Civics
- —
Market trends
- HPI YoY
- ▼ -191.83%
- Current HPI
- 284.5645
- Rent YoY
- ▲ 4.43%
- Metro
- Baltimore-Columbia-Towson, MD
- State GDP YoY
- ▲ 2.97%
- F500 in state
- 12
Industry mix (Fortune 500 HQ in MD)
| Industry | F500 HQs | Revenue |
|---|---|---|
| Aerospace / Defense | 1 | $71B |
|
||
| Utilities | 1 | $25B |
|
||
| Hotels | 1 | $24B |
|
||
| Consumer Goods | 1 | $7B |
|
||
| Real Estate | 1 | $6B |
|
||
| Chemicals | 1 | $2B |
|
||
Price history
+173.3% since first listed32 events — show timeline
- 2026-06-09 Pending — BRIGHT MLS
- 2026-05-15 Listing Removed — BRIGHT MLS
- 2026-05-05 Listed $205,000 BRIGHT MLS
- 2024-12-31 Listing Removed — BRIGHT MLS
- 2024-11-20 Relisted — BRIGHT MLS
- 2024-11-20 Listing Removed — BRIGHT MLS
- 2024-11-05 Price Changed $335,000 BRIGHT MLS
- 2024-07-01 Relisted — BRIGHT MLS
- 2024-06-30 Listing Removed — BRIGHT MLS
- 2024-05-22 Price Changed $350,000 BRIGHT MLS
- 2024-05-22 Relisted — BRIGHT MLS
- 2024-02-16 Contingent — BRIGHT MLS
- 2024-01-08 Relisted — BRIGHT MLS
- 2023-12-31 Listing Removed — BRIGHT MLS
- 2023-11-20 Price Changed $335,000 BRIGHT MLS
- 2023-10-22 Price Changed $345,000 BRIGHT MLS
- 2023-10-05 Relisted — BRIGHT MLS
- 2023-09-29 Pending — BRIGHT MLS
- 2023-09-14 Price Changed $350,000 BRIGHT MLS
- 2023-08-15 Price Changed $360,000 BRIGHT MLS
- 2023-07-18 Listed $370,000 BRIGHT MLS
- 2023-05-22 Coming Soon — BRIGHT MLS
- 2023-05-22 Listing Removed — BRIGHT MLS
- 2021-11-03 Sold (Public Records) $314,500 Public Records
- 2021-07-18 Sold (MLS) $314,500 BRIGHT MLS
- 2021-06-03 Pending — BRIGHT MLS
- 2021-05-26 Listed $305,000 BRIGHT MLS
- 2004-11-04 Sold (Public Records) $154,900 Public Records
- 2004-11-03 Sold (MLS) $154,900 MRIS
- 2004-09-03 Delisted — MRIS
- 2004-08-13 Listed $164,900 MRIS
- 1982-11-29 Sold (Public Records) $75,000 Public Records
Property tax history
+3.9%/yrLatest (2025): $7,460 · +1.1% YoY. Source: county tax records.
Cash-flow waterfall
monthlySold comps — $/sqft
last 12 mo · ≤1 miLoading sold comps…