217 E 38th St · Savannah, GA
Flood risk 1/10 · Minimal
- FEMA flood zone
- X (unshaded)
- Chance of flooding over 30 yrs
- 0.0%
- Est. flood insurance / yr
- $507 – $1,088
Fire risk 1/10 · Minimal
- Est. fire insurance / yr
- $963 – $1,789
Heat risk 10/10 · Severe
- Hot days now (above 107°F)
- 7 days/yr
- Hot days in 30 yrs
- 18 days/yr
Wind risk 9/10 · Severe
- Chance of severe wind over 30 yrs
- 99.0%
Air-quality risk 5/10 · Moderate
- Unhealthy air days now
- 7 days/yr
- Unhealthy air days in 30 yrs
- 8 days/yr
Risk factors via First Street. Map © Google.
Why this score? — see what drove the D grade
The composite is a weighted blend of 9 inputs, each scored 0–100. Each bar is that input's sub-score; the figure is the points it added to the 100-point composite (weight × sub-score).
- ARV discount +15.0/15.0
- Cash flow +11.2/30.0
- Livability +4.3/5.0
- DSCR +3.3/10.0
- Rent growth +3.2/5.0
- Condition / age +2.5/5.0
- 1% rule +2.0/10.0
- Schools +2.0/10.0
- Appreciation +0.0/10.0
$400,000
🖨 Deal sheet (PDF) 📄 Offer letter ✓ Due diligence
Listing remarks MLS
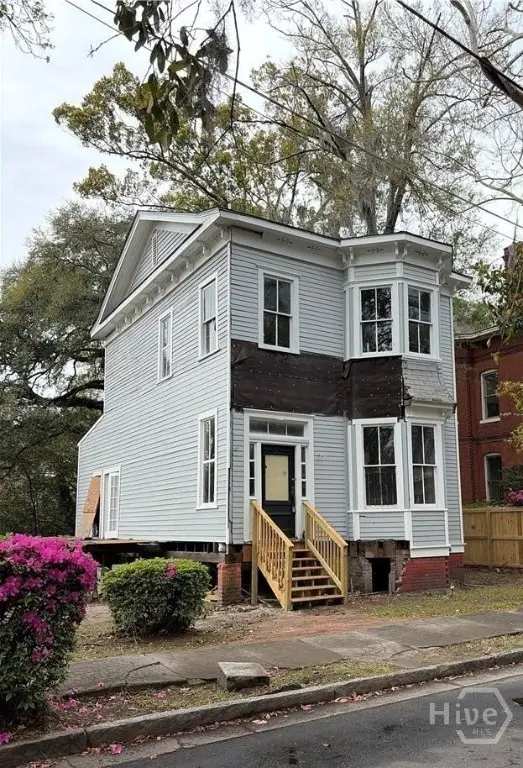
217 E 38th St is a completely gutted, two-story single-family home in Savannah's historic Griffin Ward neighborhood. Stripped to the studs and sold AS-IS, this is a true gut-renovation opportunity. The 1920-built wood-frame structure sits on a 0.11-acre lot zoned TN-2 in the Streetcar Historic District. Prior permitted renovation work totaling $145,000+ has been completed on the structure. No utilities are currently operational. Cash or construction loan only. Flood Zone X — no flood insurance required. Buyer to verify all information including square footage, room count, and condition. Located minutes from Downtown Savannah, Daffin Park, SCAD, and the Thomas Square arts corridor — a rare chance to put your vision to work in one of the city's most sought-after historic neighborhoods. Contact listing agent to schedule a showing.
Key facts
- Daffin park
- Scad
- Zoned tn-2
Tags
Neighborhood map
What this means for you Summary
Snapshot
- This is a 4-bed/2.0-bath single-family listed at $400k.
Deal economics
- At list price, monthly cash flow is $-152 ($-2k/yr) — negative.
- To cash-flow at today's rent, offer at most $373k (6.7% below list).
- To meet the 1% rule (rent ≥ 1% of price), the offer needs to be $279k (30.3% below list).
- Recommended offer: $279k (30.3% below list) — sets the bar for 1% rule.
- Cap rate 5.8% vs local median 4.0% in Savannah — top-decile yield for the area; either an underpriced asset or a hidden risk that comps aren't pricing in. Stress-test before assuming the spread holds.
Location & tenants
- Location reads 86/100 on livability (#1 in GA, #397 nationally) — a professional / high-income tenant draw. Strengths: crime A+, amenities A+, commute A+; Watch: employment D, schools F.
- Savannah-Chatham County (urban): math 20% / reading 26% proficiency, ranked #134 of 174 in GA (top 77%) — low school quality limits family demand, transient renter base, plan for 1-2y turnover.
- Market conditions: Rents rising (+3.0%/yr); 332 active listings in the ZIP; 40 comparable units currently listed for rent nearby; rentals lingering (median 46d on market — plan ~5-8 weeks vacancy on turnover, expect pricing pressure); 62% of comp listings sitting > 30 days — soft ceiling on asking rent; 2,694 units permitted in Chatham County in 2024 (973 in 5+ unit buildings).
- At $2,789/mo this rent would consume 64% of the median local household income ($53k/yr) (locally 2031% of renters already pay >50% of income on rent) — very limited rent-growth headroom before tenants either downsize or default.
Forward outlook
- Local home prices are declining (-3.0%/yr); year-one equity from $3k of loan paydown is wiped out by about $12k of value loss. Plan a longer hold.
- Chatham County population projected at +33% by 2050 — long-run rental-demand tailwind backs the buy-and-hold thesis.
Negotiation context
- It's been on market 73 days — a 6% lower offer ($376k) is reasonable based on typical stale-listing flexibility.
- 3 sale attempts since 18y ago with the ask held roughly flat each time — persistent listings suggest the price (not the market) is what's stuck; bring a comps-based counter.
- Current owner paid $210k; list at $400k implies a 90% gain — meaningful room to come down on a strong offer.
Risks & watch-outs
- Watch-outs: built in 1920 — expect roof / HVAC / electrical / plumbing capex.
- Climate carrying-cost: severe wind risk, 99% chance of damaging wind over 30y; extreme-heat days projected 7→18/yr by 2055 (HVAC capex compounding) — expect insurance premiums to compound above CPI over the hold.
Questions for the listing agent
- What do current leases actually rent for vs. the listed asking? Can we see a recent rent roll and the last 12 months of T-12 income?
- It's been on market 73 days. Have you received any prior offers? Is the seller open to a 30% concession, seller financing, or rate buy-down credit?
- Built in 1920 — when were the roof, HVAC, electrical panel, plumbing, and water heater last replaced?
- Why hasn't it sold? Are there any deal-killer items the seller is aware of (foundation, flood, title, zoning, code violations)?
- Is there a deadline driving the sale (1031 exchange, divorce, estate, relocation)? That informs how much negotiation room exists.
- Schools are F-rated, which usually means shorter tenancies and higher turnover. Who's the typical renter profile here, and what's been the actual vacancy rate?
- The area grade is low — what's the realistic commute time and amenity access for the typical tenant pool here? Any planned neighborhood developments (good or bad) we should know about?
- What's the average days-on-market for RENTAL listings here right now (not sales)? A rising rental-DOM trend means longer vacancies and softer asking-rent achievability than the comps imply.
- What's the recent tenant-quality profile in this submarket — average credit score on applications, eviction rate, late-payment / NSF rate, and stable-employment percentage? A property-management company in the area should have these aggregated.
- How much new for-sale + rental construction is in the pipeline within 1–3 miles? Heavy new supply typically softens prices + rents 12–24 months out; constrained supply supports both.
Investment metrics
- 1% rule
- 0.70% ✗
- Cap rate
- 5.84%
- Cash-on-cash
- -1.63%
- DSCR
- 0.93
- GRM
- 12.0
CMA / ARV
- ARV (median comp)
- $512,463
- List price
- $400,000
- Delta
- -21.95%
- Verdict
- UNDERPRICED
- Comps
- 20 within 1.0 mi
Show comp detail 12 sales within ~0.75 mi
| Address | Dist | Beds/Ba | Sqft | Sold | Price | $/sf | Match |
|---|---|---|---|---|---|---|---|
| 115 W 34th St | 0.39mi | 3/3.0 (-1) | 1,600 (-2%) | 1mo | $497,000 | $311 | 70 |
| 708 E 39th St | 0.47mi | 4/2.0 | 1,720 (+6%) | 4mo | $170,000 | $99 | 65 |
| 816 E 37th St | 0.62mi | 3/2.0 (-1) | 1,628 (+0%) | 1mo | $387,000 | $238 | 65 |
| 917 E 39th St | 0.72mi | 3/2.5 (-1) | 1,612 (-1%) | 1mo | $490,000 | $304 | 57 |
| 653 Seiler Ave | 0.42mi | 4/3.0 | 1,800 (+11%) | 3mo | $540,000 | $300 | 56 |
| 310 E Henry St | 0.54mi | 3/2.0 (-1) | 1,739 (+7%) | 3mo | $537,000 | $309 | 55 |
| 614 W 38th St | 0.65mi | 4/2.5 | 1,777 (+9%) | 2mo | $298,000 | $168 | 51 |
| 2011 Atlantic Ave | 0.44mi | 3/2.0 (-1) | 1,392 (-14%) | 4mo | $340,000 | $244 | 47 |
| 806 Maupas Ave | 0.61mi | 3/2.5 (-1) | 1,810 (+12%) | 2mo | $564,000 | $312 | 44 |
| 622 W 36th St | 0.68mi | 3/1.0 (-1) | 1,468 (-10%) | 2mo | $165,000 | $112 | 42 |
| 1117 Habersham St | 0.60mi | 3/2.5 (-1) | 1,820 (+12%) | 4mo | $690,000 | $379 | 42 |
| 922 E 37th St | 0.74mi | 3/3.0 (-1) | 1,832 (+13%) | 3mo | $245,000 | $134 | 33 |
Match score weights: distance 35% · size 25% · config 20% · recency 20%. Top-matched comps best support the ARV.
Projected returns pro-forma
-3.0% appreciation · 2.95% rent growth · sell at horizon
- IRR
- -19.1%
- Equity multiple
- 0.33×
- Total profit
- $-74,845
- Equity at exit
- $59,641
- IRR
- -11.9%
- Equity multiple
- 0.29×
- Total profit
- $-79,061
- Equity at exit
- $34,585
Cash invested: $112,000 (down + closing). Projections, not guarantees.
Landlord ↔ Tenant lean methodology
- Overall (STATE)
- 90 Strongly Landlord-Friendly
- State Georgia
- 90 Strongly Landlord-Friendly · R+3
- County
- — inherits STATE
- City
- — inherits STATE
ZIP-level market 31401
- Rents YoY
- 3.0%
- Active inventory
- 332
- Price-to-rent
- 12.0×
Monthly cashflow live
- Estimated rent
- $2,789 high interval (Pro) →
- Mortgage (P&I)
- −$2,098
- Tax from tax record
- −$91 /mo · $1,093/yr
- Insurance
- −$167
- HOA
- −$0
- Lot rent
- −$0
- Vacancy / Maint / Mgmt
- −$586
- Net cashflow
- $-152
Break-even live
Sensitivity live
| Price | -10% $74 | -5% $-39 | +0% $-152 | +5% $-265 | +10% $-378 |
|---|---|---|---|---|---|
| Rent | -10% $-372 | -5% $-262 | +0% $-152 | +5% $-42 | +10% $68 |
| Rate | -1.0pp $49 | -0.5pp $-50 | base $-152 | +0.5pp $-256 | +1.0pp $-361 |
UW: 25.0% down · 7.5% · 30yr · 1.5% tax · 5.0% vac · 8.0% maint · 8.0% mgmt
Financing live
Cash to close
- Down payment
- $100,000
- Closing costs
- $12,000
- Reserves months
- —
- Total cash needed
- —
Loan-product check · same deal, 3 products live
Conventional
25% down · 7.5% · 30yr
- Down + closing
- —
- Monthly P&I
- —
- Monthly cashflow
- —
- DSCR
- —
- Eligible?
- —
Personal DTI + credit; lowest rate.
DSCR
20% down · 8.5% · 30yr
- Down + closing
- —
- Monthly P&I
- —
- Monthly cashflow
- —
- DSCR
- —
- Eligible?
- —
No personal income docs; deal must DSCR.
Hard money
10% down · 12.0% · 12mo
- Down + closing
- —
- Monthly P&I
- —
- Monthly cashflow
- —
- DSCR
- —
- Eligible?
- —
Short-term bridge; refi at stabilization.
Rent comps 40 comps
| Address | Beds | Baths | Sqft | Rent | $/sqft | DOM | Units | Dist |
|---|---|---|---|---|---|---|---|---|
| 201 E 39th St Unit B Savannah, GA | 3.0 | 1.5 | 1550 | $2,100 | $1.35 | 46d | 1 | 0.08mi |
| 123 E 40th St Savannah, GA | 3.0 | 1.0 | 1389 | $1,900 | $1.37 | 46d | 1 | 0.14mi |
| 2002 Habersham St Savannah, GA | 3.0 | 2.0 | 1242 | $1,995 | $1.61 | 46d | 1 | 0.18mi |
| 607 E 37th St Savannah, GA | 4.0 | 2.0 | 1771 | $2,300 | $1.30 | 46d | 1 | 0.27mi |
| 3 W 36th St Apt 2 Savannah, GA | 4.0 | 1.0 | 1750 | $4,200 | $2.40 | 46d | 1 | 0.28mi |
| 2235 Whitaker St Savannah, GA | 3.0 | 2.0 | 1600 | $2,950 | $1.84 | 16d | 1 | 0.30mi |
| 2305 Whitaker St Unit A Savannah, GA | 3.0 | 3.0 | 1600 | $3,300 | $2.06 | 16d | 1 | 0.31mi |
| 107 W 37th St Savannah, GA | 4.0 | 2.0 | 1300 | $3,200 | $2.46 | 46d | 1 | 0.32mi |
| 102 W 36th St Savannah, GA | 3.0 | 2.0 | 1500 | $4,500 | $3.00 | 25d | 1 | 0.34mi |
| 1921 Reynolds St Savannah, GA | 4.0 | 2.0 | 1773 | $3,150 | $1.78 | 46d | 1 | 0.34mi |
| 513 E 33rd St Savannah, GA | 4.0 | 3.0 | 1800 | $3,399 | $1.89 | 16d | 1 | 0.34mi |
| 637 E 39th St Savannah, GA | 4.0 | 3.0 | 2162 | $2,895 | $1.34 | 25d | 1 | 0.35mi |
| 602 E 34th St Savannah, GA | 3.0 | 2.0 | 1185 | $2,095 | $1.77 | 46d | 1 | 0.36mi |
| 206 W 39th St Savannah, GA | 3.0 | 2.5 | 1966 | $2,650 | $1.35 | 25d | 1 | 0.38mi |
| 424 E 32nd St Unit 426 Savannah, GA | 3.0 | 1.5 | 1350 | $2,380 | $1.76 | 46d | 1 | 0.39mi |
| 212 W 40th St Savannah, GA | 3.0 | 2.0 | 2030 | $3,600 | $1.77 | 25d | 1 | 0.39mi |
| 211 W 40th St Unit B Savannah, GA | 3.0 | 1.0 | 1400 | $3,200 | $2.29 | 25d | 1 | 0.40mi |
| 317 E 31st St Unit A Savannah, GA | 3.0 | 2.0 | 1196 | $2,000 | $1.67 | 46d | 1 | 0.41mi |
| 1723 Whitaker St Savannah, GA | 3.0 | 1.5 | 1845 | $1,800 | $0.98 | 46d | 1 | 0.41mi |
| 217 W 36th St Savannah, GA | 3.0 | 2.0 | 1950 | $3,200 | $1.64 | 46d | 1 | 0.43mi |
| 219 W 36th St Savannah, GA | 3.0 | 2.0 | 1950 | $3,200 | $1.64 | 46d | 1 | 0.43mi |
| 2910 Bull St Savannah, GA | 3.0 | 2.0 | 1200 | $3,500 | $2.92 | 46d | 1 | 0.45mi |
| 216 W 43rd St Savannah, GA | 3.0 | 3.0 | 1722 | $2,900 | $1.68 | 25d | 1 | 0.45mi |
| 1714 Le Grand St Unit B Savannah, GA | 3.0 | 2.0 | 1300 | $2,700 | $2.08 | 46d | 1 | 0.46mi |
| 1606 Reynolds St Savannah, GA | 3.0 | 2.0 | 1222 | $1,800 | $1.47 | 46d | 1 | 0.46mi |
| 310 W 42nd St Savannah, GA | 3.0 | 2.0 | 1300 | $1,800 | $1.38 | 46d | 1 | 0.49mi |
| 1314 Lincoln St Savannah, GA | 3.0 | 2.0 | 1312 | $2,400 | $1.83 | 46d | 1 | 0.49mi |
| 1505 Reynolds St Savannah, GA | 4.0 | 2.0 | 1314 | $2,650 | $2.02 | 46d | 1 | 0.49mi |
| 214 E 48th St Savannah, GA | 3.0 | 2.0 | 1950 | $2,499 | $1.28 | 46d | 1 | 0.51mi |
| 216 E 48th St Savannah, GA | 3.0 | 1.0 | 1950 | $2,395 | $1.23 | 46d | 1 | 0.52mi |
| 217 W 32nd St Unit A Savannah, GA | 3.0 | 1.0 | 1200 | $1,600 | $1.33 | 16d | 1 | 0.54mi |
| 217 W 32nd St Unit B Savannah, GA | 3.0 | 1.0 | 1222 | $1,550 | $1.27 | 16d | 1 | 0.54mi |
| 305 E Duffy St Unit A Savannah, GA | 3.0 | 2.0 | 1248 | $3,000 | $2.40 | 46d | 1 | 0.57mi |
| 802 E 36th St Savannah, GA | 3.0 | 1.5 | 2105 | $2,400 | $1.14 | 46d | 1 | 0.59mi |
| 516 W 38th St Unit 1/2 Savannah, GA | 3.0 | 1.0 | 1176 | $1,500 | $1.28 | 16d | 1 | 0.59mi |
| 516 W 38th St Unit 1/2 Savannah, GA | 3.0 | 1.0 | 1176 | $1,600 | $1.36 | 25d | 1 | 0.59mi |
| 138 E 50th St Unit 2 Savannah, GA | 3.0 | 2.0 | 2200 | $3,000 | $1.36 | 46d | 1 | 0.61mi |
| 524 E Duffy St Unit 1369217P Savannah, GA | 4.0 | 2.0 | 2152 | $5,801 | $2.70 | 25d | 1 | 0.63mi |
| 643 E Henry St Unit B Savannah, GA | 3.0 | 1.5 | 1207 | $1,899 | $1.57 | 25d | 1 | 0.63mi |
| 1409 Jefferson St Savannah, GA | 3.0 | 2.5 | 1347 | $2,699 | $2.00 | 46d | 1 | 0.63mi |
Listing history 24 events
-
2026-06-21days on market $400,000 Active 73 DOM
-
2026-06-18days on market $400,000 Active 70 DOM
-
2026-06-17days on market $400,000 Active 69 DOM
-
2026-06-16days on market $400,000 Active 68 DOM
-
2026-06-15days on market $400,000 Active 67 DOM
-
2026-06-14days on market $400,000 Active 65 DOM
-
2026-06-13days on market $400,000 Active 64 DOM
-
2026-06-10days on market $400,000 Active 62 DOM
-
2026-06-09days on market $400,000 Active 61 DOM
-
2026-06-08days on market $400,000 Active 60 DOM
-
2026-06-07days on market $400,000 Active 59 DOM
-
2026-06-05days on market $400,000 Active 56 DOM
-
2026-06-03days on market $400,000 Active 55 DOM
-
2026-06-02days on market $400,000 Active 54 DOM
-
2026-06-01days on market $400,000 Active 53 DOM
-
2026-05-31days on market $400,000 Active 52 DOM
-
2026-05-30days on market $400,000 Active 51 DOM
-
2026-03-16$400,000 Active 851-char remark
Show marketing remark (851 chars)
217 E 38th St is a completely gutted, two-story single-family home in Savannah's historic Griffin Ward neighborhood. Stripped to the studs and sold AS-IS, this is a true gut-renovation opportunity. The 1920-built wood-frame structure sits on a 0.11-acre lot zoned TN-2 in the Streetcar Historic District. Prior permitted renovation work totaling $145,000+ has been completed on the structure. No utilities are currently operational. Cash or construction loan only. Flood Zone X — no flood insurance required. Buyer to verify all information including square footage, room count, and condition. Located minutes from Downtown Savannah, Daffin Park, SCAD, and the Thomas Square arts corridor — a rare chance to put your vision to work in one of the city's most sought-after historic neighborhoods. Contact listing agent to schedule a showing.
-
2025-11-21historical
-
2025-10-30$320,000 New
-
2008-08-04soldstatus $210,000
-
2008-07-31soldstatus $210,000
-
2008-07-01$300,000
-
2000-01-03soldstatus $225,000
ⓘ Source: listings_history table (triggers on properties + properties_extension) + one-shot
backfill from property_details.listing_events for pre-trigger history.
Tax reassessment forecast GA · Resets to sale price
- Current annual tax
- $1,093 · $91/mo
- Projected year-2 tax
- $3,680 · $307/mo
- Expected delta
- +$2,587/yr (+$216/mo · 236.7%)
ⓘ Screening estimate from a state-policy table — verify with the county assessor before closing.
Climate risk First Street
- Flood 1/10 Low FEMA zone X (unshaded) · 0% chance over 30 yrs
- Wildfire 1/10 Low
- Heat 10/10 Extreme 7 d/yr ≥107°F today · 18 d/yr by 30 yrs out
- Wind 9/10 Extreme 99% chance of damaging wind over 30 yrs
- Air quality 5/10 Major 7 unhealthy d/yr today · 8 by 30 yrs out
Nearby sold comps map
Loading sold comps map…
Walkable amenities ~0.75 mi
Loading nearby amenities…
Taxation est. · year 1
- Rental income
- $33,470
- − Mortgage interest
- −$22,406
- − Property taxes
- −$1,093
- − Insurance
- −$2,000
- − Repairs & maintenance
- −$2,678
- − Management
- −$2,678
- − Depreciation
- −$11,636
- Taxable loss
- −$9,021
- Est. tax savings @ 24.0%
- +$2,165
- After-tax cash flow
- $342/yr
For passive investors: Depreciation is non-cash, so a rental often shows a tax loss while cash-flowing — sheltering income. Rental losses are passive: they offset passive income freely, and up to $25,000/yr can offset ordinary (W-2) income if you actively participate and your MAGI is under $100k (phasing out to $0 by $150k); unused losses carry forward. On sale, claimed depreciation is recaptured at up to 25%, and gains may owe capital-gains tax (a 1031 exchange can defer both). Figures are a year-1 estimate at your 24.0% rate — not tax advice; consult a CPA.
Schools (NCES district)
- District
- Savannah-Chatham County
- NCES district ID
- 1301020
- Math proficiency
- 20% ▼ -11.00%
- Reading proficiency
- 26% ▼ -5.00%
- Median HH income
- $47,443
- Composite
- 20.14/100
- National rank
- #8639
- State rank
- #134 of 174 in GA
Livability — Savannah
- Score
- 86/100
- State rank
- #1
- US rank
- #397
Category grades
Schools grade is shown separately in the Schools card above.
Census & demographics
- Census place
- Savannah, GA
- County
- Chatham County · 271,602 people
- City population
- 216,564
- Metro
- Savannah, GA
- Population (ZIP)
- 20,445
- Household income
- $52,509
- Rent vs Own
- Severe rent burden
- 2031.0
Population outlook (Chatham County) Hauer SSP2
- Today (2025)
- 332,584 people
- By 2030
- 355,508 · +6.9%
- By 2040
- 400,030 · +20.3%
- By 2050
- 443,019 · +33.2%
- By 2075
- 534,579 · +60.7%
- By 2100
- 583,863 · +75.6%
Race, ethnicity, and origin ACS 2023
- Neighborhood character
- Diverse neighborhood (Simpson 0.59)
- Race & ethnicity
- White 53% Black 35% Hispanic / Latino 7% Two or more races 5% Asian 3%
- Hispanic origin (detail)
- Mexican 2% Puerto Rican 2%
- Common ancestry
- Slovak 2% Lithuanian 2% Romanian 2%
- Foreign-born
- 8% · Canada, China
- Languages at home
- 90% English-only · Spanish 4% Chinese 2% Other Indo-European 1%
Political lean MEDSL · Chatham
- 2024 margin
- D (+18.0) · D 58.6% · R 40.6%
- 2008→2024 swing
- +3.6pp toward D · 2008: 14.4pp · 2024: 18.0pp
- All cycles
- 2024: D+18.0 2020: D+18.8 2016: D+14.5 2012: D+12.0 2008: D+14.4
Not yet ingested
- Civics
- —
Market trends
- HPI YoY
- ▼ -358.74%
- Current HPI
- 553.5645
- Rent YoY
- ▲ 2.95%
- Metro
- Savannah, GA
- State GDP YoY
- ▲ 2.66%
- F500 in state
- 28
Industry mix (Fortune 500 HQ in GA)
| Industry | F500 HQs | Revenue |
|---|---|---|
| Paper / Packaging | 2 | $29B |
|
||
| Retail | 1 | $160B |
|
||
| Transportation / Logistics | 1 | $91B |
|
||
| Airlines | 1 | $62B |
|
||
| Consumer Goods | 1 | $47B |
|
||
| Utilities | 1 | $25B |
|
||
Price history
+77.8% since first listed7 events — show timeline
- 2026-03-16 Listed $400,000 Hive MLS
- 2025-11-21 Listing Removed — GAMLS
- 2025-10-30 Listed $320,000 GAMLS
- 2008-08-04 Sold (Public Records) $210,000 Public Records
- 2008-07-31 Sold (MLS) $210,000 Hive MLS
- 2008-07-01 Listed $300,000 Hive MLS
- 2000-01-03 Sold (Public Records) $225,000 Public Records
Property tax history
-0.7%/yrLatest (2025): $1,093 · -0.4% YoY. Source: county tax records.
Cash-flow waterfall
monthlySold comps — $/sqft
last 12 mo · ≤1 miLoading sold comps…