9599 Golden Ln · Birmingham, AL
Flood risk 1/10 · Minimal
- FEMA flood zone
- X (unshaded)
- Chance of flooding over 30 yrs
- 0.0%
- Est. flood insurance / yr
- $507 – $1,088
Fire risk 5/10 · Moderate
- Est. fire insurance / yr
- $916 – $1,700
Heat risk 6/10 · Moderate
- Hot days now (above 108°F)
- 7 days/yr
- Hot days in 30 yrs
- 19 days/yr
Wind risk 6/10 · Moderate
- Chance of severe wind over 30 yrs
- 45.0%
Air-quality risk 3/10 · Minor
- Unhealthy air days now
- 3 days/yr
- Unhealthy air days in 30 yrs
- 3 days/yr
Risk factors via First Street. Map © Google.
Why this score? — see what drove the B grade
The composite is a weighted blend of 9 inputs, each scored 0–100. Each bar is that input's sub-score; the figure is the points it added to the 100-point composite (weight × sub-score).
- Cash flow +30.0/30.0
- 1% rule +10.0/10.0
- DSCR +10.0/10.0
- ARV discount +7.5/15.0
- Appreciation +4.7/10.0
- Livability +3.4/5.0
- Rent growth +2.9/5.0
- Condition / age +2.5/5.0
- Schools +1.8/10.0
$95,000
🖨 Deal sheet (PDF) 📄 Offer letter ✓ Due diligence
Listing remarks
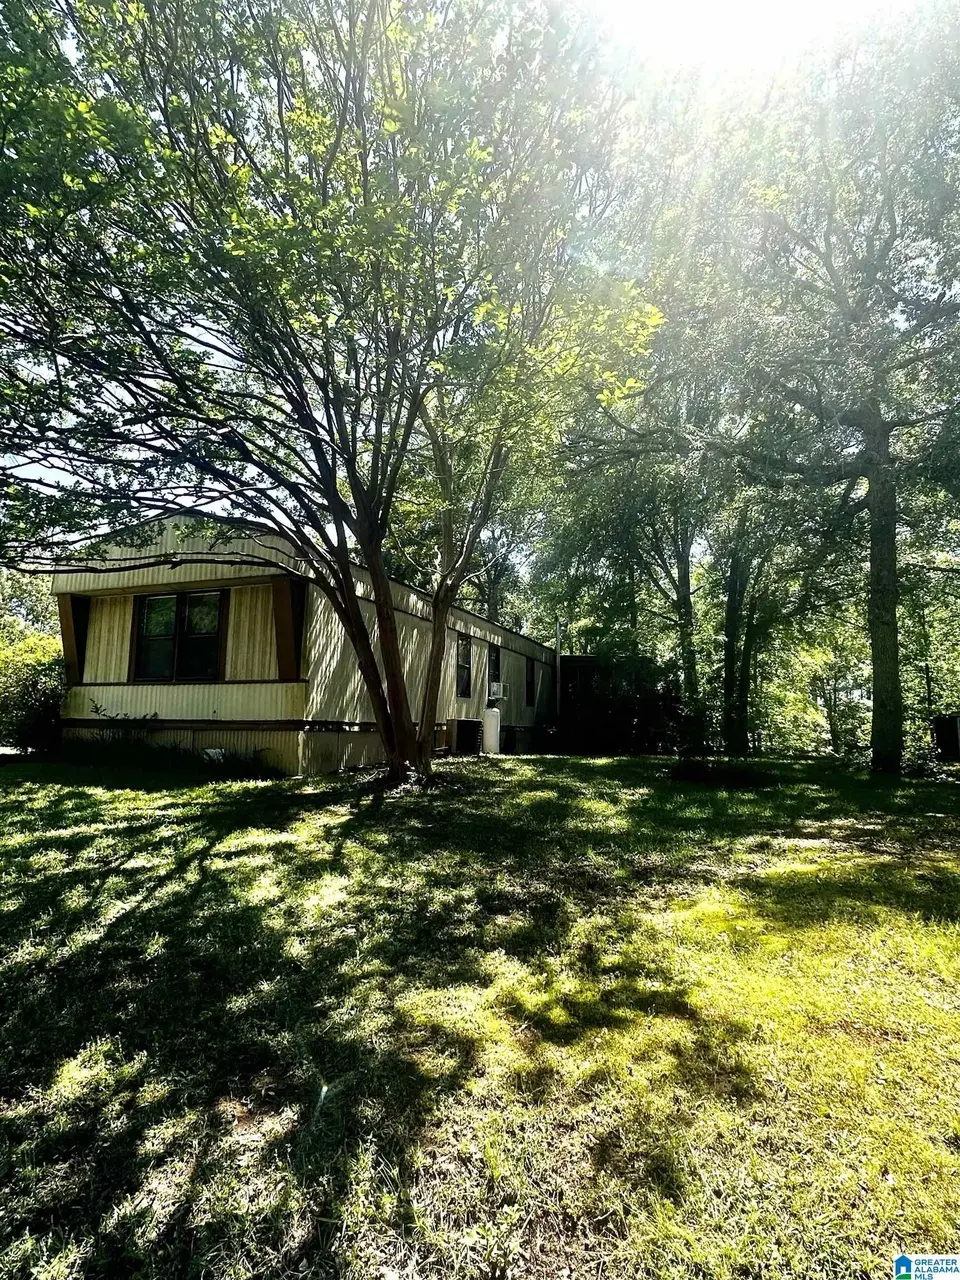
WALKING DISTANCE TO OAK GROVE SCHOOLS! Great lot on dead end street! Property has been very well taken care of. This would make a great starter home or investment property. Great covered porch with ceiling fans, back screened in porch and also open deck perfect for grilling. Two outbuildings included. This lot is gorgeous, full of trees adding in privacy!
Key facts
- 0.99 acre lot
- Parking
- Built 1986
Property features AI
Finance
- Other: Lot size approximately 0.99 acre; Not in a flood plain
- Financial info: Down payment assistance available
Exterior
- Parking: Driveway parking; One carport space
- Utilities: Public water; Septic system; Electric water heater; Internet service available (provider TBD)
- Home design: Existing home; Single-story layout (all rooms listed at main level); Foundation on pillars/support
- Construction: Vinyl siding construction
- Exterior features: Screened porch; Storage building; Decks present (covered, open, and screened)
Interior
- Kitchen: Laminate countertops; Refrigerator; Electric stove
- Bedrooms: Master bedroom on main level; Two additional bedrooms on main level
- Flooring: Carpet
- Bathrooms: Two full bathrooms; Master bath includes garden tub and tub/shower combo
- Heating & cooling: Central heating; Central cooling
- Interior features: Carpet flooring; Ceilings: other (see remarks); No additional interior features listed
- Laundry & utility: Main-level laundry room; Washer hookup; Electric dryer hookup; Electric water heater
Neighborhood map
What this means for you Summary
Snapshot
- This is a 3-bed/2.0-bath single-family listed at $95k.
Deal economics
- At list price, monthly cash flow is $541 ($6k/yr) — positive.
- The deal already cash-flows at list — no discount required.
- Meets the 1% rule at list price ($2k rent vs $95k).
- Recommended offer: $92k (3.0% below list) — sets the bar for market timing.
- Cap rate 13.1% vs local median 6.2% in Birmingham — top-decile yield for the area; either an underpriced asset or a hidden risk that comps aren't pricing in. Stress-test before assuming the spread holds.
Location & tenants
- Location reads 67/100 on livability (#78 in AL) — a middle-class / working-renter tenant base. Strengths: commute A+, cost of living A+, housing A+; Watch: amenities C-, crime F, employment F.
- Jefferson County (suburban): math 9% / reading 32% proficiency, ranked #104 of 129 in AL (top 81%) — low school quality limits family demand, transient renter base, plan for 1-2y turnover.
- Zoned schools: Oak Grove Elementary School (math 27% / reading 47%, grade F, #267 of 627 statewide, top 45%, 570 students, 53% FRL); Oak Grove High School (math 7% / reading 29%, grade F, #187 of 305 statewide, top 62%, 744 students, 53% FRL) — zoned schools at 53% FRL track the district average.
- Market conditions: Rents rising (+1.6%/yr); 250 active listings in the ZIP; 2,114 units permitted in Jefferson County in 2024 (556 in 5+ unit buildings).
Forward outlook
- In year one you build about $87 of equity ($657 loan paydown + $-570 appreciation (-0.6% local appreciation)).
- Jefferson County population projected to shrink 4% by 2050 — rents likely to lag national; underwrite the cash flow, not the appreciation.
- At projected returns (-0.6% appreciation + 1.6% rent growth), your $27k cash investment doubles in ~4 years — after that, you're playing with house money.
Negotiation context
- It's been on market 43 days — a 3% lower offer ($92k) is reasonable based on typical stale-listing flexibility.
Risks & watch-outs
- Climate carrying-cost: major wind risk, 45% chance of damaging wind over 30y; moderate wildfire risk; extreme-heat days projected 7→19/yr by 2055 (HVAC capex compounding) — expect insurance premiums to compound above CPI over the hold.
Questions for the listing agent
- It's been on market 43 days. Have you received any prior offers? Is the seller open to a 3% concession, seller financing, or rate buy-down credit?
- Is there a deadline driving the sale (1031 exchange, divorce, estate, relocation)? That informs how much negotiation room exists.
- Schools are F-rated, which usually means shorter tenancies and higher turnover. Who's the typical renter profile here, and what's been the actual vacancy rate?
- Crime grade is F in this area — have there been break-ins, vandalism, or insurance claims at this property in the last 3 years? What carrier currently insures it and at what premium?
- What's the average days-on-market for RENTAL listings here right now (not sales)? A rising rental-DOM trend means longer vacancies and softer asking-rent achievability than the comps imply.
- What's the recent tenant-quality profile in this submarket — average credit score on applications, eviction rate, late-payment / NSF rate, and stable-employment percentage? A property-management company in the area should have these aggregated.
- How much new for-sale + rental construction is in the pipeline within 1–3 miles? Heavy new supply typically softens prices + rents 12–24 months out; constrained supply supports both.
Investment metrics
- 1% rule
- 1.60% ✓
- Cap rate
- 13.12%
- Cash-on-cash
- 24.39%
- DSCR
- 2.09
- GRM
- 5.2
CMA / ARV
- ARV (median comp)
- $195,480
- List price
- $95,000
- Delta
- -51.40%
- Verdict
- UNDERPRICED
- Comps
- 5 within 2.0 mi
Projected returns pro-forma
-0.6% appreciation · 1.6% rent growth · sell at horizon
- IRR
- 21.9%
- Equity multiple
- 2.01×
- Total profit
- $26,928
- Equity at exit
- $24,769
- IRR
- 25.9%
- Equity multiple
- 3.60×
- Total profit
- $69,037
- Equity at exit
- $27,610
Cash invested: $26,600 (down + closing). Projections, not guarantees.
Landlord ↔ Tenant lean methodology
- Overall (STATE)
- 90 Strongly Landlord-Friendly
- State Alabama
- 90 Strongly Landlord-Friendly · R+15
- County
- — inherits STATE
- City
- — inherits STATE
ZIP-level market 35023
- Home prices YoY
- -0.1%
- Rents YoY
- 1.6%
- Active inventory
- 250
- Price-to-rent
- 5.2×
Monthly cashflow live
- Estimated rent
- $1,515 medium interval (Pro) →
- Mortgage (P&I)
- −$498
- Tax est. 1.5%
- −$119 /mo · $1,425/yr
- Insurance
- −$40
- HOA
- −$0
- Vacancy / Maint / Mgmt
- −$318
- Net cashflow
- $541
Break-even live
Sensitivity live
| Price | -10% $606 | -5% $574 | +0% $541 | +5% $508 | +10% $475 |
|---|---|---|---|---|---|
| Rent | -10% $421 | -5% $481 | +0% $541 | +5% $601 | +10% $660 |
| Rate | -1.0pp $589 | -0.5pp $565 | base $541 | +0.5pp $516 | +1.0pp $491 |
UW: 25.0% down · 7.5% · 30yr · 1.5% tax · 5.0% vac · 8.0% maint · 8.0% mgmt
Financing live
Cash to close
- Down payment
- $23,750
- Closing costs
- $2,850
- Reserves months
- —
- Total cash needed
- —
Loan-product check · same deal, 3 products live
Conventional
25% down · 7.5% · 30yr
- Down + closing
- —
- Monthly P&I
- —
- Monthly cashflow
- —
- DSCR
- —
- Eligible?
- —
Personal DTI + credit; lowest rate.
DSCR
20% down · 8.5% · 30yr
- Down + closing
- —
- Monthly P&I
- —
- Monthly cashflow
- —
- DSCR
- —
- Eligible?
- —
No personal income docs; deal must DSCR.
Hard money
10% down · 12.0% · 12mo
- Down + closing
- —
- Monthly P&I
- —
- Monthly cashflow
- —
- DSCR
- —
- Eligible?
- —
Short-term bridge; refi at stabilization.
Listing history 15 events
-
2026-06-18days on market $95,000 Active 43 DOM
-
2026-06-17days on market $95,000 Active 42 DOM
-
2026-06-16days on market $95,000 Active 41 DOM
-
2026-06-15days on market $95,000 Active 40 DOM
-
2026-06-13days on market $95,000 Active 38 DOM
-
2026-06-10days on market $95,000 Active 35 DOM
-
2026-06-09days on market $95,000 Active 34 DOM
-
2026-06-08days on market $95,000 Active 33 DOM
-
2026-06-07days on market $95,000 Active 32 DOM
-
2026-06-03days on market $95,000 Active 28 DOM
-
2026-06-02days on market $95,000 Active 27 DOM
-
2026-06-01days on market $95,000 Active 26 DOM
-
2026-05-31days on market $95,000 Active 25 DOM
-
2026-05-06$95,000 Active 357-char remark
-
2026-05-05historical $95,000 357-char remark
ⓘ Source: listings_history table (triggers on properties + properties_extension) + one-shot
backfill from property_details.listing_events for pre-trigger history.
Climate risk First Street
- Flood 1/10 Low FEMA zone X (unshaded) · 0% chance over 30 yrs
- Wildfire 5/10 Major
- Heat 6/10 Major 7 d/yr ≥108°F today · 19 d/yr by 30 yrs out
- Wind 6/10 Major 45% chance of damaging wind over 30 yrs
- Air quality 3/10 Moderate 3 unhealthy d/yr today · 3 by 30 yrs out
Nearby sold comps map
Loading sold comps map…
Walkable amenities ~0.75 mi
Loading nearby amenities…
Taxation est. · year 1
- Rental income
- $18,186
- − Mortgage interest
- −$5,321
- − Property taxes
- −$1,425
- − Insurance
- −$475
- − Repairs & maintenance
- −$1,455
- − Management
- −$1,455
- − Depreciation
- −$2,764
- Taxable income
- $5,291
- Est. tax owed @ 24.0%
- −$1,270
- After-tax cash flow
- $5,219/yr
For passive investors: Depreciation is non-cash, so a rental often shows a tax loss while cash-flowing — sheltering income. Rental losses are passive: they offset passive income freely, and up to $25,000/yr can offset ordinary (W-2) income if you actively participate and your MAGI is under $100k (phasing out to $0 by $150k); unused losses carry forward. On sale, claimed depreciation is recaptured at up to 25%, and gains may owe capital-gains tax (a 1031 exchange can defer both). Figures are a year-1 estimate at your 24.0% rate — not tax advice; consult a CPA.
Schools (NCES district)
- District
- Jefferson County
- NCES district ID
- 0101920
- Math proficiency
- 9% ▼ -24.00%
- Reading proficiency
- 32% ▼ -5.00%
- Median HH income
- $51,712
- Composite
- 18.4/100
- National rank
- #8937
- State rank
- #104 of 129 in AL
Livability — Birmingham
- Score
- 67/100
- State rank
- #78
- US rank
- #10412
Category grades
Schools grade is shown separately in the Schools card above.
Census & demographics
- County
- Jefferson County · 527,445 people
- City population
- 210,422
- Metro
- Birmingham-Hoover, AL
- Population (ZIP)
- 25,533
- Household income
- $69,863
- Rent vs Own
- Severe rent burden
- 247.0
Population outlook (Jefferson County) Hauer SSP2
- Today (2025)
- 669,185 people
- By 2030
- 669,694 · +0.1%
- By 2040
- 661,388 · -1.2%
- By 2050
- 643,086 · -3.9%
- By 2075
- 577,267 · -13.7%
- By 2100
- 474,758 · -29.1%
Race, ethnicity, and origin ACS 2023
- Neighborhood character
- Diverse neighborhood (Simpson 0.56)
- Race & ethnicity
- White 58% Black 30% Hispanic / Latino 7% Two or more races 3%
- Hispanic origin (detail)
- Mexican 5%
- Common ancestry
- Slovak 1% Lithuanian 1% Serbian 1%
- Foreign-born
- 4% · Canada
- Languages at home
- 93% English-only · Spanish 7%
Political lean MEDSL · Jefferson
- 2024 margin
- D (+10.4) · D 54.6% · R 44.2% · Other 1.2%
- 2008→2024 swing
- +5.4pp toward D · 2008: 5.1pp · 2024: 10.4pp
- All cycles
- 2024: D+10.4 2020: D+13.2 2016: D+7.2 2012: D+6.0 2008: D+5.1
Not yet ingested
- Civics
- —
Market trends
- HPI YoY
- ▼ -0.60%
- Current HPI
- 389.38
- Rent YoY
- ▲ 1.60%
- Metro
- Birmingham-Hoover, AL
- State GDP YoY
- ▲ 2.94%
- F500 in state
- 4
Industry mix (Fortune 500 HQ in AL)
| Industry | F500 HQs | Revenue |
|---|---|---|
| Financial Services | 1 | $8B |
|
||
| Healthcare | 1 | $5B |
|
||
Price history
+0.0% since first listed2 events — show timeline
- 2026-05-06 Listed $95,000 Greater Alabama MLS
- 2026-05-05 Coming Soon $95,000 Greater Alabama MLS
Cash-flow waterfall
monthlySold comps — $/sqft
last 12 mo · ≤1 miLoading sold comps…