 Triplex
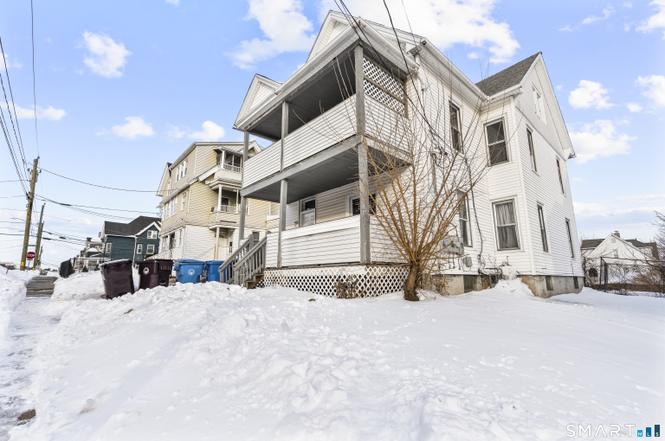
484 Church St · New Britain, CT
Flood risk 1/10 · Minimal
- FEMA flood zone
- X (unshaded)
- Chance of flooding over 30 yrs
- 0.0%
- Est. flood insurance / yr
- $473 – $860
Fire risk 1/10 · Minimal
- Est. fire insurance / yr
- $829 – $1,539
Heat risk 5/10 · Moderate
- Hot days now (above 97°F)
- 7 days/yr
- Hot days in 30 yrs
- 15 days/yr
Wind risk 6/10 · Moderate
- Chance of severe wind over 30 yrs
- 27.0%
Air-quality risk 3/10 · Minor
- Unhealthy air days now
- 2 days/yr
- Unhealthy air days in 30 yrs
- 3 days/yr
Risk factors via First Street. Map © Google.
Why this score? — see what drove the B- grade
The composite is a weighted blend of 9 inputs, each scored 0–100. Each bar is that input's sub-score; the figure is the points it added to the 100-point composite (weight × sub-score).
- Cash flow +30.0/30.0
- DSCR +10.0/10.0
- Appreciation +10.0/10.0
- 1% rule +9.9/10.0
- Livability +3.7/5.0
- Condition / age +2.5/5.0
- Rent growth +2.4/5.0
- Schools +1.0/10.0
- ARV discount +0.0/15.0
$459,900
🖨 Deal sheet 📄 Offer letter ✓ Due diligence
Multi-family units
County records classify this as Multi-Family (2-4 Unit). Listing-text estimate: 3 units. confirmed
Listing remarks MLS
BACK ON THE MARKET!!! THIS THREE FAMILY HOME HAS HAS A TOTAL OF FIVE BEDROOMS AND THREE BATHROOMS WITH OVER 2700 SQ FT OF LIVING SPACE. INDIVIDUAL PORCHES FOR EACH UNIT AND FULL BASEMENT FOR ADDED STORAGE. LOCATED CLOSE TO SHOPPING AND RESTURANTS. HUD Home. Sold “AS IS” by electronic bid only. Property Available 04-23-2021. Bids due by 04-27-2021 11:59 PM Central Time then daily until sold. FHA Case #061-341110. Uninsurable. Eligible for FHA 203K. Buyer to verify all info. Equal Housing Opportunity. Finance Terms: Cash, FHA, and Conventional
Key facts
- Extensively updated
- Fully renovated
- Solid rental history
Tags
Neighborhood map
What this means for you Summary
Snapshot
- This is a 3 × 5-bed/3.0-bath units multifamily listed at $460k.
Deal economics
- At list price, monthly cash flow is $2k ($27k/yr) — positive. Per door: $739/mo.
- The deal already cash-flows at list — no discount required.
- Meets the 1% rule at list price ($7k rent vs $460k).
- Recommended offer: $432k (6.0% below list) — sets the bar for market timing.
- Cap rate 12.1% vs local median 4.4% in New Britain — top-decile yield for the area; either an underpriced asset or a hidden risk that comps aren't pricing in. Stress-test before assuming the spread holds.
Location & tenants
- Location reads 74/100 on livability (#67 in CT, #4,936 nationally) — a middle-class / working-renter tenant base. Strengths: health & safety A+, cost of living A, housing A; Watch: crime D, employment D, schools F.
- New Britain School District (suburban): math 6% / reading 17% proficiency, ranked #153 of 153 in CT (top 100%) — low school quality limits family demand, transient renter base, plan for 1-2y turnover; 71% free/reduced lunch — lower-income household profile, screen leases tightly.
- Market conditions: Rents soft (-0.6%/yr); 63 active listings in the ZIP; 13 comparable units currently listed for rent nearby; rentals at typical pace (median 24d on market — plan ~3-4 weeks tenant-placement turnaround); 1,867 units permitted in Capitol Planning Region in 2024 (1,399 in 5+ unit buildings).
- At $6,831/mo this rent would consume 161% of the median local household income ($51k/yr) (locally 2100% of renters already pay >50% of income on rent) — very limited rent-growth headroom before tenants either downsize or default.
Forward outlook
- In year one you build about $49k of equity ($3k loan paydown + $46k appreciation (10.0% local appreciation)).
- At projected returns (10.0% appreciation + 0.0% rent growth), your $129k cash investment doubles in ~2 years — after that, you're playing with house money.
- By year 2, paydown + projected appreciation supports a ~$79k cash-out refi (75% LTV) — recoverable capital for the next deal without selling this one.
Negotiation context
- It's been on market 73 days — a 6% lower offer ($432k) is reasonable based on typical stale-listing flexibility.
- 11 sale attempts since 21y ago with the ask held roughly flat each time — persistent listings suggest the price (not the market) is what's stuck; bring a comps-based counter.
- Current owner paid $152k; list at $460k implies a 203% gain — meaningful room to come down on a strong offer.
Risks & watch-outs
- Watch-outs: built in 1895 — expect roof / HVAC / electrical / plumbing capex.
- Climate carrying-cost: major wind risk, 27% chance of damaging wind over 30y; extreme-heat days projected 7→15/yr by 2055 (HVAC capex compounding) — expect insurance premiums to compound above CPI over the hold.
Questions for the listing agent
- It's been on market 73 days. Have you received any prior offers? Is the seller open to a 6% concession, seller financing, or rate buy-down credit?
- Can we see the unit-by-unit rent roll, current vacancy, and any below-market leases? What's the average tenancy length?
- What capital expenditures (roof, boiler, parking lot, exteriors) have been made in the last 5 years, and what's planned in the next 2?
- Built in 1895 — when were the roof, HVAC, electrical panel, plumbing, and water heater last replaced?
- Why hasn't it sold? Are there any deal-killer items the seller is aware of (foundation, flood, title, zoning, code violations)?
- Is there a deadline driving the sale (1031 exchange, divorce, estate, relocation)? That informs how much negotiation room exists.
- Schools are F-rated, which usually means shorter tenancies and higher turnover. Who's the typical renter profile here, and what's been the actual vacancy rate?
- Crime grade is D in this area — have there been break-ins, vandalism, or insurance claims at this property in the last 3 years? What carrier currently insures it and at what premium?
- What's the average days-on-market for RENTAL listings here right now (not sales)? A rising rental-DOM trend means longer vacancies and softer asking-rent achievability than the comps imply.
- What's the recent tenant-quality profile in this submarket — average credit score on applications, eviction rate, late-payment / NSF rate, and stable-employment percentage? A property-management company in the area should have these aggregated.
- How much new apartment / multifamily construction is in the pipeline within 1–3 miles? Heavy new supply (>2% of stock underway) typically softens rents 12–24 months out; light construction supports rent growth.
Investment metrics
- 1% rule
- 1.49% ✓
- Cap rate
- 12.08%
- Cash-on-cash
- 20.66%
- DSCR
- 1.92
- GRM
- 5.6
CMA / ARV
- ARV (on-the-fly)
- $348,460
- Comps found
- 8
Show comp detail 8 sales within ~0.75 mi
| Address | Dist | Beds/Ba | Sqft | Sold | Price | $/sf | Match |
|---|---|---|---|---|---|---|---|
| 484 Church St | 0.00mi | 5/3.0 (+1) | 2,620 (0%) | 0mo | $430,000 | $164 | 95 |
| 411 Ellis St | 0.68mi | 5/3.0 (+1) | 2,688 (+3%) | 2mo | $450,000 | $167 | 58 |
| 56-58 Austin St | 0.38mi | 4/2.0 | 2,766 (+6%) | 14mo | $365,000 | $132 | 58 |
| 15 Noble St | 0.29mi | 4/4.0 | 2,918 (+11%) | 13mo | $301,000 | $103 | 53 |
| 498 Stanley St | 0.43mi | 5/3.0 (+1) | 2,466 (-6%) | 18mo | $290,000 | $118 | 50 |
| 267 Chapman St | 0.42mi | 5/3.0 (+1) | 2,318 (-12%) | 8mo | $360,000 | $155 | 49 |
| 113 Fairview St | 0.19mi | 5/3.0 (+1) | 2,930 (+12%) | 22mo | $250,000 | $85 | 48 |
| 257 Whiting St | 0.41mi | 5/2.0 (+1) | 2,943 (+12%) | 16mo | $392,500 | $133 | 38 |
Match score weights: distance 35% · size 25% · config 20% · recency 20%. Top-matched comps best support the ARV.
Projected returns pro-forma
10.0% appreciation · 0.0% rent growth · sell at horizon
- IRR
- 38.1%
- Equity multiple
- 3.89×
- Total profit
- $371,772
- Equity at exit
- $414,314
- IRR
- 31.8%
- Equity multiple
- 8.36×
- Total profit
- $948,119
- Equity at exit
- $893,485
Cash invested: $128,772 (down + closing). Projections, not guarantees.
Landlord ↔ Tenant lean methodology
- Overall (STATE)
- 27 Tenant-Leaning
- State Connecticut
- 27 Tenant-Leaning · D+7
- County
- — inherits STATE
- City
- — inherits STATE
ZIP-level market 06051
- Home prices YoY
- 9.0%
- Rents YoY
- -0.6%
- Active inventory
- 63
- Price-to-rent
- 16.8×
Monthly cashflow live
- Estimated rent
- $6,831 medium interval (Pro) →
- Mortgage (P&I)
- −$2,412
- Tax from tax record
- −$576 /mo · $6,911/yr
- Insurance
- −$192
- HOA
- −$0
- Vacancy / Maint / Mgmt
- −$1,435
- Net cashflow
- $2,217
Break-even live
3-unit breakdown (identical units grouped — click to expand)
| Units | Beds | Baths | Est. rent |
|---|---|---|---|
| 3× units | 5 | 3 | $6,831 |
| #1 | 5 | 3 | $2,277 |
| #2 | 5 | 3 | $2,277 |
| #3 | 5 | 3 | $2,277 |
| Total (3 units) | $6,831 | ||
UW: 25.0% down · 7.5% · 30yr · 1.5% tax · 5.0% vac · 8.0% maint · 8.0% mgmt
Financing live
Cash to close
- Down payment
- $114,975
- Closing costs
- $13,797
- Reserves months
- —
- Total cash needed
- —
Loan-product check · same deal, 3 products live
Conventional
25% down · 7.5% · 30yr
- Down + closing
- —
- Monthly P&I
- —
- Monthly cashflow
- —
- DSCR
- —
- Eligible?
- —
Personal DTI + credit; lowest rate.
DSCR
20% down · 8.5% · 30yr
- Down + closing
- —
- Monthly P&I
- —
- Monthly cashflow
- —
- DSCR
- —
- Eligible?
- —
No personal income docs; deal must DSCR.
Hard money
10% down · 12.0% · 12mo
- Down + closing
- —
- Monthly P&I
- —
- Monthly cashflow
- —
- DSCR
- —
- Eligible?
- —
Short-term bridge; refi at stabilization.
Rent comps 13 comps
| Address | Beds | Baths | Sqft | Rent | $/sqft | DOM | Units | Dist |
|---|---|---|---|---|---|---|---|---|
| 184 Fairview St Unit 1 New Britain, CT | 3.0 | 1.0 | 3596 | $1,550 | $0.43 | 43d | 1 | 0.08mi |
| 402 Church St New Britain, CT | 3.0 | 1.0 | 3744 | $2,285 | $0.61 | 23d | 1 | 0.17mi |
| 281 Chestnut St New Britain, CT | 3.0 | 1.5 | 3468 | $1,900 | $0.55 | 23d | 1 | 0.22mi |
| 24 Rocky Hill Ave New Britain, CT | 3.0 | 1.0 | 2916 | $1,650 | $0.57 | 43d | 1 | 0.52mi |
| 423 Stanley St Unit 1 New Britain, CT | 3.0 | 1.0 | 3712 | $2,300 | $0.62 | 43d | 1 | 0.56mi |
| 45 Union St New Britain, CT | 5.0 | 2.0 | 2060 | $2,800 | $1.36 | 23d | 1 | 0.60mi |
| 341 Stanley St New Britain, CT | 3.0 | 1.0 | 3460 | $1,700 | $0.49 | 23d | 1 | 0.70mi |
| 24 Acorn St New Britain, CT | 3.0 | 1.0 | 2444 | $2,000 | $0.82 | 23d | 1 | 0.87mi |
| 271 Glen St New Britain, CT | 3.0 | 1.0 | 2230 | $1,950 | $0.87 | 1d | 1 | 1.01mi |
| 412 S Main St Unit 1st floor New Britain, CT | 3.0 | 1.0 | 1863 | $1,975 | $1.06 | 1d | 1 | 1.05mi |
| 1366 Stanley St New Britain, CT | 4.0 | 1.0 | 1944 | $2,400 | $1.23 | 43d | 1 | 1.13mi |
| 125 Columbia St Unit 2FF New Britain, CT | 3.0 | 1.0 | 3384 | $1,600 | $0.47 | 16d | 1 | 1.26mi |
| 89 Vance St New Britain, CT | 3.0 | 2.0 | 2944 | $2,040 | $0.69 | 1d | 1 | 1.49mi |
Listing history 29 events
-
2026-04-25status Under Contract
-
2026-02-11$459,900 Active
-
2026-02-10historical
-
2025-10-27status Active
-
2025-10-27status Under Contract
-
2025-10-07$460,000 Active
-
2021-05-28soldstatus $152,000 Closed 559-char remark
Show marketing remark (559 chars)
BACK ON THE MARKET!!! THIS THREE FAMILY HOME HAS HAS A TOTAL OF FIVE BEDROOMS AND THREE BATHROOMS WITH OVER 2700 SQ FT OF LIVING SPACE. INDIVIDUAL PORCHES FOR EACH UNIT AND FULL BASEMENT FOR ADDED STORAGE. LOCATED CLOSE TO SHOPPING AND RESTURANTS. HUD Home. Sold “AS IS” by electronic bid only. Property Available 04-23-2021. Bids due by 04-27-2021 11:59 PM Central Time then daily until sold. FHA Case #061-341110. Uninsurable. Eligible for FHA 203K. Buyer to verify all info. Equal Housing Opportunity. Finance Terms: Cash, FHA, and Conventional
-
2021-03-11$140,000 Active 559-char remark
Show marketing remark (559 chars)
BACK ON THE MARKET!!! THIS THREE FAMILY HOME HAS HAS A TOTAL OF FIVE BEDROOMS AND THREE BATHROOMS WITH OVER 2700 SQ FT OF LIVING SPACE. INDIVIDUAL PORCHES FOR EACH UNIT AND FULL BASEMENT FOR ADDED STORAGE. LOCATED CLOSE TO SHOPPING AND RESTURANTS. HUD Home. Sold “AS IS” by electronic bid only. Property Available 04-23-2021. Bids due by 04-27-2021 11:59 PM Central Time then daily until sold. FHA Case #061-341110. Uninsurable. Eligible for FHA 203K. Buyer to verify all info. Equal Housing Opportunity. Finance Terms: Cash, FHA, and Conventional
-
2015-12-15historical
-
2014-09-06$79,900
-
2014-09-05historical
-
2014-01-12$99,900
-
2009-02-17soldstatus $220,000
-
2007-11-15soldstatus $142,000
-
2007-07-16$149,900
-
2007-05-07soldstatus $161,000
-
2006-12-19historical
-
2006-09-19$279,900
-
2006-07-07soldstatus $179,900
-
2006-04-20historical
-
2006-02-20$229,900
-
2006-01-30soldstatus $203,000
-
2005-10-15$179,900
-
2005-03-01soldstatus $91,000
-
2005-01-09$81,900
-
2003-08-11soldstatus $134,000
-
2001-12-28soldstatus $54,000
-
1999-12-02soldstatus $110,000
-
1988-02-03soldstatus $165,000
ⓘ Source: listings_history table (triggers on properties + properties_extension) + one-shot
backfill from property_details.listing_events for pre-trigger history.
Tax reassessment forecast CT · Partial reset (capped growth)
- Current annual tax
- $6,911 · $576/mo
- Projected year-2 tax
- $8,376 · $698/mo
- Expected delta
- +$1,465/yr (+$122/mo · 21.2%)
ⓘ Screening estimate from a state-policy table — verify with the county assessor before closing.
Climate risk First Street
- Flood 1/10 Low FEMA zone X (unshaded) · 0% chance over 30 yrs
- Wildfire 1/10 Low
- Heat 5/10 Major 7 d/yr ≥97°F today · 15 d/yr by 30 yrs out
- Wind 6/10 Major 27% chance of damaging wind over 30 yrs
- Air quality 3/10 Moderate 2 unhealthy d/yr today · 3 by 30 yrs out
Nearby sold comps map
Loading sold comps map…
Walkable amenities ~0.75 mi
Loading nearby amenities…
Taxation est. · year 1
- Rental income
- $81,972
- − Mortgage interest
- −$25,762
- − Property taxes
- −$6,911
- − Insurance
- −$2,300
- − Repairs & maintenance
- −$6,558
- − Management
- −$6,558
- − Depreciation
- −$13,379
- Taxable income
- $20,506
- Est. tax owed @ 24.0%
- −$4,921
- After-tax cash flow
- $21,685/yr
For passive investors: Depreciation is non-cash, so a rental often shows a tax loss while cash-flowing — sheltering income. Rental losses are passive: they offset passive income freely, and up to $25,000/yr can offset ordinary (W-2) income if you actively participate and your MAGI is under $100k (phasing out to $0 by $150k); unused losses carry forward. On sale, claimed depreciation is recaptured at up to 25%, and gains may owe capital-gains tax (a 1031 exchange can defer both). Figures are a year-1 estimate at your 24.0% rate — not tax advice; consult a CPA.
Schools (NCES district)
- District
- New Britain School District
- NCES district ID
- 0902670
- Math proficiency
- 6% ▼ -6.00%
- Reading proficiency
- 17% ▼ -5.00%
- Median HH income
- $40,827
- Composite
- 9.95/100
- National rank
- #9816
- State rank
- #153 of 153 in CT
Livability — New Britain
- Score
- 74/100
- State rank
- #67
- US rank
- #4936
Category grades
Schools grade is shown separately in the Schools card above.
Census & demographics
- Census place
- New Britain, CT
- County
- Hartford County · 754,208 people
- City population
- 66,322
- Metro
- Hartford-East Hartford-Middletown, CT
- Population (ZIP)
- 29,548
- Household income
- $51,022
- Rent vs Own
- Severe rent burden
- 2100.0
Population outlook (Capitol County) Hauer SSP2
- By 2040
- 1,063,519
Race, ethnicity, and origin ACS 2023
- Neighborhood character
- Diverse neighborhood (Simpson 0.63)
- Race & ethnicity
- Hispanic / Latino 52% White 30% Two or more races 17% Black 11% Asian 2%
- Hispanic origin (detail)
- Mexican 2% Puerto Rican 40% Dominican 4%
- Common ancestry
- Romanian 7% Lithuanian 6% Slovak 1%
- Foreign-born
- 15% · Canada, Jamaica
- Languages at home
- 51% English-only · Spanish 39% Russian/Polish/Slavic 6% Arabic 3%
Political lean MEDSL · Capitol
- 2024 margin
- Strong D (+21.9) · D 60.1% · R 38.2% · Other 1.7%
- All cycles
- 2024: D+21.9
Not yet ingested
- Civics
- —
Market trends
- HPI YoY
- ▲ 31.52%
- Current HPI
- 382.7816
- Rent YoY
- ▼ -0.58%
- Metro
- Hartford-East Hartford-Middletown, CT
- State GDP YoY
- ▲ 1.06%
- F500 in state
- 38
Industry mix (Fortune 500 HQ in CT)
| Industry | F500 HQs | Revenue |
|---|---|---|
| Industrial Machinery | 4 | $38B |
|
||
| Insurance | 3 | $71B |
|
||
| Financial Services | 2 | $25B |
|
||
| Transportation / Logistics | 2 | $18B |
|
||
| Healthcare | 1 | $247B |
|
||
| Telecommunications | 1 | $55B |
|
||
Price history
+178.7% since first listed29 events — show timeline
- 2026-04-25 Pending — Smart MLS
- 2026-02-11 Listed $459,900 Smart MLS
- 2026-02-10 Listing Removed — Smart MLS
- 2025-10-27 Relisted — Smart MLS
- 2025-10-27 Pending — Smart MLS
- 2025-10-07 Listed $460,000 Smart MLS
- 2021-05-28 Sold (MLS) $152,000 Smart MLS
- 2021-03-11 Listed $140,000 Smart MLS
- 2015-12-15 Listing Removed — Smart MLS
- 2014-09-06 Listed $79,900 Smart MLS
- 2014-09-05 Listing Removed — Smart MLS
- 2014-01-12 Listed $99,900 Smart MLS
- 2009-02-17 Sold (Public Records) $220,000 Public Records
- 2007-11-15 Sold (MLS) $142,000 Smart MLS
- 2007-07-16 Listed $149,900 Smart MLS
- 2007-05-07 Sold (Public Records) $161,000 Public Records
- 2006-12-19 Listing Removed — Smart MLS
- 2006-09-19 Listed $279,900 Smart MLS
- 2006-07-07 Sold (MLS) $179,900 Smart MLS
- 2006-04-20 Listing Removed — Smart MLS
- 2006-02-20 Listed $229,900 Smart MLS
- 2006-01-30 Sold (Public Records) $203,000 Public Records
- 2005-10-15 Listed $179,900 Smart MLS
- 2005-03-01 Sold (MLS) $91,000 Smart MLS
- 2005-01-09 Listed $81,900 Smart MLS
- 2003-08-11 Sold (Public Records) $134,000 Public Records
- 2001-12-28 Sold (Public Records) $54,000 Public Records
- 1999-12-02 Sold (Public Records) $110,000 Public Records
- 1988-02-03 Sold (Public Records) $165,000 Public Records
Property tax history
+3.8%/yrLatest (2025): $6,911 · -1.0% YoY. Source: county tax records.
Cash-flow waterfall
monthlySold comps — $/sqft
last 12 mo · ≤1 miLoading sold comps…