7014 Zepher Rd · Fayetteville, NC
Flood risk 1/10 · Minimal
- FEMA flood zone
- X (unshaded)
- Chance of flooding over 30 yrs
- 0.0%
- Est. flood insurance / yr
- $507 – $1,088
Fire risk 5/10 · Moderate
- Est. fire insurance / yr
- $906 – $1,684
Heat risk 7/10 · Major
- Hot days now (above 106°F)
- 7 days/yr
- Hot days in 30 yrs
- 16 days/yr
Wind risk 7/10 · Major
- Chance of severe wind over 30 yrs
- 75.0%
Air-quality risk 1/10 · Minimal
- Unhealthy air days now
- 0 days/yr
- Unhealthy air days in 30 yrs
- 0 days/yr
Risk factors via First Street. Map © Google.
Why this score? — see what drove the D grade
The composite is a weighted blend of 9 inputs, each scored 0–100. Each bar is that input's sub-score; the figure is the points it added to the 100-point composite (weight × sub-score).
- Cash flow +14.1/30.0
- ARV discount +7.5/15.0
- DSCR +4.3/10.0
- Livability +3.8/5.0
- Rent growth +3.2/5.0
- 1% rule +3.1/10.0
- Schools +3.1/10.0
- Condition / age +2.5/5.0
- Appreciation +0.0/10.0
$170,000
🖨 Deal sheet (PDF) 📄 Offer letter ✓ Due diligence
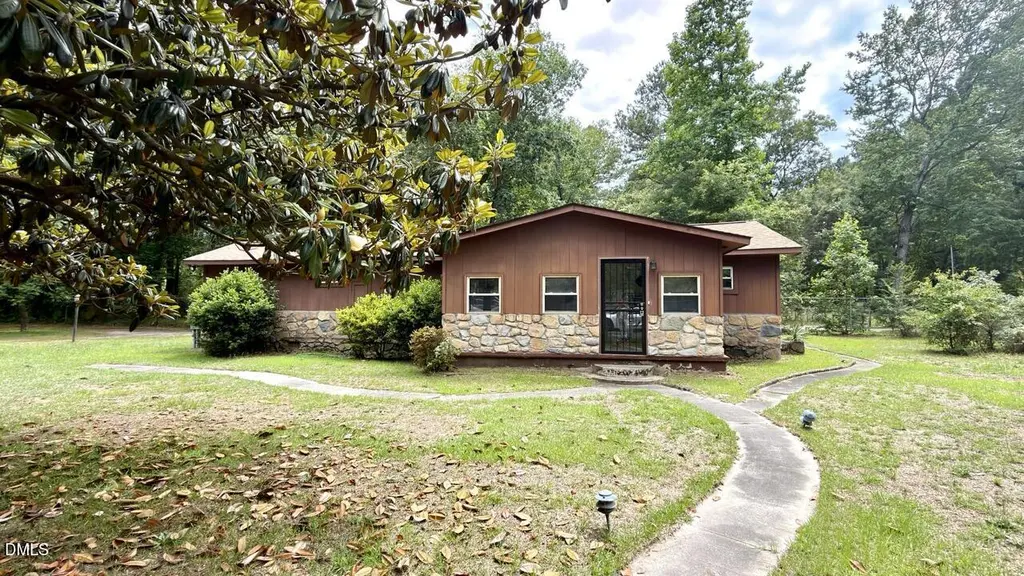
Listing remarks
Discover this three-bedroom, one-bathroom single-family residence nestled in Cedar Falls, Fayetteville, NC. The home sits on an expansive 16,553-square-foot lot, offering generous outdoor space for various pursuits. With two garage stalls included, there's ample room for vehicles and storage needs. This residence provides a solid foundation for those seeking a practical home in the Cedar Falls community. * Manufactured House put on Permanant foundation, and its not with the DMV anymore"
Key facts
- 0.38 acre lot
- Parking
- Built 1980
Property features AI
Finance
- Other: Lot approximately 0.38 acre; Zoning: SF6
- HOA & community: No association
Exterior
- Parking: 1 covered carport space; Driveway parking
- Utilities: Public water; Public sewer
- Home design: Manufactured home; One level; Raised foundation; No shared/common walls
- Construction: Built with stone, vertical siding, vinyl siding, and wood siding; Shingle roof
- Exterior features: Enclosed patio/porch; Outdoor barbecue/grill
Interior
- Kitchen: Free‑standing gas range; Range hood; Microwave; Refrigerator
- Bedrooms: 3 bedrooms total; 1 bedroom on the main level
- Flooring: Carpet; Vinyl; Wood
- Bathrooms: 1 full bathroom; 1 half bathroom
- Heating & cooling: Central heating (electric and propane); Central air conditioning; Ceiling fans for cooling
- Interior features: Beamed ceilings; Ceiling fans; Crown molding; Laminate countertops; Fireplace; Storm door(s)
- Laundry & utility: Washer and dryer included; Washer hookup inside; Laundry located inside (in bathroom)
Neighborhood map
What this means for you Summary
Snapshot
- This is a 3-bed/1.0-bath manufactured listed at $170k.
Deal economics
- At list price, monthly cash flow is $26 ($309/yr) — positive.
- The deal already cash-flows at list — no discount required.
- To meet the 1% rule (rent ≥ 1% of price), the offer needs to be $137k (19.3% below list).
- Recommended offer: $137k (19.3% below list) — sets the bar for 1% rule.
- Cap rate 6.5% vs local median 4.8% in Fayetteville — top-decile yield for the area; either an underpriced asset or a hidden risk that comps aren't pricing in. Stress-test before assuming the spread holds.
Location & tenants
- Location reads 75/100 on livability (#45 in NC, #4,031 nationally) — a middle-class / working-renter tenant base. Strengths: commute A+, cost of living A+, housing A+; Watch: crime F, employment D-.
- Cumberland County Schools (urban): math 32% / reading 41% proficiency, ranked #126 of 178 in NC (top 71%) — families likely to look elsewhere, expect single-tenant / working-renter base with shorter leases.
- Zoned schools: Long Hill Elementary (math 52% / reading 53%, grade C-, #349 of 1,410 statewide, top 25%, 442 students, 99% FRL); Pine Forest Middle (math 38% / reading 49%, grade D, #182 of 475 statewide, top 40%, 738 students, 56% FRL); Pine Forest High (math 73% / reading 51%, grade B-, #184 of 535 statewide, top 37%, 1,572 students, 62% FRL) — zoned schools average 73% FRL vs 55% district-wide (18 pts higher); higher-poverty schools than district average — tighter screening recommended.
- Zoned-school proficiency averages 53% at this address vs 36% district-wide (+16 pts) — the actual schools serving this property are materially stronger than the Cumberland County Schools average implies; a family-tenant draw the district grade alone would hide.
- Market conditions: Rents rising (+2.8%/yr); 363 active listings in the ZIP; 17 comparable units currently listed for rent nearby; rentals at typical pace (median 23d on market — plan ~3-4 weeks tenant-placement turnaround); 1,125 units permitted in Cumberland County in 2024 (104 in 5+ unit buildings).
Forward outlook
- Local home prices are declining (-3.0%/yr); year-one equity from $1k of loan paydown is wiped out by about $5k of value loss. Plan a longer hold.
Negotiation context
- It's been on market 17 days — a 2% lower offer ($167k) is reasonable based on typical stale-listing flexibility.
Risks & watch-outs
- Climate carrying-cost: major wind risk, 75% chance of damaging wind over 30y; moderate wildfire risk; extreme-heat days projected 7→16/yr by 2055 (HVAC capex compounding) — expect insurance premiums to compound above CPI over the hold.
Questions for the listing agent
- Is there a deadline driving the sale (1031 exchange, divorce, estate, relocation)? That informs how much negotiation room exists.
- Crime grade is F in this area — have there been break-ins, vandalism, or insurance claims at this property in the last 3 years? What carrier currently insures it and at what premium?
- The area grade is low — what's the realistic commute time and amenity access for the typical tenant pool here? Any planned neighborhood developments (good or bad) we should know about?
- What's the average days-on-market for RENTAL listings here right now (not sales)? A rising rental-DOM trend means longer vacancies and softer asking-rent achievability than the comps imply.
- What's the recent tenant-quality profile in this submarket — average credit score on applications, eviction rate, late-payment / NSF rate, and stable-employment percentage? A property-management company in the area should have these aggregated.
- How much new for-sale + rental construction is in the pipeline within 1–3 miles? Heavy new supply typically softens prices + rents 12–24 months out; constrained supply supports both.
Investment metrics
- 1% rule
- 0.81% ✗
- Cap rate
- 6.47%
- Cash-on-cash
- 0.65%
- DSCR
- 1.03
- GRM
- 10.3
CMA / ARV
- ARV (on-the-fly)
- $89,076
- Comps found
- 1
Show comp detail 1 sale within ~0.75 mi
| Address | Dist | Beds/Ba | Sqft | Sold | Price | $/sf | Match |
|---|---|---|---|---|---|---|---|
| 368 Kitimat Ct | 0.27mi | 3/2.0 | 1,288 (+13%) | 1mo | $100,000 | $78 | 61 |
Match score weights: distance 35% · size 25% · config 20% · recency 20%. Top-matched comps best support the ARV.
Projected returns pro-forma
-3.0% appreciation · 2.82% rent growth · sell at horizon
- IRR
- -15.5%
- Equity multiple
- 0.45×
- Total profit
- $-26,205
- Equity at exit
- $25,348
- IRR
- -7.3%
- Equity multiple
- 0.54×
- Total profit
- $-21,927
- Equity at exit
- $14,698
Cash invested: $47,600 (down + closing). Projections, not guarantees.
Landlord ↔ Tenant lean methodology
- Overall (STATE)
- 85 Strongly Landlord-Friendly
- State North Carolina
- 85 Strongly Landlord-Friendly · R+3
- County
- — inherits STATE
- City
- — inherits STATE
ZIP-level market 28311
- Home prices YoY
- -18.4%
- Rents YoY
- 2.8%
- Active inventory
- 363
- Price-to-rent
- 10.3×
Monthly cashflow live
- Estimated rent
- $1,372 high interval (Pro) →
- Mortgage (P&I)
- −$891
- Tax from tax record
- −$96 /mo · $1,154/yr
- Insurance
- −$71
- HOA
- −$0
- Vacancy / Maint / Mgmt
- −$288
- Net cashflow
- $26
Break-even live
Sensitivity live
| Price | -10% $122 | -5% $74 | +0% $26 | +5% $-22 | +10% $-70 |
|---|---|---|---|---|---|
| Rent | -10% $-83 | -5% $-28 | +0% $26 | +5% $80 | +10% $134 |
| Rate | -1.0pp $111 | -0.5pp $69 | base $26 | +0.5pp $-18 | +1.0pp $-63 |
UW: 25.0% down · 7.5% · 30yr · 1.5% tax · 5.0% vac · 8.0% maint · 8.0% mgmt
Financing live
Cash to close
- Down payment
- $42,500
- Closing costs
- $5,100
- Reserves months
- —
- Total cash needed
- —
Loan-product check · same deal, 3 products live
Conventional
25% down · 7.5% · 30yr
- Down + closing
- —
- Monthly P&I
- —
- Monthly cashflow
- —
- DSCR
- —
- Eligible?
- —
Personal DTI + credit; lowest rate.
DSCR
20% down · 8.5% · 30yr
- Down + closing
- —
- Monthly P&I
- —
- Monthly cashflow
- —
- DSCR
- —
- Eligible?
- —
No personal income docs; deal must DSCR.
Hard money
10% down · 12.0% · 12mo
- Down + closing
- —
- Monthly P&I
- —
- Monthly cashflow
- —
- DSCR
- —
- Eligible?
- —
Short-term bridge; refi at stabilization.
Rent comps 17 comps
| Address | Beds | Baths | Sqft | Rent | $/sqft | DOM | Units | Dist |
|---|---|---|---|---|---|---|---|---|
| 6230 Abbotts Park Dr Fayetteville, NC | 1.0–2.0 | 1.0–2.0 | 792 | $1,295 | $1.63 | 15d | 13 | 0.14mi |
| 103 Homeplace Ct Fayetteville, NC | 2.0 | 2.0 | 1000 | $1,300 | $1.30 | 23d | 1 | 0.69mi |
| 6707 Water Trail Dr Fayetteville, NC | 1.0–3.0 | 1.0–2.0 | 850 | $1,350 | $1.59 | 15d | 8 | 0.70mi |
| 118 Girard Ave #118 Fayetteville, NC | 2.0 | 2.0 | 1000 | $1,200 | $1.20 | 15d | 1 | 0.74mi |
| 130 Girard Ave Fayetteville, NC | 2.0 | 2.0 | 1050 | $1,100 | $1.05 | 25d | 1 | 0.77mi |
| 152 Homeplace Ct Fayetteville, NC | 2.0 | 2.0 | 901 | $999 | $1.11 | 15d | 1 | 0.77mi |
| 154 Homeplace Ct Fayetteville, NC | 2.0 | 2.0 | 901 | $1,025 | $1.14 | 15d | 1 | 0.78mi |
| 5716 5 Sisters Ct Fayetteville, NC | 2.0 | 2.0 | 800 | $1,000 | $1.25 | 15d | 1 | 0.82mi |
| 499 Coronation Dr Fayetteville, NC | 2.0 | 2.0 | 1100 | $1,390 | $1.26 | 25d | 1 | 0.89mi |
| 187 Aloha Dr Fayetteville, NC | 2.0 | 2.0 | 1301 | $1,395 | $1.07 | 25d | 1 | 1.07mi |
| 330 Bubble Creek Ct Fayetteville, NC | 3.0 | 2.0 | 1401 | $1,600 | $1.14 | 25d | 1 | 1.32mi |
| 206 Villa Dr Fayetteville, NC | 2.0 | 2.0 | 988 | $1,250 | $1.27 | 25d | 1 | 1.35mi |
| 226 Tallstone Dr Fayetteville, NC | 1.0–2.0 | 1.0–2.0 | 920 | $1,339 | $1.46 | 15d | 16 | 1.36mi |
| 342 Bubble Creek Ct #1 Fayetteville, NC | 2.0 | 2.0 | 1300 | $1,350 | $1.04 | 15d | 1 | 1.36mi |
| 380 Bubble Creek Ct #8 Fayetteville, NC | 3.0 | 2.0 | 1477 | $1,300 | $0.88 | 25d | 1 | 1.37mi |
| 362 Bubble Creek Ct Fayetteville, NC | 2.0 | 2.0 | 1254 | $1,250 | $1.00 | 25d | 1 | 1.40mi |
| 5418 Hampton Rd Fayetteville, NC | 3.0 | 2.0 | 1400 | $1,550 | $1.11 | 25d | 1 | 1.41mi |
Listing history 14 events
-
2026-06-21days on market $170,000 Active 17 DOM
-
2026-06-18days on market $170,000 Active 14 DOM
-
2026-06-17days on market $170,000 Active 13 DOM
-
2026-06-16days on market $170,000 Active 12 DOM
-
2026-06-16price $170,000 Active 11 DOM
-
2026-06-15days on market $180,000 Active 11 DOM
-
2026-06-14days on market $180,000 Active 9 DOM
-
2026-06-13remarks 491-char remark
-
2026-06-13days on market $180,000 Active 8 DOM
-
2026-06-10days on market $180,000 Active 6 DOM
-
2026-06-09days on market $180,000 Active 5 DOM
-
2026-06-08days on market $180,000 Active 4 DOM
-
2026-06-07remarks 407-char remark
-
2026-06-07$180,000 Active 3 DOM
ⓘ Source: listings_history table (triggers on properties + properties_extension) + one-shot
backfill from property_details.listing_events for pre-trigger history.
Tax reassessment forecast NC · Resets to sale price
- Current annual tax
- $1,154 · $96/mo
- Projected year-2 tax
- $1,394 · $116/mo
- Expected delta
- +$240/yr (+$20/mo · 20.8%)
ⓘ Screening estimate from a state-policy table — verify with the county assessor before closing.
Climate risk First Street
- Flood 1/10 Low FEMA zone X (unshaded) · 0% chance over 30 yrs
- Wildfire 5/10 Major
- Heat 7/10 Severe 7 d/yr ≥106°F today · 16 d/yr by 30 yrs out
- Wind 7/10 Severe 75% chance of damaging wind over 30 yrs
- Air quality 1/10 Low 0 unhealthy d/yr today · 0 by 30 yrs out
Nearby sold comps map
Loading sold comps map…
Walkable amenities ~0.75 mi
Loading nearby amenities…
Taxation est. · year 1
- Rental income
- $16,470
- − Mortgage interest
- −$9,523
- − Property taxes
- −$1,154
- − Insurance
- −$850
- − Repairs & maintenance
- −$1,318
- − Management
- −$1,318
- − Depreciation
- −$4,945
- Taxable loss
- −$2,638
- Est. tax savings @ 24.0%
- +$633
- After-tax cash flow
- $942/yr
For passive investors: Depreciation is non-cash, so a rental often shows a tax loss while cash-flowing — sheltering income. Rental losses are passive: they offset passive income freely, and up to $25,000/yr can offset ordinary (W-2) income if you actively participate and your MAGI is under $100k (phasing out to $0 by $150k); unused losses carry forward. On sale, claimed depreciation is recaptured at up to 25%, and gains may owe capital-gains tax (a 1031 exchange can defer both). Figures are a year-1 estimate at your 24.0% rate — not tax advice; consult a CPA.
Schools (NCES district)
- District
- Cumberland County Schools
- NCES district ID
- 3700011
- Math proficiency
- 32% ▼ -2.00%
- Reading proficiency
- 41% ▼ -1.00%
- Median HH income
- $44,168
- Composite
- 31.0/100
- National rank
- #6096
- State rank
- #126 of 178 in NC
Livability — Fayetteville
- Score
- 75/100
- State rank
- #45
- US rank
- #4031
Category grades
Schools grade is shown separately in the Schools card above.
Census & demographics
- Census place
- Fayetteville, NC
- County
- Cumberland County · 265,314 people
- City population
- 226,118
- Metro
- Fayetteville, NC
- Population (ZIP)
- 36,629
- Household income
- $62,170
- Rent vs Own
- Severe rent burden
- 1645.0
Population outlook (Cumberland County) Hauer SSP2
- Today (2025)
- 330,855 people
- By 2030
- 333,523 · +0.8%
- By 2040
- 335,583 · +1.4%
- By 2050
- 335,325 · +1.4%
- By 2075
- 342,853 · +3.6%
- By 2100
- 340,698 · +3.0%
Race, ethnicity, and origin ACS 2023
- Neighborhood character
- Diverse neighborhood (Simpson 0.67)
- Race & ethnicity
- Black 42% White 38% Hispanic / Latino 9% Two or more races 8% Asian 3% Native American 1%
- Hispanic origin (detail)
- Mexican 3% Puerto Rican 4%
- Common ancestry
- Slovak 1% Lithuanian 1% Italian 1%
- Foreign-born
- 7% · Canada, South Korea, Jamaica
- Languages at home
- 89% English-only · Spanish 6% German/W. Germanic 1% Other Indo-European 1%
Political lean MEDSL · Cumberland
- 2024 margin
- D (+13.4) · D 56.1% · R 42.7% · Other 1.2%
- 2008→2024 swing
- -4.3pp toward R · 2008: 17.7pp · 2024: 13.4pp
- All cycles
- 2024: D+13.4 2020: D+16.6 2016: D+16.0 2012: D+19.7 2008: D+17.7
Not yet ingested
- Civics
- —
Market trends
- HPI YoY
- ▼ -45.88%
- Current HPI
- 203.0731
- Rent YoY
- ▲ 2.82%
- Metro
- Fayetteville, NC
- State GDP YoY
- ▲ 3.28%
- F500 in state
- 26
Industry mix (Fortune 500 HQ in NC)
| Industry | F500 HQs | Revenue |
|---|---|---|
| Financial Services | 2 | $213B |
|
||
| Retail | 2 | $95B |
|
||
| Industrial Conglomerate | 1 | $38B |
|
||
| Metals / Steel | 1 | $35B |
|
||
| Utilities | 1 | $30B |
|
||
| Industrial Machinery | 1 | $19B |
|
||
Price history
1 event — show timeline
- 2026-06-03 Listed $180,000 TMLS
Property tax history
+5.4%/yrLatest (2025): $1,154 · +18.4% YoY. Source: county tax records.
Cash-flow waterfall
monthlySold comps — $/sqft
last 12 mo · ≤1 miLoading sold comps…