2540 Houston Cir · Midway, FL
Flood risk 1/10 · Minimal
- FEMA flood zone
- X (unshaded)
- Chance of flooding over 30 yrs
- 0.0%
- Est. flood insurance / yr
- $507 – $1,088
Fire risk 6/10 · Moderate
- Est. fire insurance / yr
- $947 – $1,759
Heat risk 10/10 · Severe
- Hot days now (above 105°F)
- 7 days/yr
- Hot days in 30 yrs
- 24 days/yr
Wind risk 9/10 · Severe
- Chance of severe wind over 30 yrs
- 99.0%
Air-quality risk 2/10 · Minimal
- Unhealthy air days now
- 1 days/yr
- Unhealthy air days in 30 yrs
- 1 days/yr
Risk factors via First Street. Map © Google.
Why this score? — see what drove the D grade
The composite is a weighted blend of 9 inputs, each scored 0–100. Each bar is that input's sub-score; the figure is the points it added to the 100-point composite (weight × sub-score).
- Cash flow +12.9/30.0
- ARV discount +10.8/15.0
- Schools +5.3/10.0
- DSCR +3.9/10.0
- Rent growth +3.7/5.0
- 1% rule +2.8/10.0
- Livability +2.5/5.0
- Condition / age +2.5/5.0
- Appreciation +0.0/10.0
$319,000
🖨 Deal sheet (PDF) 📄 Offer letter ✓ Due diligence
Listing remarks
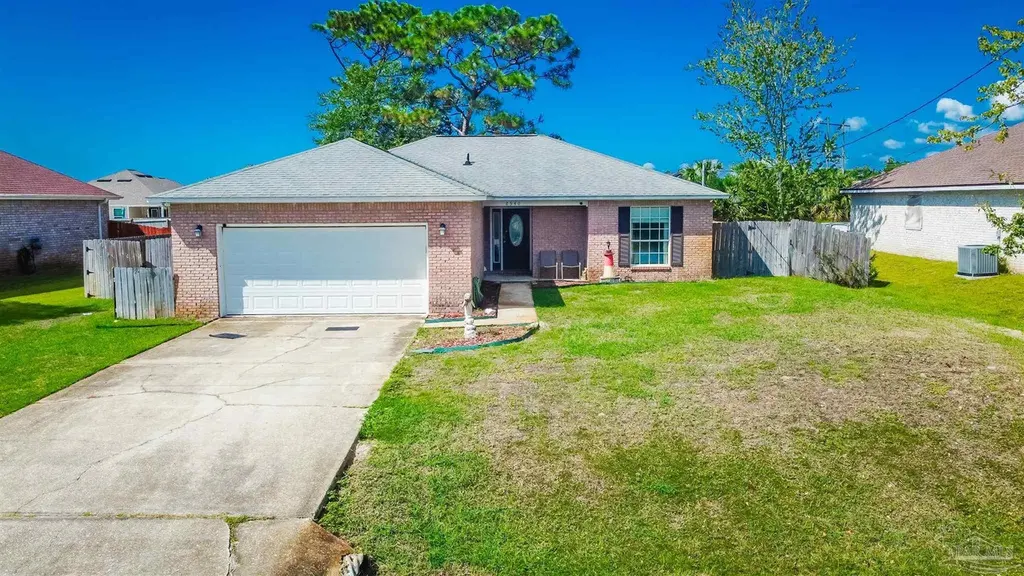
Welcome to this charming 4-sided brick ranch home, featuring 3 bedrooms and 2 bathrooms, situated in the largest neighborhood in the area. You'll love having access to the incredible Holley By the Sea multi-million dollar recreation center, along with the nearby boat launch on East Bay. This prime location puts you just minutes away from beautiful beaches, shopping centers, new emergency rooms, Gulf Breeze Zoo, military bases, schools, and more! This well maintained single-family ranch features a large living room. Enjoy the comfort of central heating, air conditioning, and ceiling fans. Fenced private back yard. The 2-car garage offers convenient parking. This home is perfectly balances co
Key facts
- 4 sided brick
- Private back yard
- New roof
Tags
Neighborhood map
What this means for you Summary
Snapshot
- This is a 3-bed/2.0-bath single-family listed at $319k.
Deal economics
- At list price, monthly cash flow is $-23 ($-277/yr) — negative.
- To cash-flow at today's rent, offer at most $315k (1.3% below list).
- To meet the 1% rule (rent ≥ 1% of price), the offer needs to be $250k (21.6% below list).
- Recommended offer: $250k (21.6% below list) — sets the bar for 1% rule.
- Cap rate 6.2% vs local median 4.1% in Midway — top-decile yield for the area; either an underpriced asset or a hidden risk that comps aren't pricing in. Stress-test before assuming the spread holds.
Location & tenants
- Location reads: area grade D — affects rentability + tenant quality, not the cash-flow math above.
- Santa Rosa (suburban): math 63% / reading 60% proficiency, ranked #8 of 73 in FL (top 11%) — acceptable for families but not a draw, mixed tenant base, ~2y average lease.
- Zoned schools: West Navarre Intermediate School (math 70% / reading 70%, grade A-, #345 of 2,144 statewide, top 17%, 813 students, 37% FRL); Woodlawn Beach Middle School (math 68% / reading 60%, grade B+, #105 of 571 statewide, top 19%, 948 students, 34% FRL); Navarre High School (math 49% / reading 58%, grade C-, #146 of 667 statewide, top 22%, 2,406 students, 30% FRL) — zoned schools at 34% FRL track the district average.
- Market conditions: Rents rising fast (+4.6%/yr); 455 active listings in the ZIP; 4 comparable units currently listed for rent nearby; rentals at typical pace (median 26d on market — plan ~3-4 weeks tenant-placement turnaround); solid renter incomes; 1,983 units permitted in Santa Rosa County in 2024 (128 in 5+ unit buildings).
Forward outlook
- Local home prices are declining (-3.0%/yr); year-one equity from $2k of loan paydown is wiped out by about $10k of value loss. Plan a longer hold.
- Santa Rosa County population projected at +31% by 2050 — long-run rental-demand tailwind backs the buy-and-hold thesis.
Negotiation context
- It's been on market 63 days — a 6% lower offer ($300k) is reasonable based on typical stale-listing flexibility.
- 4 sale attempts since 8y ago with the ask held roughly flat each time — persistent listings suggest the price (not the market) is what's stuck; bring a comps-based counter.
- Current owner paid $188k; list at $319k implies a 70% gain — meaningful room to come down on a strong offer.
Risks & watch-outs
- Climate carrying-cost: severe wind risk, 99% chance of damaging wind over 30y; major wildfire risk; extreme-heat days projected 7→24/yr by 2055 (HVAC capex compounding) — expect insurance premiums to compound above CPI over the hold.
Questions for the listing agent
- What do current leases actually rent for vs. the listed asking? Can we see a recent rent roll and the last 12 months of T-12 income?
- It's been on market 63 days. Have you received any prior offers? Is the seller open to a 22% concession, seller financing, or rate buy-down credit?
- What does the HOA fee cover, when was the last increase, and are there any pending special assessments or reserve-fund shortfalls?
- Why hasn't it sold? Are there any deal-killer items the seller is aware of (foundation, flood, title, zoning, code violations)?
- Is there a deadline driving the sale (1031 exchange, divorce, estate, relocation)? That informs how much negotiation room exists.
- The area grade is low — what's the realistic commute time and amenity access for the typical tenant pool here? Any planned neighborhood developments (good or bad) we should know about?
- What's the average days-on-market for RENTAL listings here right now (not sales)? A rising rental-DOM trend means longer vacancies and softer asking-rent achievability than the comps imply.
- What's the recent tenant-quality profile in this submarket — average credit score on applications, eviction rate, late-payment / NSF rate, and stable-employment percentage? A property-management company in the area should have these aggregated.
- How much new for-sale + rental construction is in the pipeline within 1–3 miles? Heavy new supply typically softens prices + rents 12–24 months out; constrained supply supports both.
Investment metrics
- 1% rule
- 0.78% ✗
- Cap rate
- 6.21%
- Cash-on-cash
- -0.31%
- DSCR
- 0.99
- GRM
- 10.6
CMA / ARV
- ARV (on-the-fly)
- $344,386
- Comps found
- 12
Show comp detail 12 sales within ~0.75 mi
| Address | Dist | Beds/Ba | Sqft | Sold | Price | $/sf | Match |
|---|---|---|---|---|---|---|---|
| 2452 Spur Ln | 0.13mi | 3/2.0 | 1,475 (+2%) | 1mo | $350,000 | $237 | 90 |
| 6307 Red Pepper Dr | 0.30mi | 3/2.0 | 1,475 (+2%) | 4mo | $350,000 | $237 | 79 |
| 6318 Red Pepper Dr | 0.28mi | 3/2.0 | 1,473 (+2%) | 6mo | $353,900 | $240 | 79 |
| 6340 Arbor Ln | 0.15mi | 3/2.0 | 1,318 (-9%) | 1mo | $315,000 | $239 | 78 |
| 2494 Privet Berry Dr | 0.36mi | 3/2.0 | 1,473 (+2%) | 4mo | $322,577 | $219 | 77 |
| 2485 Privet Berry Dr | 0.40mi | 3/2.0 | 1,473 (+2%) | 3mo | $313,900 | $213 | 76 |
| 2392 Spur Ln | 0.07mi | 3/2.0 | 1,309 (-10%) | 7mo | $329,500 | $252 | 75 |
| 2477 Privet Berry Dr | 0.40mi | 3/2.0 | 1,473 (+2%) | 8mo | $364,984 | $248 | 72 |
| 6545 Fern St | 0.43mi | 3/2.0 | 1,367 (-6%) | 2mo | $320,000 | $234 | 69 |
| 6138 Redberry Dr | 0.72mi | 3/2.0 | 1,473 (+2%) | 7mo | $349,900 | $238 | 57 |
| 2498 Privet Berry Dr | 0.36mi | 3/2.0 | 1,252 (-14%) | 7mo | $312,900 | $250 | 55 |
| 6236 Redberry Dr | 0.39mi | 3/2.0 | 1,253 (-13%) | 10mo | $290,000 | $231 | 52 |
Match score weights: distance 35% · size 25% · config 20% · recency 20%. Top-matched comps best support the ARV.
Projected returns pro-forma
-3.0% appreciation · 4.6% rent growth · sell at horizon
- IRR
- -15.2%
- Equity multiple
- 0.45×
- Total profit
- $-49,164
- Equity at exit
- $47,564
- IRR
- -4.4%
- Equity multiple
- 0.69×
- Total profit
- $-27,734
- Equity at exit
- $27,581
Cash invested: $89,320 (down + closing). Projections, not guarantees.
Landlord ↔ Tenant lean methodology
- Overall (STATE)
- 87 Strongly Landlord-Friendly
- State Florida
- 87 Strongly Landlord-Friendly · R+3
- County
- — inherits STATE
- City
- — inherits STATE
ZIP-level market 32563
- Rents YoY
- 4.6%
- Active inventory
- 455
- Price-to-rent
- 10.6×
Monthly cashflow live
- Estimated rent
- $2,500 medium interval (Pro) →
- Mortgage (P&I)
- −$1,673
- Tax from tax record
- −$146 /mo · $1,755/yr
- Insurance
- −$133
- HOA
- −$46
- Vacancy / Maint / Mgmt
- −$525
- Net cashflow
- $-23
Break-even live
Sensitivity live
| Price | -10% $157 | -5% $67 | +0% $-23 | +5% $-113 | +10% $-204 |
|---|---|---|---|---|---|
| Rent | -10% $-221 | -5% $-122 | +0% $-23 | +5% $76 | +10% $174 |
| Rate | -1.0pp $138 | -0.5pp $58 | base $-23 | +0.5pp $-106 | +1.0pp $-190 |
UW: 25.0% down · 7.5% · 30yr · 1.5% tax · 5.0% vac · 8.0% maint · 8.0% mgmt
Financing live
Cash to close
- Down payment
- $79,750
- Closing costs
- $9,570
- Reserves months
- —
- Total cash needed
- —
Loan-product check · same deal, 3 products live
Conventional
25% down · 7.5% · 30yr
- Down + closing
- —
- Monthly P&I
- —
- Monthly cashflow
- —
- DSCR
- —
- Eligible?
- —
Personal DTI + credit; lowest rate.
DSCR
20% down · 8.5% · 30yr
- Down + closing
- —
- Monthly P&I
- —
- Monthly cashflow
- —
- DSCR
- —
- Eligible?
- —
No personal income docs; deal must DSCR.
Hard money
10% down · 12.0% · 12mo
- Down + closing
- —
- Monthly P&I
- —
- Monthly cashflow
- —
- DSCR
- —
- Eligible?
- —
Short-term bridge; refi at stabilization.
Rent comps 4 comps
| Address | Beds | Baths | Sqft | Rent | $/sqft | DOM | Units | Dist |
|---|---|---|---|---|---|---|---|---|
| 2426 Houston Cir Gulf Breeze, FL | 3.0 | 2.0 | 1474 | $2,500 | $1.70 | 25d | 1 | 0.22mi |
| 6539 Forest Bay Ave Gulf Breeze, FL | 4.0 | 2.0 | 1786 | $2,850 | $1.60 | 16d | 1 | 0.47mi |
| 6622 Perch St Navarre, FL | 3.0 | 2.0 | 1563 | $2,100 | $1.34 | 25d | 1 | 1.33mi |
| 1827 Sundown Dr Navarre, FL | 3.0 | 2.0 | 1556 | $2,000 | $1.29 | 25d | 1 | 1.50mi |
HOA detail
- Monthly dues
- $46 · $552/yr
Listing history 20 events
-
2026-06-05status $319,000 Pending 63 DOM
-
2026-06-03days on market $319,000 Contingent 63 DOM
-
2026-06-02days on market $319,000 Contingent 62 DOM
-
2026-06-01days on market $319,000 Contingent 61 DOM
-
2026-05-31days on market $319,000 Contingent 60 DOM
-
2026-05-31days on market $319,000 Contingent 59 DOM
-
2026-04-14historical Contingent
-
2026-04-14status Pending
-
2026-04-01$319,000 Active
-
2025-05-02historical
-
2025-02-14$329,000 Active
-
2024-11-09historical
-
2024-10-04$339,000 Active
-
2018-12-17soldstatus $187,900
-
2018-12-13soldstatus $187,900
-
2018-12-13soldstatus $187,900
-
2018-10-26$189,900
-
2009-12-02soldstatus $151,000
-
2005-01-24soldstatus $132,000
-
1993-10-01soldstatus $2,115,700
ⓘ Source: listings_history table (triggers on properties + properties_extension) + one-shot
backfill from property_details.listing_events for pre-trigger history.
Tax reassessment forecast FL · Resets to sale price
- Current annual tax
- $1,755 · $146/mo
- Projected year-2 tax
- $2,648 · $221/mo
- Expected delta
- +$893/yr (+$74/mo · 50.9%)
ⓘ Screening estimate from a state-policy table — verify with the county assessor before closing.
Climate risk First Street
- Flood 1/10 Low FEMA zone X (unshaded) · 0% chance over 30 yrs
- Wildfire 6/10 Major
- Heat 10/10 Extreme 7 d/yr ≥105°F today · 24 d/yr by 30 yrs out
- Wind 9/10 Extreme 99% chance of damaging wind over 30 yrs
- Air quality 2/10 Low 1 unhealthy d/yr today · 1 by 30 yrs out
Nearby sold comps map
Loading sold comps map…
Walkable amenities ~0.75 mi
Loading nearby amenities…
Taxation est. · year 1
- Rental income
- $29,999
- − Mortgage interest
- −$17,869
- − Property taxes
- −$1,755
- − Insurance
- −$1,595
- − Repairs & maintenance
- −$2,400
- − Management
- −$2,400
- − HOA
- −$552
- − Depreciation
- −$9,280
- Taxable loss
- −$5,852
- Est. tax savings @ 24.0%
- +$1,404
- After-tax cash flow
- $1,127/yr
For passive investors: Depreciation is non-cash, so a rental often shows a tax loss while cash-flowing — sheltering income. Rental losses are passive: they offset passive income freely, and up to $25,000/yr can offset ordinary (W-2) income if you actively participate and your MAGI is under $100k (phasing out to $0 by $150k); unused losses carry forward. On sale, claimed depreciation is recaptured at up to 25%, and gains may owe capital-gains tax (a 1031 exchange can defer both). Figures are a year-1 estimate at your 24.0% rate — not tax advice; consult a CPA.
Schools (NCES district)
- District
- Santa Rosa
- NCES district ID
- 1201650
- Math proficiency
- 63% ▼ -6.00%
- Reading proficiency
- 60% ▼ -5.00%
- Median HH income
- $58,161
- Composite
- 53.12/100
- National rank
- #1511
- State rank
- #8 of 73 in FL
Livability — Midway
No livability data for this city. (Only ~50 U.S. cities are tracked.)
Census & demographics
- Census place
- Midway, FL
- County
- Santa Rosa County · 194,764 people
- Metro
- Pensacola-Ferry Pass-Brent, FL
- Population (ZIP)
- 30,364
- Household income
- $100,396
- Rent vs Own
- Severe rent burden
- 397.0
Population outlook (Santa Rosa County) Hauer SSP2
- Today (2025)
- 195,978 people
- By 2030
- 209,782 · +7.0%
- By 2040
- 235,293 · +20.1%
- By 2050
- 256,408 · +30.8%
- By 2075
- 298,074 · +52.1%
- By 2100
- 303,216 · +54.7%
Race, ethnicity, and origin ACS 2023
- Neighborhood character
- Predominantly White (87%)
- Race & ethnicity
- White 87% Two or more races 6% Hispanic / Latino 6% Black 2% Asian 1%
- Hispanic origin (detail)
- Mexican 2%
- Common ancestry
- Italian 5% Slovak 3% Romanian 3%
- Foreign-born
- 4% · Canada
- Languages at home
- 94% English-only · Spanish 3% German/W. Germanic 1% Chinese 1%
Political lean MEDSL · Santa Rosa
- 2024 margin
- Solid R (+51.0) · D 24.1% · R 75.0%
- 2008→2024 swing
- -3.0pp toward R · 2008: -47.9pp · 2024: -51.0pp
- All cycles
- 2024: R+51.0 2020: R+46.5 2016: R+53.5 2012: R+52.6 2008: R+47.9
Not yet ingested
- Civics
- —
Market trends
- HPI YoY
- ▼ -229.78%
- Current HPI
- 278.9852
- Rent YoY
- ▲ 4.60%
- Metro
- Pensacola-Ferry Pass-Brent, FL
- State GDP YoY
- ▲ 3.28%
- F500 in state
- 36
Industry mix (Fortune 500 HQ in FL)
| Industry | F500 HQs | Revenue |
|---|---|---|
| Industrial Technology | 2 | $29B |
|
||
| Insurance | 2 | $17B |
|
||
| Retail | 1 | $60B |
|
||
| Technology Distribution | 1 | $58B |
|
||
| Homebuilding | 1 | $35B |
|
||
| Technology Manufacturing | 1 | $35B |
|
||
Price history
-84.9% since first listed14 events — show timeline
- 2026-04-14 Contingent — PARMLS
- 2026-04-14 Pending — PARMLS
- 2026-04-01 Listed $319,000 PARMLS
- 2025-05-02 Listing Removed — PARMLS
- 2025-02-14 Listed $329,000 PARMLS
- 2024-11-09 Listing Removed — PARMLS
- 2024-10-04 Listed $339,000 PARMLS
- 2018-12-17 Sold (Public Records) $187,900 Public Records
- 2018-12-13 Sold (MLS) $187,900 NAMLS
- 2018-12-13 Sold (MLS) $187,900 ECAR
- 2018-10-26 Listed $189,900 NAMLS
- 2009-12-02 Sold (Public Records) $151,000 Public Records
- 2005-01-24 Sold (Public Records) $132,000 Public Records
- 1993-10-01 Sold (Public Records) $2,115,700 Public Records
Property tax history
+4.8%/yrLatest (2025): $1,755 · +2.9% YoY. Source: county tax records.
Cash-flow waterfall
monthlySold comps — $/sqft
last 12 mo · ≤1 miLoading sold comps…