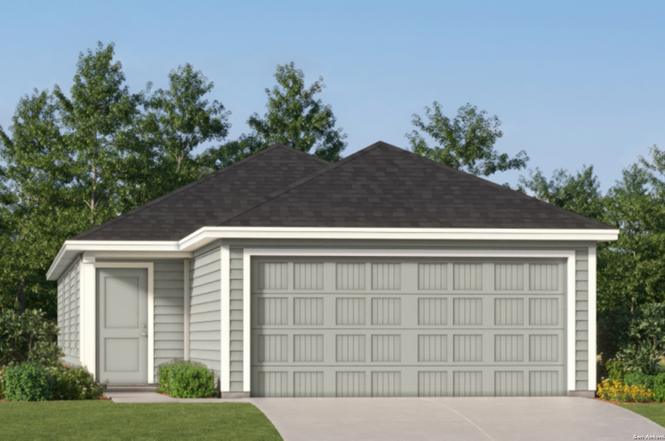
9215 Campbell Way · San Antonio, TX
Flood risk 1/10 · Minimal
- FEMA flood zone
- X (unshaded)
- Chance of flooding over 30 yrs
- 0.0%
- Est. flood insurance / yr
- $507 – $1,088
Fire risk 1/10 · Minimal
- Est. fire insurance / yr
- $1,222 – $2,270
Heat risk 8/10 · Major
- Hot days now (above 109°F)
- 7 days/yr
- Hot days in 30 yrs
- 20 days/yr
Wind risk 8/10 · Major
- Chance of severe wind over 30 yrs
- 80.0%
Air-quality risk 2/10 · Minimal
- Unhealthy air days now
- 0 days/yr
- Unhealthy air days in 30 yrs
- 1 days/yr
Risk factors via First Street. Map © Google.
Why this score? — see what drove the D grade
The composite is a weighted blend of 9 inputs, each scored 0–100. Each bar is that input's sub-score; the figure is the points it added to the 100-point composite (weight × sub-score).
- ARV discount +10.7/15.0
- Cash flow +10.3/30.0
- Appreciation +4.8/10.0
- Livability +4.0/5.0
- Condition / age +4.0/5.0
- 1% rule +3.2/10.0
- DSCR +2.9/10.0
- Rent growth +2.5/5.0
- Schools +1.4/10.0
$198,999
🖨 Deal sheet (PDF) 📄 Offer letter ✓ Due diligence
Listing remarks MLS
The Hoffman - This single-level home showcases a spacious open floorplan shared between the kitchen, dining area and family room for easy entertaining. An owner's suite enjoys a private location at the front of the home, complemented by an en-suite bathroom and walk-in closet. There are three secondary bedrooms just off the main living areas. Estimated Completion April 2026. The completion date, prices and features may vary and are subject to change. Please verify with Lennar directly. Photos are for illustrative purposes only.
Key facts
- Walk-in closet
- Open floorplan
- En-suite bathroom
Tags
Neighborhood map
What this means for you Summary
Snapshot
- This is a 4-bed/2.0-bath single-family listed at $199k. Condition is rated good.
Deal economics
- At list price, monthly cash flow is $-111 ($-1k/yr) — negative.
- To cash-flow at today's rent, offer at most $183k (8.1% below list).
- To meet the 1% rule (rent ≥ 1% of price), the offer needs to be $163k (18.0% below list).
- Recommended offer: $163k (18.0% below list) — sets the bar for 1% rule.
- Cap rate 5.6% vs local median 3.8% in San Antonio — top-decile yield for the area; either an underpriced asset or a hidden risk that comps aren't pricing in. Stress-test before assuming the spread holds.
Location & tenants
- Location reads 80/100 on livability (#31 in TX, #1,616 nationally) — a professional / high-income tenant draw. Strengths: amenities A+, commute A+, cost of living A+; Watch: crime F.
- South San Antonio ISD (urban): math 13% / reading 20% proficiency, ranked #804 of 826 in TX (top 97%) — low school quality limits family demand, transient renter base, plan for 1-2y turnover.
- Zoned schools: Miguel Carrillo Jr El (math 12% / reading 12%, grade F, #4,207 of 4,322 statewide, top 98%, 277 students, 98% FRL); South San Antonio H S (math 27% / reading 32%, grade F, #1,112 of 1,632 statewide, top 70%, 1,786 students, 93% FRL) — zoned schools average 95% FRL vs 42% district-wide (54 pts higher); higher-poverty schools than district average — tighter screening recommended.
- Market conditions: 162 active listings in the ZIP; 22 comparable units currently listed for rent nearby; rentals at typical pace (median 26d on market — plan ~3-4 weeks tenant-placement turnaround); 8,308 units permitted in Bexar County in 2024 (2,506 in 5+ unit buildings).
- This rent runs 35% of the median local income ($55k/yr) — at the standard rent-burdened threshold; future hikes will face affordability resistance.
Forward outlook
- In year one you build about $482 of equity ($1k loan paydown + $-894 appreciation (-0.5% local appreciation)).
- Bexar County population projected at +50% by 2050 — long-run rental-demand tailwind backs the buy-and-hold thesis.
Negotiation context
- It's been on market 94 days — a 9% lower offer ($181k) is reasonable based on typical stale-listing flexibility.
Risks & watch-outs
- Climate carrying-cost: severe wind risk, 80% chance of damaging wind over 30y; extreme-heat days projected 7→20/yr by 2055 (HVAC capex compounding) — expect insurance premiums to compound above CPI over the hold.
Questions for the listing agent
- What do current leases actually rent for vs. the listed asking? Can we see a recent rent roll and the last 12 months of T-12 income?
- It's been on market 94 days. Have you received any prior offers? Is the seller open to a 18% concession, seller financing, or rate buy-down credit?
- What does the HOA fee cover, when was the last increase, and are there any pending special assessments or reserve-fund shortfalls?
- Why hasn't it sold? Are there any deal-killer items the seller is aware of (foundation, flood, title, zoning, code violations)?
- Is there a deadline driving the sale (1031 exchange, divorce, estate, relocation)? That informs how much negotiation room exists.
- Crime grade is F in this area — have there been break-ins, vandalism, or insurance claims at this property in the last 3 years? What carrier currently insures it and at what premium?
- The area grade is low — what's the realistic commute time and amenity access for the typical tenant pool here? Any planned neighborhood developments (good or bad) we should know about?
- What's the average days-on-market for RENTAL listings here right now (not sales)? A rising rental-DOM trend means longer vacancies and softer asking-rent achievability than the comps imply.
- What's the recent tenant-quality profile in this submarket — average credit score on applications, eviction rate, late-payment / NSF rate, and stable-employment percentage? A property-management company in the area should have these aggregated.
- How much new for-sale + rental construction is in the pipeline within 1–3 miles? Heavy new supply typically softens prices + rents 12–24 months out; constrained supply supports both.
Investment metrics
- 1% rule
- 0.82% ✗
- Cap rate
- 5.63%
- Cash-on-cash
- -2.39%
- DSCR
- 0.89
- GRM
- 10.2
CMA / ARV
- ARV (median comp)
- $213,999
- List price
- $198,999
- Delta
- -7.01%
- Verdict
- FAIR
- Comps
- 20 within 1.0 mi
Show comp detail 12 sales within ~0.75 mi
| Address | Dist | Beds/Ba | Sqft | Sold | Price | $/sf | Match |
|---|---|---|---|---|---|---|---|
| 9327 Campbell Way | 0.00mi | 4/2.0 | 1,575 (+6%) | 1mo | $213,999 | $136 | 89 |
| 9343 Campbell Way | 0.00mi | 3/2.0 (-1) | 1,402 (-6%) | 1mo | $202,999 | $145 | 85 |
| 9206 Campbell Way | 0.00mi | 3/2.0 (-1) | 1,402 (-6%) | 4mo | $232,999 | $166 | 82 |
| 9211 Campbell Way | 0.00mi | 3/2.0 (-1) | 1,354 (-9%) | 0mo | $192,999 | $143 | 80 |
| 9118 Campbell Way | 0.00mi | 4/2.5 | 1,692 (+14%) | 1mo | $220,999 | $131 | 74 |
| 9135 Campbell Way | 0.00mi | 4/2.5 | 1,692 (+14%) | 2mo | $222,999 | $132 | 73 |
| 9123 Campbell Way | 0.00mi | 4/2.5 | 1,692 (+14%) | 3mo | $213,999 | $126 | 72 |
| 9331 Campbell Way | 0.00mi | 3/2.0 (-1) | 1,266 (-15%) | 1mo | $212,999 | $168 | 70 |
| 9230 Campbell Way | 0.00mi | 3/2.0 (-1) | 1,266 (-15%) | 1mo | $189,999 | $150 | 70 |
| 9310 Campbell Way | 0.00mi | 3/2.0 (-1) | 1,266 (-15%) | 4mo | $195,999 | $155 | 67 |
| 3702 Bates Pl | 0.71mi | 4/2.0 | 1,500 (+1%) | 9mo | $217,999 | $145 | 57 |
| 3707 Kurz Plz | 0.62mi | 3/2.0 (-1) | 1,266 (-15%) | 8mo | $185,500 | $147 | 35 |
Match score weights: distance 35% · size 25% · config 20% · recency 20%. Top-matched comps best support the ARV.
Projected returns pro-forma
-0.45% appreciation · 3.0% rent growth · sell at horizon
- IRR
- -6.7%
- Equity multiple
- 0.69×
- Total profit
- $-16,998
- Equity at exit
- $53,355
- IRR
- -0.4%
- Equity multiple
- 0.96×
- Total profit
- $-2,223
- Equity at exit
- $60,700
Cash invested: $55,720 (down + closing). Projections, not guarantees.
Landlord ↔ Tenant lean methodology
- Overall (STATE)
- 87 Strongly Landlord-Friendly
- State Texas
- 87 Strongly Landlord-Friendly · R+5
- County
- — inherits STATE
- City
- — inherits STATE
ZIP-level market 78211
- Home prices YoY
- -0.2%
- Active inventory
- 162
- Price-to-rent
- 10.2×
Monthly cashflow live
- Estimated rent
- $1,632 high interval (Pro) →
- Mortgage (P&I)
- −$1,044
- Tax est. 1.5%
- −$249 /mo · $2,985/yr
- Insurance
- −$83
- HOA
- −$25
- Vacancy / Maint / Mgmt
- −$343
- Net cashflow
- $-111
Break-even live
Sensitivity live
| Price | -10% $27 | -5% $-42 | +0% $-111 | +5% $-180 | +10% $-248 |
|---|---|---|---|---|---|
| Rent | -10% $-240 | -5% $-175 | +0% $-111 | +5% $-46 | +10% $18 |
| Rate | -1.0pp $-11 | -0.5pp $-60 | base $-111 | +0.5pp $-162 | +1.0pp $-215 |
UW: 25.0% down · 7.5% · 30yr · 1.5% tax · 5.0% vac · 8.0% maint · 8.0% mgmt
Financing live
Cash to close
- Down payment
- $49,750
- Closing costs
- $5,970
- Reserves months
- —
- Total cash needed
- —
Loan-product check · same deal, 3 products live
Conventional
25% down · 7.5% · 30yr
- Down + closing
- —
- Monthly P&I
- —
- Monthly cashflow
- —
- DSCR
- —
- Eligible?
- —
Personal DTI + credit; lowest rate.
DSCR
20% down · 8.5% · 30yr
- Down + closing
- —
- Monthly P&I
- —
- Monthly cashflow
- —
- DSCR
- —
- Eligible?
- —
No personal income docs; deal must DSCR.
Hard money
10% down · 12.0% · 12mo
- Down + closing
- —
- Monthly P&I
- —
- Monthly cashflow
- —
- DSCR
- —
- Eligible?
- —
Short-term bridge; refi at stabilization.
Rent comps 22 comps
| Address | Beds | Baths | Sqft | Rent | $/sqft | DOM | Units | Dist |
|---|---|---|---|---|---|---|---|---|
| 3810 Kurz Plz S San Antonio, TX | 3.0 | 2.0 | 1266 | $550 | $0.43 | 25d | 1 | 0.67mi |
| 3903 Kurz Plz S San Antonio, TX | 4.0 | 2.0 | 1627 | $2,000 | $1.23 | 0d | 1 | 0.69mi |
| 3911 Bates Pl San Antonio, TX | 3.0 | 2.0 | 1200 | $1,450 | $1.21 | 25d | 1 | 0.77mi |
| 3632 SW Military Dr #2 San Antonio, TX | 3.0 | 2.0 | 900 | $995 | $1.11 | 45d | 1 | 0.81mi |
| 9122 Campbell Way San Antonio, TX | 3.0 | 2.0 | 1354 | $1,495 | $1.10 | 4d | 1 | 1.02mi |
| 4007 Somers Crst San Antonio, TX | 3.0 | 2.0 | 1242 | $1,525 | $1.23 | 6d | 1 | 1.14mi |
| 3811 Somers Crst San Antonio, TX | 3.0 | 2.5 | 1529 | $1,650 | $1.08 | 45d | 1 | 1.18mi |
| 3723 Somers Crst San Antonio, TX | 3.0 | 2.5 | 1529 | $1,650 | $1.08 | 45d | 1 | 1.20mi |
| 9306 Somers Bnd San Antonio, TX | 3.0 | 2.5 | 1420 | $1,600 | $1.13 | 25d | 1 | 1.20mi |
| 9334 Somers Bnd San Antonio, TX | 3.0 | 2.5 | 1272 | $1,515 | $1.19 | 6d | 1 | 1.25mi |
| 9402 Somers Bnd San Antonio, TX | 3.0 | 2.5 | 1529 | $1,600 | $1.05 | 12d | 1 | 1.26mi |
| 4039 Imogene Ivy San Antonio, TX | 3.0 | 2.0 | 1200 | $1,550 | $1.29 | 25d | 1 | 1.26mi |
| 9407 Somers Bnd San Antonio, TX | 3.0 | 2.5 | 1310 | $1,525 | $1.16 | 25d | 1 | 1.26mi |
| 9419 Graze Br San Antonio, TX | 3.0 | 2.0 | 1242 | $1,550 | $1.25 | 19d | 1 | 1.26mi |
| 838 King Ave San Antonio, TX | 3.0 | 2.0 | 1008 | $1,250 | $1.24 | 25d | 1 | 1.28mi |
| 9447 Tarbutton Trl San Antonio, TX | 3.0 | 2.0 | 1007 | $1,550 | $1.54 | 18d | 1 | 1.29mi |
| 9422 Somers Bnd San Antonio, TX | 3.0 | 2.5 | 1419 | $1,575 | $1.11 | 45d | 1 | 1.29mi |
| 4111 Imogene Ivy San Antonio, TX | 3.0 | 2.0 | 1276 | $1,700 | $1.33 | 5d | 1 | 1.31mi |
| 9435 Dogwood Hl San Antonio, TX | 3.0 | 2.5 | 1529 | $1,600 | $1.05 | 45d | 1 | 1.31mi |
| 9018 Chaminade Dr San Antonio, TX | 3.0 | 1.5 | 1056 | $1,675 | $1.59 | 45d | 1 | 1.34mi |
| 1862 Kendalia Ave San Antonio, TX | 3.0 | 1.0 | 1345 | $1,350 | $1.00 | 25d | 1 | 1.43mi |
| 3727 Aragon Dr San Antonio, TX | 3.0 | 1.0 | 1060 | $1,400 | $1.32 | 45d | 1 | 1.44mi |
HOA detail
- Monthly dues
- $25 · $300/yr
Listing history 18 events
-
2026-06-21statusdays on market $198,999 Active 94 DOM
-
2026-06-18days on market $198,999 Price Change 91 DOM
-
2026-06-17days on market $198,999 Price Change 90 DOM
-
2026-06-16days on market $198,999 Price Change 89 DOM
-
2026-06-15days on market $198,999 Price Change 88 DOM
-
2026-06-13days on market $198,999 Price Change 86 DOM
-
2026-06-09pricedays on market $198,999 Price Change 82 DOM
-
2026-06-08days on market $200,999 Price Change 81 DOM
-
2026-06-07days on market $200,999 Price Change 80 DOM
-
2026-06-04pricedays on market $200,999 Price Change 77 DOM
-
2026-06-03days on market $224,999 Price Change 76 DOM
-
2026-06-02days on market $224,999 Price Change 75 DOM
-
2026-06-01days on market $224,999 Price Change 74 DOM
-
2026-05-31days on market $224,999 Price Change 73 DOM
-
2026-05-09price $229,999 533-char remark
Show marketing remark (533 chars)
The Hoffman - This single-level home showcases a spacious open floorplan shared between the kitchen, dining area and family room for easy entertaining. An owner's suite enjoys a private location at the front of the home, complemented by an en-suite bathroom and walk-in closet. There are three secondary bedrooms just off the main living areas. Estimated Completion April 2026. The completion date, prices and features may vary and are subject to change. Please verify with Lennar directly. Photos are for illustrative purposes only.
-
2026-04-30price $230,999 533-char remark
Show marketing remark (533 chars)
The Hoffman - This single-level home showcases a spacious open floorplan shared between the kitchen, dining area and family room for easy entertaining. An owner's suite enjoys a private location at the front of the home, complemented by an en-suite bathroom and walk-in closet. There are three secondary bedrooms just off the main living areas. Estimated Completion April 2026. The completion date, prices and features may vary and are subject to change. Please verify with Lennar directly. Photos are for illustrative purposes only.
-
2026-04-17price $233,999 533-char remark
Show marketing remark (533 chars)
The Hoffman - This single-level home showcases a spacious open floorplan shared between the kitchen, dining area and family room for easy entertaining. An owner's suite enjoys a private location at the front of the home, complemented by an en-suite bathroom and walk-in closet. There are three secondary bedrooms just off the main living areas. Estimated Completion April 2026. The completion date, prices and features may vary and are subject to change. Please verify with Lennar directly. Photos are for illustrative purposes only.
-
2026-03-19$238,999 New 533-char remark
Show marketing remark (533 chars)
The Hoffman - This single-level home showcases a spacious open floorplan shared between the kitchen, dining area and family room for easy entertaining. An owner's suite enjoys a private location at the front of the home, complemented by an en-suite bathroom and walk-in closet. There are three secondary bedrooms just off the main living areas. Estimated Completion April 2026. The completion date, prices and features may vary and are subject to change. Please verify with Lennar directly. Photos are for illustrative purposes only.
ⓘ Source: listings_history table (triggers on properties + properties_extension) + one-shot
backfill from property_details.listing_events for pre-trigger history.
Climate risk First Street
- Flood 1/10 Low FEMA zone X (unshaded) · 0% chance over 30 yrs
- Wildfire 1/10 Low
- Heat 8/10 Severe 7 d/yr ≥109°F today · 20 d/yr by 30 yrs out
- Wind 8/10 Severe 80% chance of damaging wind over 30 yrs
- Air quality 2/10 Low 0 unhealthy d/yr today · 1 by 30 yrs out
Nearby sold comps map
Loading sold comps map…
Walkable amenities ~0.75 mi
Loading nearby amenities…
Taxation est. · year 1
- Rental income
- $19,587
- − Mortgage interest
- −$11,147
- − Property taxes
- −$2,985
- − Insurance
- −$995
- − Repairs & maintenance
- −$1,567
- − Management
- −$1,567
- − HOA
- −$300
- − Depreciation
- −$5,789
- Taxable loss
- −$4,763
- Est. tax savings @ 24.0%
- +$1,143
- After-tax cash flow
- $-186/yr
For passive investors: Depreciation is non-cash, so a rental often shows a tax loss while cash-flowing — sheltering income. Rental losses are passive: they offset passive income freely, and up to $25,000/yr can offset ordinary (W-2) income if you actively participate and your MAGI is under $100k (phasing out to $0 by $150k); unused losses carry forward. On sale, claimed depreciation is recaptured at up to 25%, and gains may owe capital-gains tax (a 1031 exchange can defer both). Figures are a year-1 estimate at your 24.0% rate — not tax advice; consult a CPA.
Condition & rehab AI · 11 photos
This single-level home showcases a spacious open floorplan with modern finishes and a good condition. It is ready for move-in and would benefit from some exterior painting and landscaping improvements to enhance its curb appeal and value.
Value-add opportunities
- Both Painting exterior siding — Enhances curb appeal and value
- Both Landscaping improvements — Enhances curb appeal and value
- Both New flooring in bathrooms — Improves aesthetics and functionality
- Both New kitchen appliances — Modernizes the space and improves functionality
Renovation cost estimate screening
Value-add ROI direction
- Both Painting exterior siding — Enhances curb appeal and value ↑
- Both Landscaping improvements — Enhances curb appeal and value ↑
- Both New flooring in bathrooms — Improves aesthetics and functionality ↑
- Both New kitchen appliances — Modernizes the space and improves functionality ↑
ⓘ Cost ranges are severity-bucket heuristics (US national rule-of-thumb). Get contractor quotes + a written scope before underwriting a rehab budget.
Schools (NCES district)
- District
- South San Antonio ISD
- NCES district ID
- 4840680
- Math proficiency
- 13% ▼ -20.00%
- Reading proficiency
- 20% ▼ -10.00%
- Median HH income
- $35,460
- Composite
- 13.6/100
- National rank
- #9511
- State rank
- #804 of 826 in TX
Livability — San Antonio
- Score
- 80/100
- State rank
- #31
- US rank
- #1616
Category grades
Schools grade is shown separately in the Schools card above.
Census & demographics
- Census place
- San Antonio, TX
- County
- Bexar County · 1,990,555 people
- City population
- 1,806,925
- Metro
- San Antonio-New Braunfels, TX
- Population (ZIP)
- 30,857
- Household income
- $55,436
- Rent vs Own
- Severe rent burden
- 729.0
Population outlook (Bexar County) Hauer SSP2
- Today (2025)
- 2,336,851 people
- By 2030
- 2,560,728 · +9.6%
- By 2040
- 3,020,569 · +29.3%
- By 2050
- 3,493,522 · +49.5%
- By 2075
- 4,668,459 · +99.8%
- By 2100
- 5,533,242 · +136.8%
Race, ethnicity, and origin ACS 2023
- Neighborhood character
- Predominantly Hispanic (93%)
- Race & ethnicity
- Hispanic / Latino 93% Two or more races 30% White 5% Black 1% Native American 1%
- Hispanic origin (detail)
- Mexican 76%
- Foreign-born
- 18% · Canada
- Languages at home
- 35% English-only · Spanish 65%
Political lean MEDSL · Bexar
- 2024 margin
- Lean D (+9.8) · D 54.3% · R 44.6% · Other 1.1%
- 2008→2024 swing
- +4.2pp toward D · 2008: 5.6pp · 2024: 9.8pp
- All cycles
- 2024: D+9.8 2020: D+18.2 2016: D+13.5 2012: D+4.6 2008: D+5.6
Not yet ingested
- Civics
- —
Market trends
- HPI YoY
- ▼ -0.45%
- Current HPI
- 241.1709
- Rent YoY
- —
- Metro
- San Antonio-New Braunfels, TX
- State GDP YoY
- ▲ 3.95%
- F500 in state
- 110
Industry mix (Fortune 500 HQ in TX)
| Industry | F500 HQs | Revenue |
|---|---|---|
| Energy | 16 | $1,198B |
|
||
| Technology | 5 | $198B |
|
||
| Engineering / Construction | 4 | $72B |
|
||
| Energy Services | 3 | $60B |
|
||
| Utilities | 3 | $41B |
|
||
| Healthcare | 2 | $330B |
|
||
Price history
-3.8% since first listed4 events — show timeline
- 2026-05-09 Price Changed $229,999 LERA
- 2026-04-30 Price Changed $230,999 LERA
- 2026-04-17 Price Changed $233,999 LERA
- 2026-03-19 Listed $238,999 LERA
Cash-flow waterfall
monthlySold comps — $/sqft
last 12 mo · ≤1 miLoading sold comps…