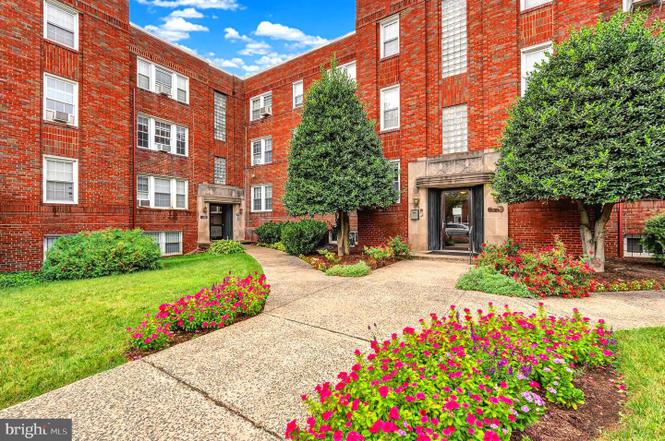
5200 N Capitol St NW #204 · Washington, DC
Flood risk 1/10 · Minimal
- FEMA flood zone
- X (unshaded)
- Chance of flooding over 30 yrs
- 0.0%
- Est. flood insurance / yr
- $473 – $860
Fire risk 1/10 · Minimal
- Est. fire insurance / yr
- $631 – $1,173
Heat risk 7/10 · Major
- Hot days now (above 104°F)
- 7 days/yr
- Hot days in 30 yrs
- 15 days/yr
Wind risk 4/10 · Minor
- Chance of severe wind over 30 yrs
- 19.0%
Air-quality risk 4/10 · Minor
- Unhealthy air days now
- 5 days/yr
- Unhealthy air days in 30 yrs
- 6 days/yr
Risk factors via First Street. Map © Google.
Why this score? — see what drove the D grade
The composite is a weighted blend of 9 inputs, each scored 0–100. Each bar is that input's sub-score; the figure is the points it added to the 100-point composite (weight × sub-score).
- Cash flow +10.5/30.0
- 1% rule +8.6/10.0
- ARV discount +7.5/15.0
- Livability +3.7/5.0
- Schools +3.6/10.0
- DSCR +3.0/10.0
- Rent growth +2.9/5.0
- Condition / age +2.5/5.0
- Appreciation +0.0/10.0
$135,500
🖨 Deal sheet 📄 Offer letter ✓ Due diligence
Listing remarks MLS
xxxx
Key facts
- Laundry facilities
- Open floor plan
- Walk-in closet
Tags
Property features AI
Finance
- HOA & community: Monthly cooperative fee ($585) managed professionally off-site; Condo/Coop fee covers common area maintenance, electricity, exterior building maintenance, gas, heat, management, snow removal, and taxes; Laundry facilities listed as an association amenity; Property manager present; Pets not allowed
Exterior
- Parking: On-site parking available for rent; Off-street access via alley
- Utilities: Public water; Public sewer
- Home design: Cooperative unit in a garden-style building (1–4 floors); Unit/flat; Entry level: 2nd floor; Building named NORFOLK; Property condition: Very good; Not in a federal flood zone; In city limits
- Construction: Brick construction
- Exterior features: Sidewalks; Above-grade other structures
Interior
- Kitchen: Built-in microwave; Garbage disposal; Gas oven/range; Refrigerator
- Bedrooms: One bedroom on the main level
- Flooring: Carpet; Wood floors
- Bathrooms: One full bathroom on the main level
- Heating & cooling: Radiator heating with natural gas; Window air conditioning units (electric)
- Interior features: Open and traditional floor plan with a galley kitchen and dining area; Combination kitchen/dining; Walk-in closet(s); Estimated living area
- Laundry & utility: Laundry facilities in the building; Laundry located on lower floor (no washer/dryer in unit)
Neighborhood map
What this means for you Summary
Snapshot
- This is a 1-bed/1.0-bath condo listed at $136k.
Deal economics
- At list price, monthly cash flow is $-69 ($-831/yr) — negative.
- To cash-flow at today's rent, offer at most $125k (7.4% below list).
- Meets the 1% rule at list price ($2k rent vs $136k).
- Recommended offer: $119k (12.0% below list) — sets the bar for market timing.
- Cap rate 5.7% vs local median 2.5% in Washington — top-decile yield for the area; either an underpriced asset or a hidden risk that comps aren't pricing in. Stress-test before assuming the spread holds.
Location & tenants
- Location reads 73/100 on livability (#1 in DC) — a middle-class / working-renter tenant base. Strengths: amenities A+, commute A+, employment A+; Watch: crime F, cost of living F.
- District Of Columbia Public Schools (urban): math 33% / reading 40% proficiency, ranked #8 of 32 in DC (top 25%) — families likely to look elsewhere, expect single-tenant / working-renter base with shorter leases; 65% free/reduced lunch — lower-income household profile, screen leases tightly.
- Market conditions: Rents rising (+1.4%/yr); 370 active listings in the ZIP; 40 comparable units currently listed for rent nearby; rentals at typical pace (median 25d on market — plan ~3-4 weeks tenant-placement turnaround); high-income renter base; 1,737 units permitted in District of Columbia in 2024 (1,506 in 5+ unit buildings).
Forward outlook
- Local home prices are declining (-3.0%/yr); year-one equity from $937 of loan paydown is wiped out by about $4k of value loss. Plan a longer hold.
- District of Columbia County population projected at +50% by 2050 — long-run rental-demand tailwind backs the buy-and-hold thesis.
Negotiation context
- It's been on market 271 days — a 12% lower offer ($119k) is reasonable based on typical stale-listing flexibility.
- 4 sale attempts since 18y ago; this cycle's ask has dropped $30k (18%) from the opening price — seller is motivated, your offer sets the floor, not the list.
- Current owner paid $110k; 23% above their basis — modest negotiation headroom, anchor on the comps not their cost.
Risks & watch-outs
- Watch-outs: HOA is 32% of rent; built in 1940 — expect roof / HVAC / electrical / plumbing capex.
- Climate carrying-cost: extreme-heat days projected 7→15/yr by 2055 (HVAC capex compounding) — expect insurance premiums to compound above CPI over the hold.
Questions for the listing agent
- What do current leases actually rent for vs. the listed asking? Can we see a recent rent roll and the last 12 months of T-12 income?
- It's been on market 271 days. Have you received any prior offers? Is the seller open to a 12% concession, seller financing, or rate buy-down credit?
- Built in 1940 — when were the roof, HVAC, electrical panel, plumbing, and water heater last replaced?
- What does the HOA fee cover, when was the last increase, and are there any pending special assessments or reserve-fund shortfalls?
- Any open or pending special assessments — roof, HVAC, plumbing, elevator, façade? What's the per-unit balance and payoff schedule, and is the seller paying it off at close or rolling it to the buyer?
- Why hasn't it sold? Are there any deal-killer items the seller is aware of (foundation, flood, title, zoning, code violations)?
- Is there a deadline driving the sale (1031 exchange, divorce, estate, relocation)? That informs how much negotiation room exists.
- Crime grade is F in this area — have there been break-ins, vandalism, or insurance claims at this property in the last 3 years? What carrier currently insures it and at what premium?
- The area grade is low — what's the realistic commute time and amenity access for the typical tenant pool here? Any planned neighborhood developments (good or bad) we should know about?
- What's the average days-on-market for RENTAL listings here right now (not sales)? A rising rental-DOM trend means longer vacancies and softer asking-rent achievability than the comps imply.
- What's the recent tenant-quality profile in this submarket — average credit score on applications, eviction rate, late-payment / NSF rate, and stable-employment percentage? A property-management company in the area should have these aggregated.
- How much new apartment / multifamily construction is in the pipeline within 1–3 miles? Heavy new supply (>2% of stock underway) typically softens rents 12–24 months out; light construction supports rent growth.
Investment metrics
- 1% rule
- 1.36% ✓
- Cap rate
- 5.68%
- Cash-on-cash
- -2.19%
- DSCR
- 0.90
- GRM
- 6.1
CMA / ARV
No comps found within radius.
Projected returns pro-forma
-3.0% appreciation · 1.45% rent growth · sell at horizon
- IRR
- -22.5%
- Equity multiple
- 0.24×
- Total profit
- $-28,806
- Equity at exit
- $20,203
- IRR
- -23.8%
- Equity multiple
- -0.07×
- Total profit
- $-40,422
- Equity at exit
- $11,716
Cash invested: $37,940 (down + closing). Projections, not guarantees.
Landlord ↔ Tenant lean methodology
- Overall (CITY)
- 0 Strongly Tenant-Friendly
- State District of Columbia
- 12 Strongly Tenant-Friendly · D+43
- County
- — inherits STATE
- City Washington
- 0 Strongly Tenant-Friendly · D+43
ZIP-level market 20011
- Rents YoY
- 1.4%
- Active inventory
- 370
- Price-to-rent
- 6.1×
Monthly cashflow live
- Estimated rent
- $1,838 high interval (Pro) →
- Mortgage (P&I)
- −$711
- Tax est. 1.5%
- −$169 /mo · $2,032/yr
- Insurance
- −$56
- HOA
- −$585
- Vacancy / Maint / Mgmt
- −$386
- Net cashflow
- $-69
Break-even live
UW: 25.0% down · 7.5% · 30yr · 1.5% tax · 5.0% vac · 8.0% maint · 8.0% mgmt
Financing live
Cash to close
- Down payment
- $33,875
- Closing costs
- $4,065
- Reserves months
- —
- Total cash needed
- —
Loan-product check · same deal, 3 products live
Conventional
25% down · 7.5% · 30yr
- Down + closing
- —
- Monthly P&I
- —
- Monthly cashflow
- —
- DSCR
- —
- Eligible?
- —
Personal DTI + credit; lowest rate.
DSCR
20% down · 8.5% · 30yr
- Down + closing
- —
- Monthly P&I
- —
- Monthly cashflow
- —
- DSCR
- —
- Eligible?
- —
No personal income docs; deal must DSCR.
Hard money
10% down · 12.0% · 12mo
- Down + closing
- —
- Monthly P&I
- —
- Monthly cashflow
- —
- DSCR
- —
- Eligible?
- —
Short-term bridge; refi at stabilization.
Rent comps 40 comps
| Address | Beds | Baths | Sqft | Rent | $/sqft | DOM | Units | Dist |
|---|---|---|---|---|---|---|---|---|
| 21 Riggs Rd NE Washington, DC | 1.0 | 1.0 | 595 | $1,625 | $2.73 | 2d | 6 | 0.09mi |
| 5110 Fort Totten Dr NE #4 Washington, DC | 2.0 | 2.0 | 715 | $2,195 | $3.07 | 24d | 1 | 0.09mi |
| 5106 N Capitol St NW Washington, DC | 1.0 | 1.0 | 800 | $1,195 | $1.49 | 4d | 1 | 0.09mi |
| 5408 1st Pl NW Unit 106 Washington, DC | 2.0 | 2.0 | 825 | $2,300 | $2.79 | 15d | 1 | 0.15mi |
| 5041 1st St NW Washington, DC | 1.0 | 1.0 | 600 | $1,545 | $2.58 | 4d | 1 | 0.21mi |
| 21 Kennedy St NW Washington, DC | 1.0 | 1.0 | 640 | $1,395 | $2.18 | 24d | 1 | 0.21mi |
| 5119 2nd St NW Unit 4 Washington, DC | 2.0 | 1.0 | 900 | $2,050 | $2.28 | 24d | 1 | 0.24mi |
| 4900 Fort Totten Dr NE Washington, DC | 1.0–2.0 | 1.0 | 706 | $1,427 | $2.02 | 11d | 7 | 0.25mi |
| 220 Hamilton St NW Washington, DC | 2.0 | 1.0–2.0 | 723 | $2,225 | $3.08 | 24d | 1 | 0.28mi |
| 4910 1st St NW Washington, DC | 1.0 | 1.0 | 800 | $2,000 | $2.50 | 24d | 1 | 0.35mi |
| 4818 Fort Totten Dr NE Washington, DC | 1.0–2.0 | 1.0 | 725 | $1,595 | $2.20 | 3d | 4 | 0.36mi |
| 5210 3rd St NE Washington, DC | 2.0 | 1.0–2.0 | 862 | $2,038 | $2.36 | 1d | 28 | 0.40mi |
| 5661 3rd St NE Washington, DC | 2.0 | 1.0–2.0 | 749 | $2,126 | $2.84 | 3d | 28 | 0.44mi |
| 317 Kennedy St NW Unit 104 Washington, DC | 1.0 | 1.0 | 561 | $1,999 | $3.56 | 24d | 1 | 0.46mi |
| 317 Kennedy St NW Unit 501 Washington, DC | 1.0 | 1.0 | 738 | $2,500 | $3.39 | 24d | 1 | 0.46mi |
| 317 Kennedy St NW Unit 403 Washington, DC | 1.0 | 1.0 | 626 | $2,250 | $3.59 | 24d | 1 | 0.46mi |
| 301 Delafield Pl NW Washington, DC | 1.0 | 1.0 | 600 | $1,595 | $2.66 | 24d | 1 | 0.49mi |
| 4809 3rd St NW #4 Washington, DC | 2.0 | 2.0 | 715 | $2,700 | $3.78 | 18d | 1 | 0.49mi |
| 400 Galloway St NE Washington, DC | 2.0 | 1.0–2.0 | 716 | $2,271 | $3.17 | 2d | 26 | 0.55mi |
| 4520 Fort Totten Dr NE Washington, DC | 1.0–2.0 | 1.0 | 662 | $1,525 | $2.30 | 3d | 8 | 0.62mi |
| 4630 New Hampshire Ave NW Unit 1 Washington, DC | 1.0 | 1.0 | 845 | $1,700 | $2.01 | 18d | 1 | 0.62mi |
| 5611 5th St NW #21 Washington, DC | 1.0 | 1.0 | 548 | $1,650 | $3.01 | 24d | 1 | 0.64mi |
| 6011 N Dakota Ave NW Unit C Washington, DC | 1.0 | 1.0 | 900 | $1,900 | $2.11 | 24d | 1 | 0.65mi |
| 531 Kennedy St NW #3 Washington, DC | 1.0 | 1.5 | 586 | $1,800 | $3.07 | 15d | 1 | 0.67mi |
| 639 Emerson St NE Washington, DC | 2.0 | 1.0 | 900 | $2,195 | $2.44 | 5d | 1 | 0.68mi |
| 639 Emerson St NE Washington, DC | 2.0 | 1.0 | 900 | $2,195 | $2.44 | 17d | 1 | 0.68mi |
| 531 Kennedy St NW Washington, DC | 1.0 | 1.5 | 665 | $1,850 | $2.78 | 24d | 1 | 0.68mi |
| 639 Farragut Pl NE Washington, DC | 2.0 | 2.0 | 816 | $3,000 | $3.68 | 24d | 1 | 0.69mi |
| 99 Webster St NE Washington, DC | 1.0 | 1.0 | 800 | $1,591 | $1.99 | 13d | 4 | 0.69mi |
| 220 Allison St NW Washington, DC | 1.0 | 1.0 | 725 | $1,495 | $2.06 | 24d | 1 | 0.69mi |
| 4411 1st Pl NE #8 Washington, DC | 2.0 | 1.0 | 728 | $2,200 | $3.02 | 7d | 1 | 0.70mi |
| 4411 1st Pl NE #8 Washington, DC | 2.0 | 1.0 | 728 | $2,200 | $3.02 | 24d | 1 | 0.70mi |
| 4408 1st Pl NE #22 Washington, DC | 1.0 | 1.0 | 590 | $1,600 | $2.71 | 24d | 1 | 0.70mi |
| 5303 7th St NW Washington, DC | 1.0 | 1.0 | 723 | $1,950 | $2.70 | 16d | 1 | 0.70mi |
| 5303 7th St NW Unit B Washington, DC | 1.0 | 1.0 | 723 | $1,950 | $2.70 | 24d | 1 | 0.70mi |
| 4510 2nd St NE Washington, DC | 1.0–2.0 | 1.0 | 750 | $1,350 | $1.80 | 3d | 8 | 0.72mi |
| 700 Jefferson St NW Washington, DC | 1.0 | 1.0 | 569 | $1,528 | $2.69 | 24d | 1 | 0.73mi |
| 5400 7th St NW Unit 002 Washington, DC | 1.0 | 1.0 | 650 | $1,326 | $2.04 | 24d | 1 | 0.74mi |
| 5400 7th St NW Apt 106 Washington, DC | 1.0 | 1.0 | 800 | $1,315 | $1.64 | 24d | 1 | 0.74mi |
| 5400 7th St NW Apt 108 Washington, DC | 1.0 | 1.0 | 800 | $1,463 | $1.83 | 24d | 1 | 0.74mi |
HOA detail condo
- Monthly dues
- $585 · $7,020/yr
- Assessments
- None detected in remarks — confirm with the listing agent.
Listing history 25 events
-
2026-06-18days on market $135,500 Active 271 DOM
-
2026-06-17days on market $135,500 Active 270 DOM
-
2026-06-16days on market $135,500 Active 269 DOM
-
2026-06-15days on market $135,500 Active 268 DOM
-
2026-06-13days on market $135,500 Active 266 DOM
-
2026-06-09days on market $135,500 Active 262 DOM
-
2026-06-08days on market $135,500 Active 261 DOM
-
2026-06-07days on market $135,500 Active 260 DOM
-
2026-06-04days on market $135,500 Active 257 DOM
-
2026-06-03days on market $135,500 Active 256 DOM
-
2026-06-02days on market $135,500 Active 255 DOM
-
2026-06-01days on market $135,500 Active 254 DOM
-
2026-05-31days on market $135,500 Active 253 DOM
-
2026-02-12price $135,500
-
2025-12-11price $149,900
-
2025-10-17price $154,900
-
2025-09-20$165,000 Active
-
2008-11-26soldstatus $109,900 Sold 4-char remark
Show marketing remark (4 chars)
xxxx
-
2008-10-12historical 4-char remark
Show marketing remark (4 chars)
xxxx
-
2008-10-08historical 4-char remark
Show marketing remark (4 chars)
xxxx
-
2008-08-19status 4-char remark
Show marketing remark (4 chars)
xxxx
-
2008-07-19historical 4-char remark
Show marketing remark (4 chars)
xxxx
-
2008-07-08status 4-char remark
Show marketing remark (4 chars)
xxxx
-
2008-07-08historical 4-char remark
Show marketing remark (4 chars)
xxxx
-
2008-07-03$109,900 4-char remark
Show marketing remark (4 chars)
xxxx
ⓘ Source: listings_history table (triggers on properties + properties_extension) + one-shot
backfill from property_details.listing_events for pre-trigger history.
Climate risk First Street
- Flood 1/10 Low FEMA zone X (unshaded) · 0% chance over 30 yrs
- Wildfire 1/10 Low
- Heat 7/10 Severe 7 d/yr ≥104°F today · 15 d/yr by 30 yrs out
- Wind 4/10 Moderate 19% chance of damaging wind over 30 yrs
- Air quality 4/10 Moderate 5 unhealthy d/yr today · 6 by 30 yrs out
Nearby sold comps map
Loading sold comps map…
Walkable amenities ~0.75 mi
Loading nearby amenities…
Taxation est. · year 1
- Rental income
- $22,058
- − Mortgage interest
- −$7,590
- − Property taxes
- −$2,032
- − Insurance
- −$678
- − Repairs & maintenance
- −$1,765
- − Management
- −$1,765
- − HOA
- −$7,020
- − Depreciation
- −$3,942
- Taxable loss
- −$2,734
- Est. tax savings @ 24.0%
- +$656
- After-tax cash flow
- $-175/yr
For passive investors: Depreciation is non-cash, so a rental often shows a tax loss while cash-flowing — sheltering income. Rental losses are passive: they offset passive income freely, and up to $25,000/yr can offset ordinary (W-2) income if you actively participate and your MAGI is under $100k (phasing out to $0 by $150k); unused losses carry forward. On sale, claimed depreciation is recaptured at up to 25%, and gains may owe capital-gains tax (a 1031 exchange can defer both). Figures are a year-1 estimate at your 24.0% rate — not tax advice; consult a CPA.
Schools (NCES district)
- District
- District Of Columbia Public Schools
- NCES district ID
- 1100030
- Math proficiency
- 33% ▲ 3.00%
- Reading proficiency
- 40% ▲ 5.00%
- Median HH income
- $67,671
- Composite
- 35.84/100
- National rank
- #9606
- State rank
- #8 of 32 in DC
Livability — Washington
- Score
- 73/100
- State rank
- #1
- US rank
- #5327
Category grades
Schools grade is shown separately in the Schools card above.
Census & demographics
- Census place
- Washington, DC
- County
- District of Columbia · 671,873 people
- City population
- 671,873
- Metro
- Washington-Arlington-Alexandria, DC-VA-MD-WV
- Population (ZIP)
- 67,434
- Household income
- $110,309
- Rent vs Own
- Severe rent burden
- 3020.0
Population outlook (District of Columbia County) Hauer SSP2
- Today (2025)
- 821,926 people
- By 2030
- 899,517 · +9.4%
- By 2040
- 1,061,162 · +29.1%
- By 2050
- 1,231,493 · +49.8%
- By 2075
- 1,603,312 · +95.1%
- By 2100
- 1,847,141 · +124.7%
Race, ethnicity, and origin ACS 2023
- Neighborhood character
- Diverse neighborhood (Simpson 0.66)
- Race & ethnicity
- Black 50% Hispanic / Latino 23% White 20% Two or more races 10% Asian 2%
- Hispanic origin (detail)
- Mexican 2% Dominican 1%
- Common ancestry
- Lithuanian 1% Romanian 1% Slovak 1%
- Foreign-born
- 21% · Canada
- Languages at home
- 70% English-only · Spanish 20% French/Haitian/Cajun 2% Other Indo-European 1%
Political lean MEDSL · District of Columbia
- 2024 margin
- Solid D (+86.1) · D 91.2% · R 5.1% · Other 3.8%
- 2008→2024 swing
- +0.1pp no change · 2008: 85.9pp · 2024: 86.1pp
- All cycles
- 2024: D+86.1 2020: D+86.8 2016: D+88.7 2012: D+84.2 2008: D+85.9
Not yet ingested
- Civics
- —
Market trends
- HPI YoY
- ▼ -755.96%
- Current HPI
- 378.1083
- Rent YoY
- ▲ 1.45%
- Metro
- Washington-Arlington-Alexandria, DC-VA-MD-WV
- State GDP YoY
- ▲ 1.33%
- F500 in state
- 6
Industry mix (Fortune 500 HQ in DC)
| Industry | F500 HQs | Revenue |
|---|---|---|
| Financial Services | 1 | $153B |
|
||
| Life Sciences / Industrials | 1 | $25B |
|
||
| Industrial Machinery | 1 | $8B |
|
||
Price history
+23.3% since first listed12 events — show timeline
- 2026-02-12 Price Changed $135,500 BRIGHT MLS
- 2025-12-11 Price Changed $149,900 BRIGHT MLS
- 2025-10-17 Price Changed $154,900 BRIGHT MLS
- 2025-09-20 Listed $165,000 BRIGHT MLS
- 2008-11-26 Sold (MLS) $109,900 MRIS
- 2008-10-12 Delisted — MRIS
- 2008-10-08 Contingent — MRIS
- 2008-08-19 Relisted — MRIS
- 2008-07-19 Delisted — MRIS
- 2008-07-08 Relisted — MRIS
- 2008-07-08 Delisted — MRIS
- 2008-07-03 Listed $109,900 MRIS
Cash-flow waterfall
monthlySold comps — $/sqft
last 12 mo · ≤1 miLoading sold comps…