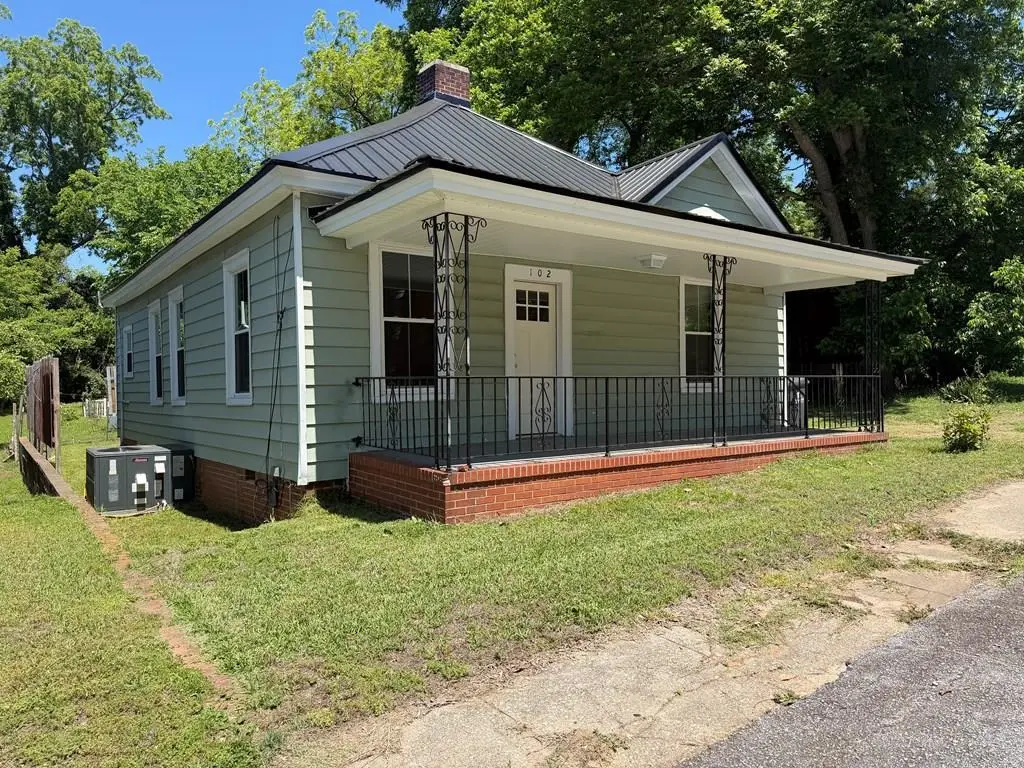
102 Bowie St · Abbeville, SC
Flood risk 1/10 · Minimal
- FEMA flood zone
- X (unshaded)
- Chance of flooding over 30 yrs
- 0.0%
- Est. flood insurance / yr
- $507 – $1,088
Fire risk 4/10 · Minor
- Est. fire insurance / yr
- $783 – $1,453
Heat risk 6/10 · Moderate
- Hot days now (above 106°F)
- 7 days/yr
- Hot days in 30 yrs
- 17 days/yr
Wind risk 6/10 · Moderate
- Chance of severe wind over 30 yrs
- 27.0%
Air-quality risk 2/10 · Minimal
- Unhealthy air days now
- 2 days/yr
- Unhealthy air days in 30 yrs
- 2 days/yr
Risk factors via First Street. Map © Google.
Why this score? — see what drove the B+ grade
The composite is a weighted blend of 9 inputs, each scored 0–100. Each bar is that input's sub-score; the figure is the points it added to the 100-point composite (weight × sub-score).
- Cash flow +30.0/30.0
- 1% rule +10.0/10.0
- DSCR +10.0/10.0
- Appreciation +10.0/10.0
- ARV discount +7.5/15.0
- Schools +4.1/10.0
- Livability +3.3/5.0
- Rent growth +2.5/5.0
- Condition / age +2.5/5.0
$65,000
🖨 Deal sheet (PDF) 📄 Offer letter ✓ Due diligence
Listing remarks MLS
START HERE. .Affordable 2 bedroom home with a great swing front porch. A perfect starter home or maybe a nice rental. The location is perfect a small easy to maintain yard. The neighborhood is safe and convient to churches, restaurants and downtown shopping in Abbeville.
Key facts
- Walk to shops
- Beadboard ceilings
- Walk to restaurants
Tags
Property features AI
Exterior
- Utilities: Sewer connected
- Home design: Single-family detached residential property
- Construction: Aluminum siding and frame construction
- Exterior features: Metal roof; Level lot
Interior
- Flooring: Hardwood
- Bathrooms: 1 full bathroom
- Heating & cooling: Central Air; Electric heat
- Interior features: Hardwood flooring; Central air conditioning; Electric heating
Neighborhood map
What this means for you Summary
Snapshot
- This is a 2-bed/1.0-bath single-family listed at $65k.
Deal economics
- At list price, monthly cash flow is $375 ($4k/yr) — positive.
- The deal already cash-flows at list — no discount required.
- Meets the 1% rule at list price ($1k rent vs $65k).
- Cap rate 13.2% vs local median 4.9% in Abbeville — top-decile yield for the area; either an underpriced asset or a hidden risk that comps aren't pricing in. Stress-test before assuming the spread holds.
Location & tenants
- Location reads 66/100 on livability (#111 in SC) — a middle-class / working-renter tenant base. Strengths: cost of living A+, housing A+; Watch: health & safety C-, amenities F, commute F.
- Abbeville 60 (rural): math 50% / reading 49% proficiency, ranked #15 of 80 in SC (top 19%) — families likely to look elsewhere, expect single-tenant / working-renter base with shorter leases.
- Zoned schools: Long Cane Primary (335 students, 100% FRL); Wright Middle (math 37% / reading 39%, grade F, #86 of 229 statewide, top 39%, 346 students, 100% FRL); Abbeville High (math 77% / reading 77%, grade A-, #28 of 196 statewide, top 16%, 473 students, 74% FRL) — zoned schools average 91% FRL vs 57% district-wide (35 pts higher); higher-poverty schools than district average — tighter screening recommended.
- Market conditions: 109 active listings in the ZIP; 2 comparable units currently listed for rent nearby; 145 units permitted in Abbeville County in 2024 (0 in 5+ unit buildings).
Forward outlook
- In year one you build about $7k of equity ($449 loan paydown + $6k appreciation (10.0% local appreciation)).
- Abbeville County population projected at -17% by 2050 — secular population decline; favor cash flow + early exit over multi-decade hold.
- At projected returns (10.0% appreciation + 3.0% rent growth), your $18k cash investment doubles in ~2 years — after that, you're playing with house money.
- By year 5, paydown + projected appreciation supports a ~$32k cash-out refi (75% LTV) — recoverable capital for the next deal without selling this one.
Negotiation context
- Only 1 days on market — expect competitive offers; lowballing is unlikely to land.
- 2 sale attempts since 10y ago with the ask held roughly flat each time — persistent listings suggest the price (not the market) is what's stuck; bring a comps-based counter.
- Current owner paid $24k; list at $65k implies a 165% gain — meaningful room to come down on a strong offer.
Risks & watch-outs
- Watch-outs: built in 1940 — expect roof / HVAC / electrical / plumbing capex.
- Climate carrying-cost: major wind risk, 27% chance of damaging wind over 30y; extreme-heat days projected 7→17/yr by 2055 (HVAC capex compounding) — expect insurance premiums to compound above CPI over the hold.
Questions for the listing agent
- Built in 1940 — when were the roof, HVAC, electrical panel, plumbing, and water heater last replaced?
- Is there a deadline driving the sale (1031 exchange, divorce, estate, relocation)? That informs how much negotiation room exists.
- What's the average days-on-market for RENTAL listings here right now (not sales)? A rising rental-DOM trend means longer vacancies and softer asking-rent achievability than the comps imply.
- What's the recent tenant-quality profile in this submarket — average credit score on applications, eviction rate, late-payment / NSF rate, and stable-employment percentage? A property-management company in the area should have these aggregated.
- How much new for-sale + rental construction is in the pipeline within 1–3 miles? Heavy new supply typically softens prices + rents 12–24 months out; constrained supply supports both.
Investment metrics
- 1% rule
- 1.66% ✓
- Cap rate
- 13.21%
- Cash-on-cash
- 24.69%
- DSCR
- 2.10
- GRM
- 5.0
CMA / ARV
- ARV (on-the-fly)
- $167,504
- Comps found
- 12
Show comp detail 12 sales within ~0.75 mi
| Address | Dist | Beds/Ba | Sqft | Sold | Price | $/sf | Match |
|---|---|---|---|---|---|---|---|
| 103 Harrisburg St | 0.54mi | 2/2.0 | 1,112 (+1%) | 2mo | $168,900 | $152 | 68 |
| 206 Henry M Turner St | 0.38mi | 2/1.0 | 986 (-10%) | 7mo | $121,000 | $123 | 58 |
| 605 Cherokee St | 0.57mi | 2/1.0 | 1,189 (+8%) | 7mo | $103,000 | $87 | 55 |
| 100 Langley St | 0.52mi | 2/1.5 | 1,060 (-4%) | 16mo | $169,900 | $160 | 54 |
| 216 Vienna St | 0.18mi | 2/1.0 | 955 (-13%) | 19mo | $189,100 | $198 | 54 |
| 102 Langely St | 0.53mi | 2/1.5 | 1,194 (+8%) | 11mo | $178,000 | $149 | 50 |
| 101 Mcgowan Ave | 0.57mi | 2/1.0 | 1,040 (-6%) | 18mo | $96,000 | $92 | 49 |
| 408 Cherokee | 0.38mi | 3/1.5 (+1) | 1,207 (+10%) | 12mo | $121,550 | $101 | 49 |
| 108 Cambridge Drive Dr | 0.43mi | 2/1.0 | 1,000 (-9%) | 21mo | $154,000 | $154 | 47 |
| 707 Brooks | 0.62mi | 2/1.0 | 985 (-11%) | 11mo | $154,000 | $156 | 44 |
| 404 Marshall Ave | 0.73mi | 3/2.0 (+1) | 1,260 (+14%) | 5mo | $240,000 | $190 | 29 |
| 104 Wingfield St | 0.61mi | 3/2.0 (+1) | 1,263 (+15%) | 14mo | $175,000 | $139 | 27 |
Match score weights: distance 35% · size 25% · config 20% · recency 20%. Top-matched comps best support the ARV.
Projected returns pro-forma
10.0% appreciation · 3.0% rent growth · sell at horizon
- IRR
- 42.9%
- Equity multiple
- 4.26×
- Total profit
- $59,288
- Equity at exit
- $58,557
- IRR
- 37.1%
- Equity multiple
- 9.57×
- Total profit
- $155,898
- Equity at exit
- $126,281
Cash invested: $18,200 (down + closing). Projections, not guarantees.
Landlord ↔ Tenant lean methodology
- Overall (STATE)
- 90 Strongly Landlord-Friendly
- State South Carolina
- 90 Strongly Landlord-Friendly · R+6
- County
- — inherits STATE
- City
- — inherits STATE
ZIP-level market 29620
- Home prices YoY
- 15.0%
- Active inventory
- 109
- Price-to-rent
- 5.0×
Monthly cashflow live
- Estimated rent
- $1,076 medium interval (Pro) →
- Mortgage (P&I)
- −$341
- Tax from tax record
- −$108 /mo · $1,291/yr
- Insurance
- −$27
- HOA
- −$0
- Vacancy / Maint / Mgmt
- −$226
- Net cashflow
- $375
Break-even live
Sensitivity live
| Price | -10% $411 | -5% $393 | +0% $375 | +5% $356 | +10% $338 |
|---|---|---|---|---|---|
| Rent | -10% $290 | -5% $332 | +0% $375 | +5% $417 | +10% $460 |
| Rate | -1.0pp $407 | -0.5pp $391 | base $375 | +0.5pp $358 | +1.0pp $341 |
UW: 25.0% down · 7.5% · 30yr · 1.5% tax · 5.0% vac · 8.0% maint · 8.0% mgmt
Financing live
Cash to close
- Down payment
- $16,250
- Closing costs
- $1,950
- Reserves months
- —
- Total cash needed
- —
Loan-product check · same deal, 3 products live
Conventional
25% down · 7.5% · 30yr
- Down + closing
- —
- Monthly P&I
- —
- Monthly cashflow
- —
- DSCR
- —
- Eligible?
- —
Personal DTI + credit; lowest rate.
DSCR
20% down · 8.5% · 30yr
- Down + closing
- —
- Monthly P&I
- —
- Monthly cashflow
- —
- DSCR
- —
- Eligible?
- —
No personal income docs; deal must DSCR.
Hard money
10% down · 12.0% · 12mo
- Down + closing
- —
- Monthly P&I
- —
- Monthly cashflow
- —
- DSCR
- —
- Eligible?
- —
Short-term bridge; refi at stabilization.
Rent comps 2 comps
| Address | Beds | Baths | Sqft | Rent | $/sqft | DOM | Units | Dist |
|---|---|---|---|---|---|---|---|---|
| 508 N Main St Abbeville, SC | 1.0 | 1.0 | 800 | $900 | $1.12 | 4d | 1 | 0.45mi |
| 605 Cherokee St Abbeville, SC | 2.0 | 1.0 | 1100 | $1,245 | $1.13 | 13d | 1 | 0.59mi |
Listing history 5 events
-
2026-05-20status Pending
-
2026-05-18$65,000 Active
-
2016-11-29soldstatus $24,500 271-char remark
Show marketing remark (271 chars)
START HERE. .Affordable 2 bedroom home with a great swing front porch. A perfect starter home or maybe a nice rental. The location is perfect a small easy to maintain yard. The neighborhood is safe and convient to churches, restaurants and downtown shopping in Abbeville.
-
2016-11-29soldstatus $24,500
Show marketing remark (271 chars)
START HERE. .Affordable 2 bedroom home with a great swing front porch. A perfect starter home or maybe a nice rental. The location is perfect a small easy to maintain yard. The neighborhood is safe and convient to churches, restaurants and downtown shopping in Abbeville.
-
2016-05-13$29,900 271-char remark
Show marketing remark (271 chars)
START HERE. .Affordable 2 bedroom home with a great swing front porch. A perfect starter home or maybe a nice rental. The location is perfect a small easy to maintain yard. The neighborhood is safe and convient to churches, restaurants and downtown shopping in Abbeville.
ⓘ Source: listings_history table (triggers on properties + properties_extension) + one-shot
backfill from property_details.listing_events for pre-trigger history.
Tax reassessment forecast SC · Resets to sale price
- Current annual tax
- $1,291 · $108/mo
- Projected year-2 tax
- $1,291 · $108/mo
- Expected delta
- $0/yr ($0/mo · 0.0%)
ⓘ Screening estimate from a state-policy table — verify with the county assessor before closing.
Climate risk First Street
- Flood 1/10 Low FEMA zone X (unshaded) · 0% chance over 30 yrs
- Wildfire 4/10 Moderate
- Heat 6/10 Major 7 d/yr ≥106°F today · 17 d/yr by 30 yrs out
- Wind 6/10 Major 27% chance of damaging wind over 30 yrs
- Air quality 2/10 Low 2 unhealthy d/yr today · 2 by 30 yrs out
Nearby sold comps map
Loading sold comps map…
Walkable amenities ~0.75 mi
Loading nearby amenities…
Taxation est. · year 1
- Rental income
- $12,912
- − Mortgage interest
- −$3,641
- − Property taxes
- −$1,291
- − Insurance
- −$325
- − Repairs & maintenance
- −$1,033
- − Management
- −$1,033
- − Depreciation
- −$1,891
- Taxable income
- $3,699
- Est. tax owed @ 24.0%
- −$888
- After-tax cash flow
- $3,607/yr
For passive investors: Depreciation is non-cash, so a rental often shows a tax loss while cash-flowing — sheltering income. Rental losses are passive: they offset passive income freely, and up to $25,000/yr can offset ordinary (W-2) income if you actively participate and your MAGI is under $100k (phasing out to $0 by $150k); unused losses carry forward. On sale, claimed depreciation is recaptured at up to 25%, and gains may owe capital-gains tax (a 1031 exchange can defer both). Figures are a year-1 estimate at your 24.0% rate — not tax advice; consult a CPA.
Schools (NCES district)
- District
- Abbeville 60
- NCES district ID
- 4500690
- Math proficiency
- 50% ▼ -12.00%
- Reading proficiency
- 49% ▼ -7.00%
- Median HH income
- $34,522
- Composite
- 40.9/100
- National rank
- #3618
- State rank
- #15 of 80 in SC
Livability — Abbeville
- Score
- 66/100
- State rank
- #111
- US rank
- #11534
Category grades
Schools grade is shown separately in the Schools card above.
Census & demographics
- Census place
- Abbeville, SC
- Population (ZIP)
- 12,116
Population outlook (Abbeville County) Hauer SSP2
- Today (2025)
- 24,141 people
- By 2030
- 23,446 · -2.9%
- By 2040
- 21,768 · -9.8%
- By 2050
- 20,098 · -16.7%
- By 2075
- 16,518 · -31.6%
- By 2100
- 13,125 · -45.6%
Race, ethnicity, and origin ACS 2023
- Neighborhood character
- Predominantly White (65%)
- Race & ethnicity
- White 65% Black 30% Two or more races 4% Hispanic / Latino 2%
- Common ancestry
- Italian 2% Serbian 2% Slovak 2%
- Foreign-born
- 2% · Canada, Jamaica
- Languages at home
- 98% English-only · Spanish 2%
Political lean MEDSL · Abbeville
- 2024 margin
- Solid R (+42.4) · D 28.2% · R 70.6% · Other 1.2%
- 2008→2024 swing
- -27.2pp toward R · 2008: -15.2pp · 2024: -42.4pp
- All cycles
- 2024: R+42.4 2020: R+33.1 2016: R+28.3 2012: R+13.4 2008: R+15.2
Not yet ingested
- Civics
- —
Market trends
- HPI YoY
- ▲ 49.52%
- Current HPI
- 379.552
- Rent YoY
- —
- Metro
- —
- State GDP YoY
- ▲ 4.51%
- F500 in state
- 2
Industry mix (Fortune 500 HQ in SC)
| Industry | F500 HQs | Revenue |
|---|---|---|
| Packaging | 1 | $7B |
|
||
Price history
+117.4% since first listed5 events — show timeline
- 2026-05-20 Pending — GAOR
- 2026-05-18 Listed $65,000 GAOR
- 2016-11-29 Sold (Public Records) $24,500 Public Records
- 2016-11-29 Sold (MLS) $24,500 GAOR
- 2016-05-13 Listed $29,900 GAOR
Property tax history
+4.3%/yrLatest (2025): $1,291 · +5.9% YoY. Source: county tax records.
Cash-flow waterfall
monthlySold comps — $/sqft
last 12 mo · ≤1 miLoading sold comps…