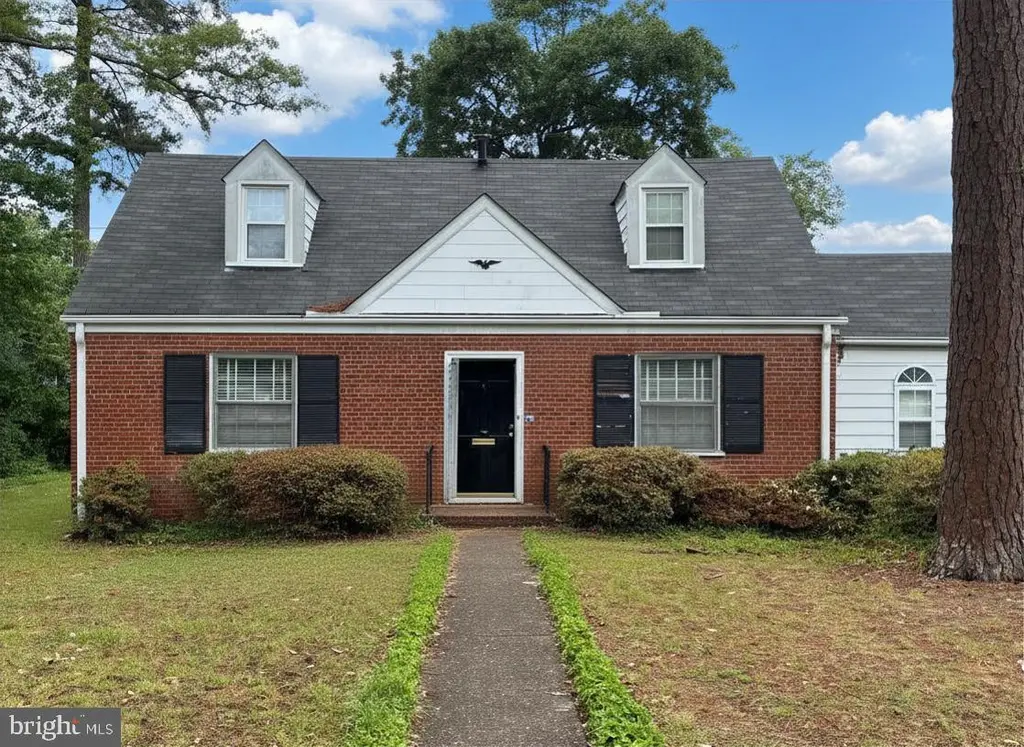
1008 Greenway Ln · Richmond, VA
Flood risk 6/10 · Moderate
- FEMA flood zone
- X (unshaded)
- Chance of flooding over 30 yrs
- 0.69%
- Est. flood insurance / yr
- $507 – $1,088
Fire risk 1/10 · Minimal
- Est. fire insurance / yr
- $666 – $1,236
Heat risk 7/10 · Major
- Hot days now (above 104°F)
- 7 days/yr
- Hot days in 30 yrs
- 17 days/yr
Wind risk 6/10 · Moderate
- Chance of severe wind over 30 yrs
- 27.0%
Air-quality risk 2/10 · Minimal
- Unhealthy air days now
- 0 days/yr
- Unhealthy air days in 30 yrs
- 1 days/yr
Risk factors via First Street. Map © Google.
Why this score? — see what drove the D grade
The composite is a weighted blend of 9 inputs, each scored 0–100. Each bar is that input's sub-score; the figure is the points it added to the 100-point composite (weight × sub-score).
- ARV discount +15.0/15.0
- Cash flow +8.3/30.0
- Rent growth +4.9/5.0
- Livability +4.2/5.0
- Schools +3.3/10.0
- Condition / age +2.5/5.0
- 1% rule +2.3/10.0
- DSCR +2.3/10.0
- Appreciation +0.0/10.0
$375,000
🖨 Deal sheet (PDF) 📄 Offer letter ✓ Due diligence
Listing remarks MLS
Investor's Special. Don't miss out on this Brick Cape with potential. (This property is being sold As-Is. )
Key facts
- 0.24 acre lot
- Built 1951
- Listed 2 days
Property features AI
Finance
- Other: Ownership is fee simple; Year built reported by assessor
Exterior
- Parking: On-street parking
- Utilities: No public sewer system
- Home design: Detached property; Above-grade finished area reported by assessor
- Construction: Brick construction; Crawl space foundation; Includes above-grade and below-grade structures
- Exterior features: Lot dimensions approximately 80 x 97; No tidal water
Interior
- Bedrooms: Two bedrooms on the main level; Two bedrooms on the first upper level
- Bathrooms: One full bathroom on the main level; One full bathroom on the first upper level; Two full bathrooms total
- Heating & cooling: 90% forced air heating; Natural gas heating; Natural gas hot water
- Interior features: Living area reported by assessor; No basement
Neighborhood map
What this means for you Summary
Snapshot
- This is a 4-bed/2.0-bath single-family listed at $375k.
Deal economics
- At list price, monthly cash flow is $-342 ($-4k/yr) — negative.
- To cash-flow at today's rent, offer at most $315k (16.1% below list).
- To meet the 1% rule (rent ≥ 1% of price), the offer needs to be $273k (27.2% below list).
- Recommended offer: $273k (27.2% below list) — sets the bar for 1% rule.
- Cap rate 5.2% vs local median 3.2% in Richmond — top-decile yield for the area; either an underpriced asset or a hidden risk that comps aren't pricing in. Stress-test before assuming the spread holds.
Location & tenants
- Location reads 84/100 on livability (#33 in VA, #793 nationally) — a professional / high-income tenant draw. Strengths: amenities A+, commute A+, health & safety A+; Watch: crime D-.
- Richmond City Public School District (urban): math 32% / reading 47% proficiency, ranked #123 of 131 in VA (top 94%) — families likely to look elsewhere, expect single-tenant / working-renter base with shorter leases; 74% free/reduced lunch — lower-income household profile, screen leases tightly.
- Zoned schools: Mary Munford Elementary (math 70% / reading 70%, grade A-, #313 of 1,108 statewide, top 32%, 433 students, 102% FRL); Albert Hill Middle (math 62% / reading 77%, grade A, #85 of 342 statewide, top 26%, 453 students, 99% FRL); Thomas Jefferson High (math 62% / reading 87%, grade B+, #107 of 319 statewide, top 37%, 816 students, 80% FRL) — zoned schools average 94% FRL vs 74% district-wide (20 pts higher); higher-poverty schools than district average — tighter screening recommended.
- Zoned-school proficiency averages 71% at this address vs 40% district-wide (+32 pts) — the actual schools serving this property are materially stronger than the Richmond City Public School District average implies; a family-tenant draw the district grade alone would hide.
- Market conditions: Rents rising fast (+9.5%/yr); 113 active listings in the ZIP; 13 comparable units currently listed for rent nearby; rentals leasing fast (median 5d on market — plan ~1-2 weeks tenant-placement turnaround); high-income renter base; 2,540 units permitted in Richmond city in 2024 (2,077 in 5+ unit buildings).
Forward outlook
- Local home prices are declining (-3.0%/yr); year-one equity from $3k of loan paydown is wiped out by about $11k of value loss. Plan a longer hold.
- Richmond County population projected at +40% by 2050 — long-run rental-demand tailwind backs the buy-and-hold thesis.
Negotiation context
- Only 2 days on market — expect competitive offers; lowballing is unlikely to land.
- 2 sale attempts with the ask held roughly flat each time — persistent listings suggest the price (not the market) is what's stuck; bring a comps-based counter.
- Current owner paid $20k; list at $375k implies a 1775% gain — meaningful room to come down on a strong offer.
Risks & watch-outs
- Watch-outs: built in 1951 — expect roof / HVAC / electrical / plumbing capex.
- Climate carrying-cost: major flood risk; major wind risk, 27% chance of damaging wind over 30y; extreme-heat days projected 7→17/yr by 2055 (HVAC capex compounding) — expect insurance premiums to compound above CPI over the hold.
Questions for the listing agent
- What do current leases actually rent for vs. the listed asking? Can we see a recent rent roll and the last 12 months of T-12 income?
- Built in 1951 — when were the roof, HVAC, electrical panel, plumbing, and water heater last replaced?
- Is there a deadline driving the sale (1031 exchange, divorce, estate, relocation)? That informs how much negotiation room exists.
- Schools are A-rated — typically a magnet for longer-tenancy family renters. What's the average tenant stay here, and is there a school-zone premium baked into asking?
- Crime grade is D in this area — have there been break-ins, vandalism, or insurance claims at this property in the last 3 years? What carrier currently insures it and at what premium?
- The area grade is low — what's the realistic commute time and amenity access for the typical tenant pool here? Any planned neighborhood developments (good or bad) we should know about?
- What's the average days-on-market for RENTAL listings here right now (not sales)? A rising rental-DOM trend means longer vacancies and softer asking-rent achievability than the comps imply.
- What's the recent tenant-quality profile in this submarket — average credit score on applications, eviction rate, late-payment / NSF rate, and stable-employment percentage? A property-management company in the area should have these aggregated.
- How much new for-sale + rental construction is in the pipeline within 1–3 miles? Heavy new supply typically softens prices + rents 12–24 months out; constrained supply supports both.
Investment metrics
- 1% rule
- 0.73% ✗
- Cap rate
- 5.20%
- Cash-on-cash
- -3.91%
- DSCR
- 0.83
- GRM
- 11.4
CMA / ARV
- ARV (median comp)
- $545,166
- List price
- $375,000
- Delta
- -31.21%
- Verdict
- UNDERPRICED
- Comps
- 20 within 1.0 mi
Show comp detail 12 sales within ~0.75 mi
| Address | Dist | Beds/Ba | Sqft | Sold | Price | $/sf | Match |
|---|---|---|---|---|---|---|---|
| 4811 Bromley Ln | 0.35mi | 3/2.0 (-1) | 1,546 (-1%) | 1mo | $650,000 | $420 | 76 |
| 5310 Snowden Ln | 0.22mi | 3/2.5 (-1) | 1,488 (-5%) | 4mo | $525,000 | $353 | 71 |
| 5019 Patterson Ave | 0.22mi | 3/2.0 (-1) | 1,456 (-7%) | 3mo | $485,000 | $333 | 71 |
| 5612 Wythe Ave | 0.44mi | 3/2.0 (-1) | 1,632 (+4%) | 3mo | $565,000 | $346 | 65 |
| 4809 Cutshaw Ave | 0.49mi | 3/2.0 (-1) | 1,647 (+5%) | 2mo | $775,000 | $471 | 62 |
| 4918 Bromley Ln | 0.28mi | 3/2.0 (-1) | 1,749 (+12%) | 1mo | $682,000 | $390 | 61 |
| 5703 Monumental Ave | 0.46mi | 4/2.0 | 1,767 (+13%) | 0mo | $777,835 | $440 | 57 |
| 4621 Kensington Ave | 0.62mi | 4/2.0 | 1,736 (+11%) | 2mo | $750,000 | $432 | 51 |
| 4805 Park Ave | 0.40mi | 3/1.5 (-1) | 1,350 (-14%) | 2mo | $465,000 | $344 | 50 |
| 4813 Cutshaw Ave | 0.47mi | 3/2.0 (-1) | 1,800 (+15%) | 2mo | $698,841 | $388 | 46 |
| 4513 Cutshaw Ave | 0.74mi | 3/1.5 (-1) | 1,384 (-12%) | 2mo | $625,000 | $452 | 38 |
| 4616 Augusta Ave | 0.70mi | 3/3.0 (-1) | 1,753 (+12%) | 3mo | $605,000 | $345 | 36 |
Match score weights: distance 35% · size 25% · config 20% · recency 20%. Top-matched comps best support the ARV.
Projected returns pro-forma
-3.0% appreciation · 8.0% rent growth · sell at horizon
- IRR
- -17.7%
- Equity multiple
- 0.35×
- Total profit
- $-68,114
- Equity at exit
- $55,914
- IRR
- -2.5%
- Equity multiple
- 0.79×
- Total profit
- $-21,722
- Equity at exit
- $32,423
Cash invested: $105,000 (down + closing). Projections, not guarantees.
Landlord ↔ Tenant lean methodology
- Overall (STATE)
- 55 Moderately Landlord-Leaning
- State Virginia
- 55 Moderately Landlord-Leaning · D+2
- County
- — inherits STATE
- City
- — inherits STATE
ZIP-level market 23226
- Rents YoY
- 9.5%
- Active inventory
- 113
- Price-to-rent
- 11.4×
Monthly cashflow live
- Estimated rent
- $2,731 high interval (Pro) →
- Mortgage (P&I)
- −$1,967
- Tax from tax record
- −$376 /mo · $4,512/yr
- Insurance
- −$156
- HOA
- −$0
- Vacancy / Maint / Mgmt
- −$573
- Net cashflow
- $-342
Break-even live
Sensitivity live
| Price | -10% $-129 | -5% $-236 | +0% $-342 | +5% $-448 | +10% $-554 |
|---|---|---|---|---|---|
| Rent | -10% $-557 | -5% $-450 | +0% $-342 | +5% $-234 | +10% $-126 |
| Rate | -1.0pp $-153 | -0.5pp $-246 | base $-342 | +0.5pp $-439 | +1.0pp $-538 |
UW: 25.0% down · 7.5% · 30yr · 1.5% tax · 5.0% vac · 8.0% maint · 8.0% mgmt
Financing live
Cash to close
- Down payment
- $93,750
- Closing costs
- $11,250
- Reserves months
- —
- Total cash needed
- —
Loan-product check · same deal, 3 products live
Conventional
25% down · 7.5% · 30yr
- Down + closing
- —
- Monthly P&I
- —
- Monthly cashflow
- —
- DSCR
- —
- Eligible?
- —
Personal DTI + credit; lowest rate.
DSCR
20% down · 8.5% · 30yr
- Down + closing
- —
- Monthly P&I
- —
- Monthly cashflow
- —
- DSCR
- —
- Eligible?
- —
No personal income docs; deal must DSCR.
Hard money
10% down · 12.0% · 12mo
- Down + closing
- —
- Monthly P&I
- —
- Monthly cashflow
- —
- DSCR
- —
- Eligible?
- —
Short-term bridge; refi at stabilization.
Rent comps 13 comps
| Address | Beds | Baths | Sqft | Rent | $/sqft | DOM | Units | Dist |
|---|---|---|---|---|---|---|---|---|
| 4800 Patterson Ave Richmond, VA | 3.0 | 1.5 | 1354 | $2,800 | $2.07 | 45d | 1 | 0.47mi |
| 4819 Fitzhugh Ave Richmond, VA | 3.0 | 1.5 | 1162 | $2,500 | $2.15 | 3d | 1 | 0.57mi |
| 5900 Patterson Ave #22 Richmond, VA | 3.0 | 2.5 | 1188 | $2,300 | $1.94 | 45d | 1 | 0.69mi |
| 4613 Stuart Ave Richmond, VA | 3.0 | 2.0 | 2151 | $3,157 | $1.47 | 25d | 1 | 0.73mi |
| 5000 Libbie Mill East Blvd Richmond, VA | 3.0 | 1.0–2.0 | 958 | $2,925 | $3.05 | 3d | 24 | 1.12mi |
| 6410 Morningside Dr Richmond, VA | 3.0 | 1.0 | 1224 | $2,300 | $1.88 | 4d | 1 | 1.14mi |
| 6405 Stuart Ave Richmond, VA | 3.0 | 2.0 | 1207 | $2,250 | $1.86 | 25d | 1 | 1.16mi |
| 6419 Crescent Pkwy Richmond, VA | 3.0 | 2.0 | 1411 | $2,600 | $1.84 | 3d | 1 | 1.21mi |
| 4930 Bethlehem Rd Richmond, VA | 3.0 | 1.5 | 1242 | $2,295 | $1.85 | 3d | 1 | 1.25mi |
| 2351 Wrighthaven Ln Richmond, VA | 1.0–3.0 | 1.0–2.0 | 950 | $2,830 | $2.98 | 3d | 49 | 1.26mi |
| 6306 Engel Rd Richmond, VA | 3.0 | 2.0 | 1376 | $2,400 | $1.74 | 25d | 1 | 1.28mi |
| 4820 Bethlehem Rd Richmond, VA | 4.0 | 2.5 | 2145 | $2,650 | $1.24 | 45d | 1 | 1.34mi |
| 4818 Bethlehem Rd Richmond, VA | 3.0 | 2.0 | 1400 | $2,450 | $1.75 | 4d | 1 | 1.35mi |
Listing history 3 events
-
2026-05-15historical $375,000
-
2026-05-13historical $375,000 107-char remark
Show marketing remark (107 chars)
Investor's Special. Don't miss out on this Brick Cape with potential. (This property is being sold As-Is. )
-
1972-08-31soldstatus $20,000
ⓘ Source: listings_history table (triggers on properties + properties_extension) + one-shot
backfill from property_details.listing_events for pre-trigger history.
Tax reassessment forecast VA · Resets to sale price
- Current annual tax
- $4,512 · $376/mo
- Projected year-2 tax
- $4,512 · $376/mo
- Expected delta
- $0/yr ($0/mo · 0.0%)
ⓘ Screening estimate from a state-policy table — verify with the county assessor before closing.
Climate risk First Street
- Flood 6/10 Major FEMA zone X (unshaded) · 69% chance over 30 yrs
- Wildfire 1/10 Low
- Heat 7/10 Severe 7 d/yr ≥104°F today · 17 d/yr by 30 yrs out
- Wind 6/10 Major 27% chance of damaging wind over 30 yrs
- Air quality 2/10 Low 0 unhealthy d/yr today · 1 by 30 yrs out
Nearby sold comps map
Loading sold comps map…
Walkable amenities ~0.75 mi
Loading nearby amenities…
Taxation est. · year 1
- Rental income
- $32,766
- − Mortgage interest
- −$21,006
- − Property taxes
- −$4,512
- − Insurance
- −$1,875
- − Repairs & maintenance
- −$2,621
- − Management
- −$2,621
- − Depreciation
- −$10,909
- Taxable loss
- −$10,778
- Est. tax savings @ 24.0%
- +$2,587
- After-tax cash flow
- $-1,513/yr
For passive investors: Depreciation is non-cash, so a rental often shows a tax loss while cash-flowing — sheltering income. Rental losses are passive: they offset passive income freely, and up to $25,000/yr can offset ordinary (W-2) income if you actively participate and your MAGI is under $100k (phasing out to $0 by $150k); unused losses carry forward. On sale, claimed depreciation is recaptured at up to 25%, and gains may owe capital-gains tax (a 1031 exchange can defer both). Figures are a year-1 estimate at your 24.0% rate — not tax advice; consult a CPA.
Schools (NCES district)
- District
- Richmond City Public School District
- NCES district ID
- 5103240
- Math proficiency
- 32% ▼ -24.00%
- Reading proficiency
- 47% ▼ -9.00%
- Median HH income
- $40,276
- Composite
- 33.09/100
- National rank
- #5564
- State rank
- #123 of 131 in VA
Livability — Richmond
- Score
- 84/100
- State rank
- #33
- US rank
- #793
Category grades
Schools grade is shown separately in the Schools card above.
Census & demographics
- Census place
- Richmond, VA
- County
- Richmond City · 178,280 people
- City population
- 287,109
- Metro
- Richmond, VA
- Population (ZIP)
- 15,477
- Household income
- $126,655
- Rent vs Own
- Severe rent burden
- 290.0
Population outlook (Richmond County) Hauer SSP2
- Today (2025)
- 262,263 people
- By 2030
- 284,503 · +8.5%
- By 2040
- 327,353 · +24.8%
- By 2050
- 367,946 · +40.3%
- By 2075
- 449,560 · +71.4%
- By 2100
- 500,301 · +90.8%
Race, ethnicity, and origin ACS 2023
- Neighborhood character
- Predominantly White (83%)
- Race & ethnicity
- White 83% Black 6% Two or more races 5% Hispanic / Latino 3% Asian 3%
- Common ancestry
- Slovak 5% Lithuanian 3% Romanian 3%
- Foreign-born
- 7% · Canada, Vietnam, China
- Languages at home
- 91% English-only · Spanish 2% Other Indo-European 2% Arabic 1%
Political lean MEDSL · Richmond
- 2024 margin
- Solid D (+66.3) · D 82.0% · R 15.8% · Other 2.2%
- 2008→2024 swing
- +7.2pp toward D · 2008: 59.1pp · 2024: 66.3pp
- All cycles
- 2024: D+66.3 2020: D+68.0 2016: D+63.8 2012: D+55.7 2008: D+59.1
Not yet ingested
- Civics
- —
Market trends
- HPI YoY
- ▼ -594.80%
- Current HPI
- 324.3243
- Rent YoY
- ▲ 9.49%
- Metro
- Richmond, VA
- State GDP YoY
- ▲ 2.40%
- F500 in state
- 50
Industry mix (Fortune 500 HQ in VA)
| Industry | F500 HQs | Revenue |
|---|---|---|
| Aerospace / Defense | 4 | $236B |
|
||
| Technology / Defense | 3 | $32B |
|
||
| Financial Services | 2 | $176B |
|
||
| Utilities | 2 | $27B |
|
||
| Insurance | 2 | $25B |
|
||
| Technology | 2 | $15B |
|
||
Price history
+1775.0% since first listed7 events — show timeline
- 2026-05-29 Pending — CVRMLS
- 2026-05-29 Pending — BRIGHT MLS
- 2026-05-27 Listed $375,000 BRIGHT MLS
- 2026-05-26 Listed $375,000 CVRMLS
- 2026-05-15 Coming Soon $375,000 BRIGHT MLS
- 2026-05-13 Coming Soon $375,000 CVRMLS
- 1972-08-31 Sold (Public Records) $20,000 Public Records
Property tax history
+6.9%/yrLatest (2022): $4,512 · +35.3% YoY. Source: county tax records.
Cash-flow waterfall
monthlySold comps — $/sqft
last 12 mo · ≤1 miLoading sold comps…