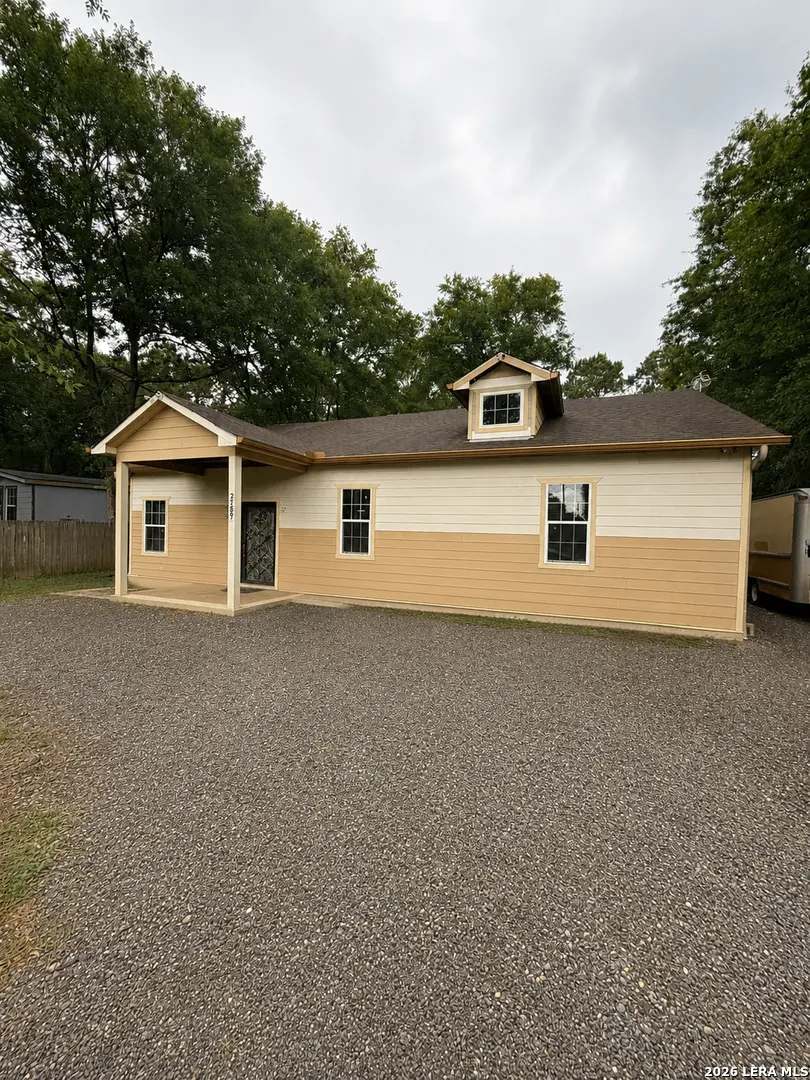
25507 Cambridge Blvd · Roman Forest, TX
Flood risk 1/10 · Minimal
- FEMA flood zone
- X (unshaded)
- Chance of flooding over 30 yrs
- 0.0%
- Est. flood insurance / yr
- $507 – $1,088
Fire risk 5/10 · Moderate
- Est. fire insurance / yr
- $1,222 – $2,270
Heat risk 9/10 · Severe
- Hot days now (above 111°F)
- 7 days/yr
- Hot days in 30 yrs
- 24 days/yr
Wind risk 9/10 · Severe
- Chance of severe wind over 30 yrs
- 99.0%
Air-quality risk 2/10 · Minimal
- Unhealthy air days now
- 2 days/yr
- Unhealthy air days in 30 yrs
- 2 days/yr
Risk factors via First Street. Map © Google.
Why this score? — see what drove the C- grade
The composite is a weighted blend of 9 inputs, each scored 0–100. Each bar is that input's sub-score; the figure is the points it added to the 100-point composite (weight × sub-score).
- Cash flow +19.3/30.0
- ARV discount +7.5/15.0
- 1% rule +7.1/10.0
- DSCR +6.1/10.0
- Livability +3.3/5.0
- Schools +2.8/10.0
- Rent growth +2.6/5.0
- Condition / age +2.5/5.0
- Appreciation +0.0/10.0
$174,999
🖨 Deal sheet 📄 Offer letter ✓ Due diligence
Listing remarks
Welcome to 25507 Cambridge Blvd in New Caney! This spacious 4-bedroom, 2-bath home offers a functional layout with generous living space, great natural light, and plenty of room for entertaining or everyday living. The open-concept feel and well-sized bedrooms make this home perfect for a growing household or anyone looking for extra space. Conveniently located with easy access to major highways, shopping, dining, and the rapidly growing New Caney area, this property offers both comfort and convenience. Being sold AS-IS and priced to move quickly! Seller is motivated and all offers will be considered. Don't miss this opportunity to own a great home with strong potential at an attractive pri
Key facts
- 0.33 acre lot
- Built 2017
- Listed 38 days
Property features AI
Finance
- Other: Possession at closing/funding; For sale (not a short sale)
- HOA & community: Subdivision: OUT/MONTGOMERY; Neighborhood amenities: other (see remarks)
Exterior
- Utilities: Private well; Septic; Low-flow commode; Solar panels
- Home design: Siding exterior; Pre-owned; Approximate age: 9 years
- Construction: Slab foundation; Composition roof
- Exterior features: Covered patio; Privacy fence; Chain link fence; Mature trees; Street paved
Interior
- Kitchen: Kitchen — 8 x 8; Microwave; Stove/Range
- Bedrooms: Master bedroom (lower level) — 13 x 13, ceiling fan, additional features noted in remarks; Bedroom 2 — 12 x 12; Bedroom 3 — 11 x 12; Bedroom 4 — 10 x 11
- Flooring: Carpeting; Ceramic tile
- Bathrooms: 2 full bathrooms; Master bath — shower only (7 x 7)
- Heating & cooling: Central heating (natural gas); Central air conditioning
- Interior features: Ceiling fans; Chandelier; Washer and dryer connections; Microwave; Stove/Range with gas cooking; Living/Dining room combination; Utility room inside; Ground level / no steps; Cable TV available; High-speed internet; Some window coverings remain; All bedrooms downstairs
- Laundry & utility: Washer connection; Dryer connection; Utility room inside
Neighborhood map
What this means for you Summary
Snapshot
- This is a 4-bed/2.0-bath single-family listed at $175k.
Deal economics
- At list price, monthly cash flow is $193 ($2k/yr) — positive.
- The deal already cash-flows at list — no discount required.
- Meets the 1% rule at list price ($2k rent vs $175k).
- Recommended offer: $170k (3.0% below list) — sets the bar for market timing.
- Cap rate 7.6% vs local median 5.0% in Roman Forest — top-decile yield for the area; either an underpriced asset or a hidden risk that comps aren't pricing in. Stress-test before assuming the spread holds.
Location & tenants
- Location reads 66/100 on livability (#595 in TX) — a middle-class / working-renter tenant base. Strengths: employment A+, housing A+, cost of living A; Watch: schools F, crime F, amenities F.
- New Caney ISD (suburban): math 31% / reading 32% proficiency, ranked #570 of 826 in TX (top 69%) — families likely to look elsewhere, expect single-tenant / working-renter base with shorter leases.
- Market conditions: Rents flat; 979 active listings in the ZIP; 4 comparable units currently listed for rent nearby; rentals lingering (median 44d on market — plan ~5-8 weeks vacancy on turnover, expect pricing pressure); 50% of comp listings sitting > 30 days — soft ceiling on asking rent; solid renter incomes; 13,259 units permitted in Montgomery County in 2024 (1,402 in 5+ unit buildings).
- This rent runs 33% of the median local income ($76k/yr) — at the standard rent-burdened threshold; future hikes will face affordability resistance.
Forward outlook
- Local home prices are declining (-3.0%/yr); year-one equity from $1k of loan paydown is wiped out by about $5k of value loss. Plan a longer hold.
- Montgomery County population projected at +65% by 2050 — long-run rental-demand tailwind backs the buy-and-hold thesis.
Negotiation context
- It's been on market 38 days — a 3% lower offer ($170k) is reasonable based on typical stale-listing flexibility.
Risks & watch-outs
- Watch-outs: property tax is 3.4% of price.
- Climate carrying-cost: severe wind risk, 99% chance of damaging wind over 30y; moderate wildfire risk; extreme-heat days projected 7→24/yr by 2055 (HVAC capex compounding) — expect insurance premiums to compound above CPI over the hold.
Questions for the listing agent
- It's been on market 38 days. Have you received any prior offers? Is the seller open to a 3% concession, seller financing, or rate buy-down credit?
- Property tax is high relative to price — has the assessment been appealed recently, and will the sale trigger a re-assessment?
- Is there a deadline driving the sale (1031 exchange, divorce, estate, relocation)? That informs how much negotiation room exists.
- Schools are F-rated, which usually means shorter tenancies and higher turnover. Who's the typical renter profile here, and what's been the actual vacancy rate?
- Crime grade is F in this area — have there been break-ins, vandalism, or insurance claims at this property in the last 3 years? What carrier currently insures it and at what premium?
- What's the average days-on-market for RENTAL listings here right now (not sales)? A rising rental-DOM trend means longer vacancies and softer asking-rent achievability than the comps imply.
- What's the recent tenant-quality profile in this submarket — average credit score on applications, eviction rate, late-payment / NSF rate, and stable-employment percentage? A property-management company in the area should have these aggregated.
- How much new for-sale + rental construction is in the pipeline within 1–3 miles? Heavy new supply typically softens prices + rents 12–24 months out; constrained supply supports both.
Investment metrics
- 1% rule
- 1.21% ✓
- Cap rate
- 7.62%
- Cash-on-cash
- 4.72%
- DSCR
- 1.21
- GRM
- 6.9
CMA / ARV
- ARV (median comp)
- $367,028
- List price
- $174,999
- Delta
- -52.32%
- Verdict
- UNDERPRICED
- Comps
- 20 within 1.0 mi
Show comp detail 12 sales within ~0.75 mi
| Address | Dist | Beds/Ba | Sqft | Sold | Price | $/sf | Match |
|---|---|---|---|---|---|---|---|
| 2214 Hummingbird St | 0.15mi | 4/2.0 | 1,792 (+0%) | 11mo | $335,000 | $187 | 83 |
| 303 Canary St | 0.35mi | 4/2.0 | 1,687 (-6%) | 7mo | $269,990 | $160 | 68 |
| 26221 Peach Creek Dr | 0.58mi | 3/1.5 (-1) | 1,783 (-0%) | 1mo | $130,000 | $73 | 65 |
| 442 Eastwood Dr | 0.54mi | 3/2.0 (-1) | 1,780 (-0%) | 12mo | $343,000 | $193 | 59 |
| 402 Eastwood Dr | 0.45mi | 3/2.0 (-1) | 1,678 (-6%) | 11mo | $299,000 | $178 | 55 |
| 2610 Mockingbird Ln | 0.49mi | 3/2.0 (-1) | 1,630 (-9%) | 5mo | $290,000 | $178 | 54 |
| 607 Shadylake Dr | 0.70mi | 3/2.0 (-1) | 1,762 (-1%) | 11mo | $364,900 | $207 | 51 |
| 218 Chariot Ln | 0.63mi | 4/2.0 | 1,672 (-6%) | 11mo | $254,900 | $152 | 51 |
| 19720 Candlelight St | 0.63mi | 3/2.0 (-1) | 1,900 (+6%) | 8mo | $285,000 | $150 | 49 |
| 503 Caesars Cir | 0.56mi | 3/2.5 (-1) | 1,955 (+10%) | 13mo | $399,000 | $204 | 41 |
| 350 Chariot Ln | 0.65mi | 3/2.0 (-1) | 1,600 (-10%) | 11mo | $699,900 | $437 | 38 |
| 2019 Surry Oaks Dr | 0.62mi | 3/2.5 (-1) | 1,995 (+12%) | 11mo | $350,000 | $175 | 36 |
Match score weights: distance 35% · size 25% · config 20% · recency 20%. Top-matched comps best support the ARV.
Projected returns pro-forma
-3.0% appreciation · 0.21% rent growth · sell at horizon
- IRR
- -12.7%
- Equity multiple
- 0.56×
- Total profit
- $-21,654
- Equity at exit
- $26,093
- IRR
- -9.6%
- Equity multiple
- 0.50×
- Total profit
- $-24,664
- Equity at exit
- $15,131
Cash invested: $49,000 (down + closing). Projections, not guarantees.
Landlord ↔ Tenant lean methodology
- Overall (STATE)
- 87 Strongly Landlord-Friendly
- State Texas
- 87 Strongly Landlord-Friendly · R+5
- County
- — inherits STATE
- City
- — inherits STATE
ZIP-level market 77357
- Home prices YoY
- -24.7%
- Rents YoY
- 0.2%
- Active inventory
- 979
- Price-to-rent
- 6.9×
Monthly cashflow live
- Estimated rent
- $2,117 medium interval (Pro) →
- Mortgage (P&I)
- −$918
- Tax from tax record
- −$489 /mo · $5,863/yr
- Insurance
- −$73
- HOA
- −$0
- Vacancy / Maint / Mgmt
- −$444
- Net cashflow
- $193
Break-even live
UW: 25.0% down · 7.5% · 30yr · 1.5% tax · 5.0% vac · 8.0% maint · 8.0% mgmt
Financing live
Cash to close
- Down payment
- $43,750
- Closing costs
- $5,250
- Reserves months
- —
- Total cash needed
- —
Loan-product check · same deal, 3 products live
Conventional
25% down · 7.5% · 30yr
- Down + closing
- —
- Monthly P&I
- —
- Monthly cashflow
- —
- DSCR
- —
- Eligible?
- —
Personal DTI + credit; lowest rate.
DSCR
20% down · 8.5% · 30yr
- Down + closing
- —
- Monthly P&I
- —
- Monthly cashflow
- —
- DSCR
- —
- Eligible?
- —
No personal income docs; deal must DSCR.
Hard money
10% down · 12.0% · 12mo
- Down + closing
- —
- Monthly P&I
- —
- Monthly cashflow
- —
- DSCR
- —
- Eligible?
- —
Short-term bridge; refi at stabilization.
Rent comps 4 comps
| Address | Beds | Baths | Sqft | Rent | $/sqft | DOM | Units | Dist |
|---|---|---|---|---|---|---|---|---|
| 100 Artesian Way Roman Forest, TX | 3.0 | 3.0 | 1569 | $1,495 | $0.95 | 43d | 1 | 0.64mi |
| 630 Magnolia Bnd Roman Forest, TX | 3.0 | 2.5 | 1450 | $1,545 | $1.07 | 24d | 1 | 0.88mi |
| 634 Magnolia Bnd New Caney, TX | 3.0 | 2.5 | 1450 | $1,485 | $1.02 | 20d | 1 | 0.89mi |
| 2407 S Colosseum Ct New Caney, TX | 4.0 | 3.0 | 2074 | $3,300 | $1.59 | 43d | 1 | 1.21mi |
Listing history 14 events
-
2026-06-18days on market $174,999 Active 38 DOM
-
2026-06-17days on market $174,999 Active 37 DOM
-
2026-06-16days on market $174,999 Active 36 DOM
-
2026-06-15statusdays on market $174,999 Active 35 DOM
-
2026-06-13days on market $174,999 Price Change 33 DOM
-
2026-06-09days on market $174,999 Price Change 29 DOM
-
2026-06-08days on market $174,999 Price Change 28 DOM
-
2026-06-07pricedays on market $174,999 Price Change 27 DOM
-
2026-06-04pricestatusdays on market $178,997 Price Change 24 DOM
-
2026-06-03days on market $184,999 Active 23 DOM
-
2026-06-02days on market $184,999 Active 22 DOM
-
2026-06-01days on market $184,999 Active 21 DOM
-
2026-05-31days on market $184,999 Active 20 DOM
-
2026-05-11$184,999 New 740-char remark
ⓘ Source: listings_history table (triggers on properties + properties_extension) + one-shot
backfill from property_details.listing_events for pre-trigger history.
Tax reassessment forecast TX · Resets to sale price
- Current annual tax
- $5,863 · $489/mo
- Projected year-2 tax
- $5,863 · $489/mo
- Expected delta
- $0/yr ($0/mo · 0.0%)
ⓘ Screening estimate from a state-policy table — verify with the county assessor before closing.
Climate risk First Street
- Flood 1/10 Low FEMA zone X (unshaded) · 0% chance over 30 yrs
- Wildfire 5/10 Major
- Heat 9/10 Extreme 7 d/yr ≥111°F today · 24 d/yr by 30 yrs out
- Wind 9/10 Extreme 99% chance of damaging wind over 30 yrs
- Air quality 2/10 Low 2 unhealthy d/yr today · 2 by 30 yrs out
Nearby sold comps map
Loading sold comps map…
Walkable amenities ~0.75 mi
Loading nearby amenities…
Taxation est. · year 1
- Rental income
- $25,399
- − Mortgage interest
- −$9,803
- − Property taxes
- −$5,863
- − Insurance
- −$875
- − Repairs & maintenance
- −$2,032
- − Management
- −$2,032
- − Depreciation
- −$5,091
- Taxable loss
- −$296
- Est. tax savings @ 24.0%
- +$71
- After-tax cash flow
- $2,386/yr
For passive investors: Depreciation is non-cash, so a rental often shows a tax loss while cash-flowing — sheltering income. Rental losses are passive: they offset passive income freely, and up to $25,000/yr can offset ordinary (W-2) income if you actively participate and your MAGI is under $100k (phasing out to $0 by $150k); unused losses carry forward. On sale, claimed depreciation is recaptured at up to 25%, and gains may owe capital-gains tax (a 1031 exchange can defer both). Figures are a year-1 estimate at your 24.0% rate — not tax advice; consult a CPA.
Schools (NCES district)
- District
- New Caney ISD
- NCES district ID
- 4832400
- Math proficiency
- 31% ▼ -16.00%
- Reading proficiency
- 32% ▼ -6.00%
- Median HH income
- $55,380
- Composite
- 27.97/100
- National rank
- #6857
- State rank
- #570 of 826 in TX
Livability — Roman Forest
- Score
- 66/100
- State rank
- #595
- US rank
- #11338
Category grades
Schools grade is shown separately in the Schools card above.
Census & demographics
- County
- Montgomery County · 663,713 people
- Metro
- Houston-The Woodlands-Sugar Land, TX
- Population (ZIP)
- 37,592
- Household income
- $76,050
- Rent vs Own
- Severe rent burden
- 487.0
Population outlook (Montgomery County) Hauer SSP2
- Today (2025)
- 713,896 people
- By 2030
- 805,263 · +12.8%
- By 2040
- 992,708 · +39.1%
- By 2050
- 1,179,590 · +65.2%
- By 2075
- 1,628,084 · +128.1%
- By 2100
- 1,937,880 · +171.5%
Race, ethnicity, and origin ACS 2023
- Neighborhood character
- Diverse neighborhood (Simpson 0.56)
- Race & ethnicity
- Hispanic / Latino 49% White 45% Two or more races 31% Black 3%
- Hispanic origin (detail)
- Mexican 40%
- Common ancestry
- Lithuanian 2% Romanian 1% Iranian 1%
- Foreign-born
- 23% · Canada, Jamaica
- Languages at home
- 58% English-only · Spanish 40% Other Indo-European 1%
Political lean MEDSL · Montgomery
- 2024 margin
- Solid R (+45.5) · D 26.8% · R 72.3%
- 2008→2024 swing
- +7.2pp toward D · 2008: -52.7pp · 2024: -45.5pp
- All cycles
- 2024: R+45.5 2020: R+43.8 2016: R+51.4 2012: R+60.7 2008: R+52.7
Not yet ingested
- Civics
- —
Market trends
- HPI YoY
- ▼ -87.71%
- Current HPI
- 266.8315
- Rent YoY
- ▲ 0.21%
- Metro
- Houston-The Woodlands-Sugar Land, TX
- State GDP YoY
- ▲ 3.95%
- F500 in state
- 110
Industry mix (Fortune 500 HQ in TX)
| Industry | F500 HQs | Revenue |
|---|---|---|
| Energy | 16 | $1,198B |
|
||
| Technology | 5 | $198B |
|
||
| Engineering / Construction | 4 | $72B |
|
||
| Energy Services | 3 | $60B |
|
||
| Utilities | 3 | $41B |
|
||
| Healthcare | 2 | $330B |
|
||
Price history
-5.4% since first listed3 events — show timeline
- 2026-06-05 Price Changed $174,999 LERA
- 2026-06-04 Price Changed $178,997 LERA
- 2026-05-11 Listed $184,999 LERA
Property tax history
+44.3%/yrLatest (2025): $5,863 · +630.3% YoY. Source: county tax records.
Cash-flow waterfall
monthlySold comps — $/sqft
last 12 mo · ≤1 miLoading sold comps…