 🏗️ New Construction
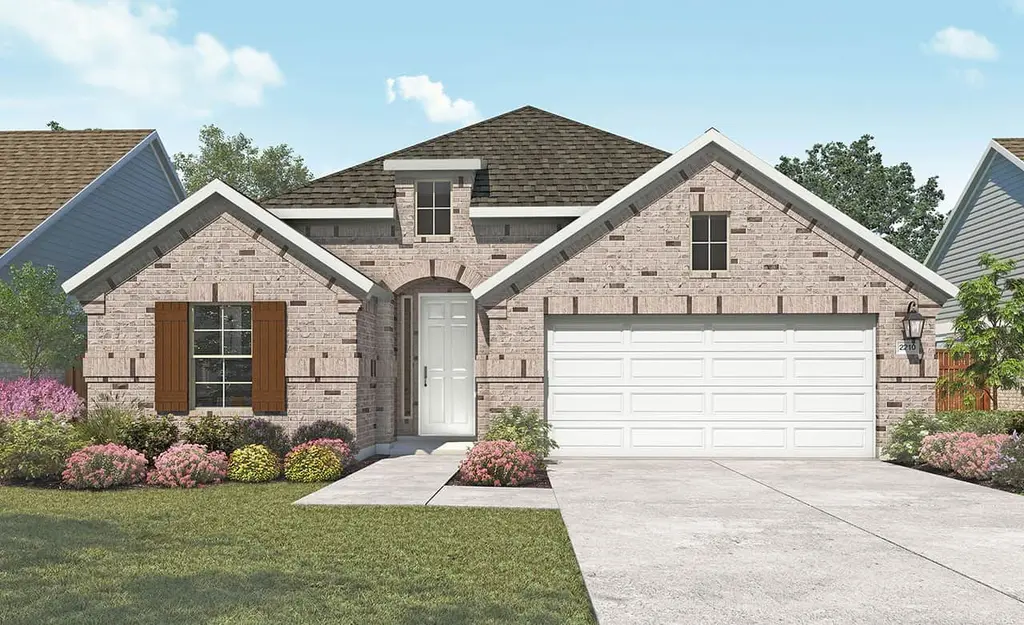
Oleander Plan · Red Oak, TX
Flood risk No data
- FEMA flood zone
- —
- Chance of flooding over 30 yrs
- —
- Est. flood insurance / yr
- —
Fire risk No data
- Est. fire insurance / yr
- —
Heat risk No data
- Hot days now (above threshold)
- —
- Hot days in 30 yrs
- —
Wind risk No data
- Chance of severe wind over 30 yrs
- —
Air-quality risk No data
- Unhealthy air days now
- —
- Unhealthy air days in 30 yrs
- —
Risk factors via First Street. Map © Google.
Why this score? — see what drove the D grade
The composite is a weighted blend of 9 inputs, each scored 0–100. Each bar is that input's sub-score; the figure is the points it added to the 100-point composite (weight × sub-score).
- Cash flow +11.8/30.0
- ARV discount +7.5/15.0
- Condition / age +4.8/5.0
- DSCR +3.5/10.0
- Schools +3.5/10.0
- Livability +3.5/5.0
- 1% rule +3.4/10.0
- Rent growth +3.2/5.0
- Appreciation +0.0/10.0
$374,990
🖨 Deal sheet (PDF) 📄 Offer letter ✓ Due diligence
Listing remarks MLS
The Oleander is a home that adapts beautifully to your needs. From the moment you enter into the spacious entryway, you'll notice the openness and flow of the layout. The island kitchen is the heart of the home, connecting seamlessly with the dining and family room for effortless entertaining or everyday comfort. The primary suite is privately located and features a spa-like bath and oversized closet. Three additional secondary bedrooms are included with a secluded bedroom and full bath at the front of home, for a private guest experience. Imagine the many uses of the flex room, for work, play or entertaining. A tech space for quiet study time and a generously sized pantry highlight just some of the many inspiring features of this home. Designed with flexibility and personalization in mind, the Oleander lets you live just the way you want.
Key facts
- Spa-like bath
- Oversized closet
- Island kitchen
Tags
Neighborhood map
What this means for you Summary
Snapshot
- This is a 4-bed/3.0-bath single-family listed at $375k. Condition is rated excellent.
Deal economics
- At list price, monthly cash flow is $-108 ($-1k/yr) — negative.
- The deal already cash-flows at list — no discount required.
- To meet the 1% rule (rent ≥ 1% of price), the offer needs to be $329k (12.3% below list).
- Recommended offer: $329k (12.3% below list) — sets the bar for 1% rule.
- Cap rate 6.0% vs local median 3.9% in Red Oak — top-decile yield for the area; either an underpriced asset or a hidden risk that comps aren't pricing in. Stress-test before assuming the spread holds.
Location & tenants
- Location reads 69/100 on livability (#435 in TX) — a middle-class / working-renter tenant base. Strengths: employment A+, housing A+, cost of living A; Watch: amenities F, commute F.
- Red Oak ISD (suburban): math 40% / reading 36% proficiency, ranked #384 of 826 in TX (top 46%) — families likely to look elsewhere, expect single-tenant / working-renter base with shorter leases.
- Zoned schools: Shields El (math 34% / reading 36%, grade F, #1,965 of 4,322 statewide, top 46%, 563 students, 60% FRL); Red Oak Middle (math 38% / reading 32%, grade F, #842 of 1,662 statewide, top 51%, 1,546 students, 63% FRL); Red Oak H S (math 50% / reading 50%, grade D+, #495 of 1,632 statewide, top 30%, 2,160 students, 54% FRL) — zoned schools average 59% FRL vs 42% district-wide (18 pts higher); higher-poverty schools than district average — tighter screening recommended.
- Market conditions: Rents rising (+3.0%/yr); 575 active listings in the ZIP; 2 comparable units currently listed for rent nearby; solid renter incomes; 3,016 units permitted in Ellis County in 2024 (20 in 5+ unit buildings).
- This rent runs 39% of the median local income ($100k/yr) — at the standard rent-burdened threshold; future hikes will face affordability resistance.
Forward outlook
- Local home prices are declining (-3.0%/yr); year-one equity from $3k of loan paydown is wiped out by about $12k of value loss. Plan a longer hold.
- Ellis County population projected at +36% by 2050 — long-run rental-demand tailwind backs the buy-and-hold thesis.
Negotiation context
- It's been on market 234 days — a 12% lower offer ($330k) is reasonable based on typical stale-listing flexibility.
Questions for the listing agent
- What do current leases actually rent for vs. the listed asking? Can we see a recent rent roll and the last 12 months of T-12 income?
- It's been on market 234 days. Have you received any prior offers? Is the seller open to a 12% concession, seller financing, or rate buy-down credit?
- Why hasn't it sold? Are there any deal-killer items the seller is aware of (foundation, flood, title, zoning, code violations)?
- Is there a deadline driving the sale (1031 exchange, divorce, estate, relocation)? That informs how much negotiation room exists.
- Schools are D-rated, which usually means shorter tenancies and higher turnover. Who's the typical renter profile here, and what's been the actual vacancy rate?
- The area grade is low — what's the realistic commute time and amenity access for the typical tenant pool here? Any planned neighborhood developments (good or bad) we should know about?
- What's the average days-on-market for RENTAL listings here right now (not sales)? A rising rental-DOM trend means longer vacancies and softer asking-rent achievability than the comps imply.
- What's the recent tenant-quality profile in this submarket — average credit score on applications, eviction rate, late-payment / NSF rate, and stable-employment percentage? A property-management company in the area should have these aggregated.
- How much new for-sale + rental construction is in the pipeline within 1–3 miles? Heavy new supply typically softens prices + rents 12–24 months out; constrained supply supports both.
Investment metrics
- 1% rule
- 0.84% ✗
- Cap rate
- 5.96%
- Cash-on-cash
- -1.18%
- DSCR
- 0.95
- GRM
- 9.9
CMA / ARV
- ARV (median comp)
- $391,364
- List price
- $374,990
- Delta
- -4.18%
- Verdict
- FAIR
- Comps
- 20 within 1.0 mi
Show comp detail 12 sales within ~0.75 mi
| Address | Dist | Beds/Ba | Sqft | Sold | Price | $/sf | Match |
|---|---|---|---|---|---|---|---|
| 1226 Stockton Trl | 0.13mi | 4/3.0 | 2,217 (+0%) | 2mo | $379,990 | $171 | 92 |
| 1321 Stockton Trl | 0.05mi | 4/3.0 | 2,187 (-1%) | 6mo | $404,990 | $185 | 91 |
| 1250 Stockton Trl | 0.07mi | 5/3.0 (+1) | 2,206 (-0%) | 1mo | $399,890 | $181 | 91 |
| 1344 Beaumont Ln | 0.12mi | 4/3.0 | 2,105 (-5%) | 2mo | $414,990 | $197 | 85 |
| 1302 Beaumont Ln | 0.14mi | 4/3.0 | 2,105 (-5%) | 1mo | $419,990 | $200 | 85 |
| 817 Alderwood Dr | 0.32mi | 4/3.0 | 2,211 (0%) | 4mo | $389,990 | $176 | 81 |
| 1111 Sedona Ln | 0.30mi | 5/3.0 (+1) | 2,206 (-0%) | 6mo | $394,990 | $179 | 76 |
| 837 Alderwood Dr | 0.34mi | 4/3.0 | 2,105 (-5%) | 1mo | $419,990 | $200 | 75 |
| 1232 Wrenwood Ln | 0.37mi | 4/2.5 | 2,102 (-5%) | 0mo | $454,000 | $216 | 72 |
| 1300 Stockton Trl | 0.06mi | 3/2.0 (-1) | 2,016 (-9%) | 2mo | $369,990 | $184 | 72 |
| 1317 Rothland Ln | 0.10mi | 4/2.0 | 1,914 (-13%) | 2mo | $389,990 | $204 | 67 |
| 1215 Stockton Ln | 0.16mi | 3/2.0 (-1) | 2,016 (-9%) | 3mo | $359,990 | $179 | 66 |
Match score weights: distance 35% · size 25% · config 20% · recency 20%. Top-matched comps best support the ARV.
Projected returns pro-forma
-3.0% appreciation · 2.99% rent growth · sell at horizon
- IRR
- -18.2%
- Equity multiple
- 0.36×
- Total profit
- $-70,253
- Equity at exit
- $58,354
- IRR
- -10.5%
- Equity multiple
- 0.36×
- Total profit
- $-69,931
- Equity at exit
- $33,838
Cash invested: $109,582 (down + closing). Projections, not guarantees.
Landlord ↔ Tenant lean methodology
- Overall (STATE)
- 87 Strongly Landlord-Friendly
- State Texas
- 87 Strongly Landlord-Friendly · R+5
- County
- — inherits STATE
- City
- — inherits STATE
ZIP-level market 75154
- Home prices YoY
- -18.5%
- Rents YoY
- 3.0%
- Active inventory
- 575
- Price-to-rent
- 9.5×
Monthly cashflow live
- Estimated rent
- $3,287 medium interval (Pro) →
- Mortgage (P&I)
- −$2,052
- Tax est. 1.5%
- −$489 /mo · $5,870/yr
- Insurance
- −$163
- HOA
- −$0
- Vacancy / Maint / Mgmt
- −$690
- Net cashflow
- $-108
Break-even live
Sensitivity live
| Price | -10% $163 | -5% $28 | +0% $-108 | +5% $-243 | +10% $-378 |
|---|---|---|---|---|---|
| Rent | -10% $-367 | -5% $-237 | +0% $-108 | +5% $22 | +10% $152 |
| Rate | -1.0pp $90 | -0.5pp $-8 | base $-108 | +0.5pp $-209 | +1.0pp $-312 |
UW: 25.0% down · 7.5% · 30yr · 1.5% tax · 5.0% vac · 8.0% maint · 8.0% mgmt
Financing live
Cash to close
- Down payment
- $97,841
- Closing costs
- $11,741
- Reserves months
- —
- Total cash needed
- —
Loan-product check · same deal, 3 products live
Conventional
25% down · 7.5% · 30yr
- Down + closing
- —
- Monthly P&I
- —
- Monthly cashflow
- —
- DSCR
- —
- Eligible?
- —
Personal DTI + credit; lowest rate.
DSCR
20% down · 8.5% · 30yr
- Down + closing
- —
- Monthly P&I
- —
- Monthly cashflow
- —
- DSCR
- —
- Eligible?
- —
No personal income docs; deal must DSCR.
Hard money
10% down · 12.0% · 12mo
- Down + closing
- —
- Monthly P&I
- —
- Monthly cashflow
- —
- DSCR
- —
- Eligible?
- —
Short-term bridge; refi at stabilization.
Rent comps 2 comps
| Address | Beds | Baths | Sqft | Rent | $/sqft | DOM | Units | Dist |
|---|---|---|---|---|---|---|---|---|
| 1227 Stockton Trl Red Oak, TX | 4.0 | 3.0 | 2752 | $3,400 | $1.24 | 45d | 1 | 0.11mi |
| 124 Clear Creek Dr Red Oak, TX | 5.0 | 3.5 | 2964 | $2,845 | $0.96 | 26d | 1 | 1.24mi |
Listing history 17 events
-
2026-06-21days on market $374,990 Active 234 DOM
-
2026-06-18days on market $374,990 Active 231 DOM
-
2026-06-17days on market $374,990 Active 230 DOM
-
2026-06-16days on market $374,990 Active 229 DOM
-
2026-06-15days on market $374,990 Active 228 DOM
-
2026-06-13days on market $374,990 Active 226 DOM
-
2026-06-13days on market $374,990 Active 225 DOM
-
2026-06-09days on market $374,990 Active 222 DOM
-
2026-06-08days on market $374,990 Active 221 DOM
-
2026-06-07days on market $374,990 Active 220 DOM
-
2026-06-04days on market $374,990 Active 217 DOM
-
2026-06-03days on market $374,990 Active 216 DOM
-
2026-06-02days on market $374,990 Active 215 DOM
-
2026-06-01days on market $374,990 Active 214 DOM
-
2026-05-31days on market $374,990 Active 213 DOM
-
2026-05-14price $374,990 851-char remark
Show marketing remark (851 chars)
The Oleander is a home that adapts beautifully to your needs. From the moment you enter into the spacious entryway, you'll notice the openness and flow of the layout. The island kitchen is the heart of the home, connecting seamlessly with the dining and family room for effortless entertaining or everyday comfort. The primary suite is privately located and features a spa-like bath and oversized closet. Three additional secondary bedrooms are included with a secluded bedroom and full bath at the front of home, for a private guest experience. Imagine the many uses of the flex room, for work, play or entertaining. A tech space for quiet study time and a generously sized pantry highlight just some of the many inspiring features of this home. Designed with flexibility and personalization in mind, the Oleander lets you live just the way you want.
-
2025-10-30$369,990 Active 851-char remark
Show marketing remark (851 chars)
The Oleander is a home that adapts beautifully to your needs. From the moment you enter into the spacious entryway, you'll notice the openness and flow of the layout. The island kitchen is the heart of the home, connecting seamlessly with the dining and family room for effortless entertaining or everyday comfort. The primary suite is privately located and features a spa-like bath and oversized closet. Three additional secondary bedrooms are included with a secluded bedroom and full bath at the front of home, for a private guest experience. Imagine the many uses of the flex room, for work, play or entertaining. A tech space for quiet study time and a generously sized pantry highlight just some of the many inspiring features of this home. Designed with flexibility and personalization in mind, the Oleander lets you live just the way you want.
ⓘ Source: listings_history table (triggers on properties + properties_extension) + one-shot
backfill from property_details.listing_events for pre-trigger history.
Nearby sold comps map
Loading sold comps map…
Walkable amenities ~0.75 mi
Loading nearby amenities…
Taxation est. · year 1
- Rental income
- $39,449
- − Mortgage interest
- −$21,922
- − Property taxes
- −$5,870
- − Insurance
- −$1,957
- − Repairs & maintenance
- −$3,156
- − Management
- −$3,156
- − Depreciation
- −$11,385
- Taxable loss
- −$7,998
- Est. tax savings @ 24.0%
- +$1,919
- After-tax cash flow
- $629/yr
For passive investors: Depreciation is non-cash, so a rental often shows a tax loss while cash-flowing — sheltering income. Rental losses are passive: they offset passive income freely, and up to $25,000/yr can offset ordinary (W-2) income if you actively participate and your MAGI is under $100k (phasing out to $0 by $150k); unused losses carry forward. On sale, claimed depreciation is recaptured at up to 25%, and gains may owe capital-gains tax (a 1031 exchange can defer both). Figures are a year-1 estimate at your 24.0% rate — not tax advice; consult a CPA.
Condition & rehab AI · 1 photo
This Oleander Plan in Red Oak, TX is in excellent condition with no visible repairs needed. It offers a spacious and well-designed layout with a focus on comfort and functionality. The home is move-in ready and would benefit from minor updates to enhance its curb appeal and interior aesthetics.
Value-add opportunities
- Both Painting exterior and interior — Enhances curb appeal and interior aesthetics
- Both Landscaping improvements — Enhances curb appeal and adds value
- Both New flooring in entryway and kitchen — Improves flow and adds value
- Both New lighting fixtures — Enhances curb appeal and interior aesthetics
Renovation cost estimate screening
Value-add ROI direction
- Both Painting exterior and interior — Enhances curb appeal and interior aesthetics ↑
- Both Landscaping improvements — Enhances curb appeal and adds value ↑
- Both New flooring in entryway and kitchen — Improves flow and adds value ↑
- Both New lighting fixtures — Enhances curb appeal and interior aesthetics ↑
ⓘ Cost ranges are severity-bucket heuristics (US national rule-of-thumb). Get contractor quotes + a written scope before underwriting a rehab budget.
Schools (NCES district)
- District
- Red Oak ISD
- NCES district ID
- 4836660
- Math proficiency
- 40% ▼ -12.00%
- Reading proficiency
- 36% ▼ -9.00%
- Median HH income
- $71,110
- Composite
- 34.88/100
- National rank
- #5084
- State rank
- #384 of 826 in TX
Livability — Red Oak
- Score
- 69/100
- State rank
- #435
- US rank
- #8931
Category grades
Schools grade is shown separately in the Schools card above.
Census & demographics
- Census place
- Red Oak, TX
- County
- Ellis County · 199,237 people
- City population
- 52,516
- Metro
- Dallas-Fort Worth-Arlington, TX
- Population (ZIP)
- 52,516
- Household income
- $100,388
- Rent vs Own
- Severe rent burden
- 1081.0
Population outlook (Ellis County) Hauer SSP2
- Today (2025)
- 194,556 people
- By 2030
- 209,679 · +7.8%
- By 2040
- 238,837 · +22.8%
- By 2050
- 265,451 · +36.4%
- By 2075
- 326,571 · +67.9%
- By 2100
- 362,156 · +86.1%
Race, ethnicity, and origin ACS 2023
- Neighborhood character
- Diverse neighborhood (Simpson 0.69)
- Race & ethnicity
- White 39% Black 30% Hispanic / Latino 27% Two or more races 12% Asian 1% Native American 1%
- Hispanic origin (detail)
- Mexican 25%
- Common ancestry
- Italian 2% Slovak 1%
- Foreign-born
- 9% · Canada, Jamaica
- Languages at home
- 80% English-only · Spanish 18%
Political lean MEDSL · Ellis
- 2024 margin
- Solid R (+31.1) · D 34.0% · R 65.1%
- 2008→2024 swing
- +11.2pp toward D · 2008: -42.2pp · 2024: -31.1pp
- All cycles
- 2024: R+31.1 2020: R+34.1 2016: R+45.4 2012: R+47.5 2008: R+42.2
Not yet ingested
- Civics
- —
Market trends
- HPI YoY
- ▼ -67.06%
- Current HPI
- 294.5836
- Rent YoY
- ▲ 2.99%
- Metro
- Dallas-Fort Worth-Arlington, TX
- State GDP YoY
- ▲ 3.95%
- F500 in state
- 110
Industry mix (Fortune 500 HQ in TX)
| Industry | F500 HQs | Revenue |
|---|---|---|
| Energy | 16 | $1,198B |
|
||
| Technology | 5 | $198B |
|
||
| Engineering / Construction | 4 | $72B |
|
||
| Energy Services | 3 | $60B |
|
||
| Utilities | 3 | $41B |
|
||
| Healthcare | 2 | $330B |
|
||
Price history
+1.4% since first listed2 events — show timeline
- 2026-05-14 Price Changed $374,990 Zillow
- 2025-10-30 Listed $369,990 Zillow
Cash-flow waterfall
monthlySold comps — $/sqft
last 12 mo · ≤1 miLoading sold comps…