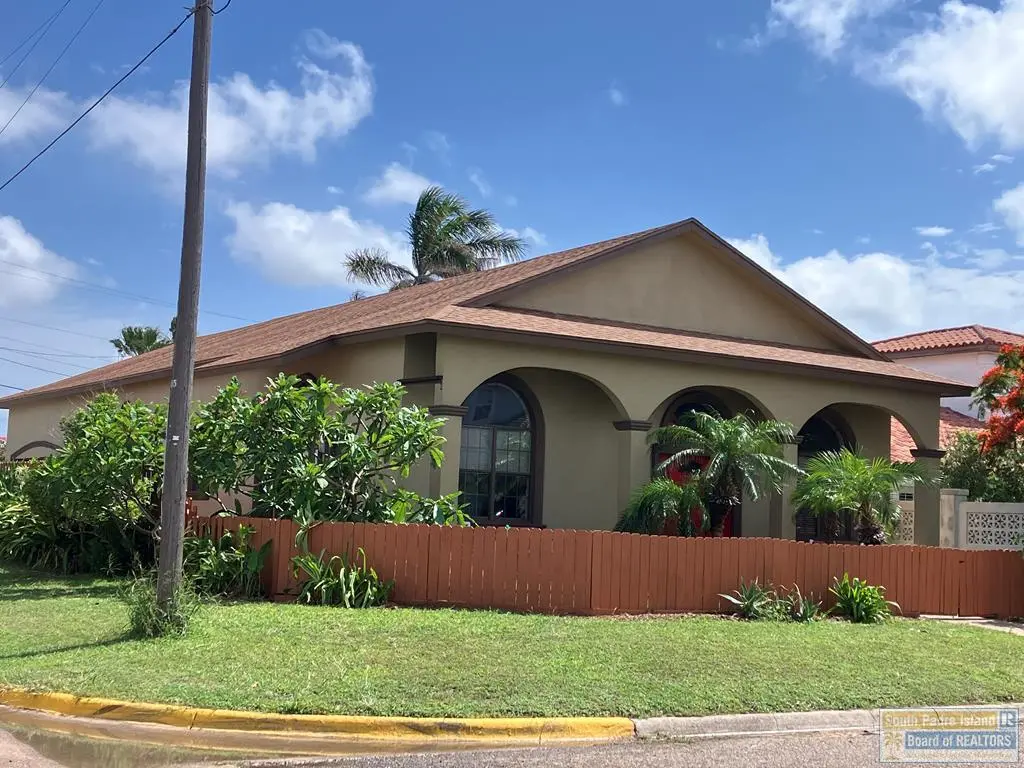
1801 North Shr · Port Isabel, TX
Flood risk 8/10 · Major
- FEMA flood zone
- AE
- Chance of flooding over 30 yrs
- 0.99%
- Est. flood insurance / yr
- $1,737 – $8,500
Fire risk 3/10 · Minor
- Est. fire insurance / yr
- $1,222 – $2,270
Heat risk 10/10 · Severe
- Hot days now (above 107°F)
- 7 days/yr
- Hot days in 30 yrs
- 27 days/yr
Wind risk 9/10 · Severe
- Chance of severe wind over 30 yrs
- 99.0%
Air-quality risk 2/10 · Minimal
- Unhealthy air days now
- 0 days/yr
- Unhealthy air days in 30 yrs
- 1 days/yr
Risk factors via First Street. Map © Google.
Why this score? — see what drove the C+ grade
The composite is a weighted blend of 9 inputs, each scored 0–100. Each bar is that input's sub-score; the figure is the points it added to the 100-point composite (weight × sub-score).
- Cash flow +26.4/30.0
- DSCR +9.0/10.0
- ARV discount +7.5/15.0
- 1% rule +6.9/10.0
- Livability +3.8/5.0
- Rent growth +2.5/5.0
- Condition / age +2.5/5.0
- Schools +1.9/10.0
- Appreciation +0.0/10.0
$436,500
🖨 Deal sheet 📄 Offer letter ✓ Due diligence
Listing remarks MLS
Two story corner lot home with water view of the Laguna Madre. The home has a large beautifully remodeled open kitchen with a lot of storage space, within walking distance to the elementary school in a very established neighborhood, spacious rooms, fenced yard, patio, two car garage with half bath and extra parking space. Close to shopping, restaurants, and public pool. A must see!
Key facts
- Close to walmart
- Close to heb
- Bay view
Tags
Property features AI
Finance
- Financial info: Annual tax amount: $6,000
Exterior
- Parking: Attached garage
- Home design: Single-family residence; Residential property
- Construction: Single Family construction
- Exterior features: Composition roof
Interior
- Bathrooms: 2 full bathrooms; 1 half bathroom
- Interior features: Has a view
Neighborhood map
What this means for you Summary
Snapshot
- This is a 4-bed/2.5-bath single-family listed at $436k.
Deal economics
- At list price, monthly cash flow is $721 ($9k/yr) — positive.
- The deal already cash-flows at list — no discount required.
- Meets the 1% rule at list price ($5k rent vs $436k).
- Recommended offer: $430k (1.5% below list) — sets the bar for market timing.
- Cap rate 9.4% vs local median 3.4% in Port Isabel — top-decile yield for the area; either an underpriced asset or a hidden risk that comps aren't pricing in. Stress-test before assuming the spread holds.
Location & tenants
- Location reads 75/100 on livability (#157 in TX, #4,282 nationally) — a middle-class / working-renter tenant base. Strengths: cost of living A+, housing A+, health & safety A+; Watch: employment D, schools F, crime F.
- Point Isabel ISD (town): math 14% / reading 31% proficiency, ranked #756 of 826 in TX (top 92%) — low school quality limits family demand, transient renter base, plan for 1-2y turnover.
- Market conditions: 254 active listings in the ZIP; 4 comparable units currently listed for rent nearby; rentals lingering (median 44d on market — plan ~5-8 weeks vacancy on turnover, expect pricing pressure); 50% of comp listings sitting > 30 days — soft ceiling on asking rent; 2,326 units permitted in Cameron County in 2024 (503 in 5+ unit buildings).
Forward outlook
- Local home prices are declining (-3.0%/yr); year-one equity from $3k of loan paydown is wiped out by about $13k of value loss. Plan a longer hold.
- Cameron County population projected at +3% by 2050 — modest demand growth; plan on rents tracking national, not racing it.
Negotiation context
- It's been on market 27 days — a 2% lower offer ($430k) is reasonable based on typical stale-listing flexibility.
- 2 sale attempts since 10y ago with the ask held roughly flat each time — persistent listings suggest the price (not the market) is what's stuck; bring a comps-based counter.
Risks & watch-outs
- Watch-outs: flood insurance adds $427/mo.
- Climate carrying-cost: in FEMA flood zone AE (mandatory federal flood insurance); severe wind risk, 99% chance of damaging wind over 30y; extreme-heat days projected 7→27/yr by 2055 (HVAC capex compounding) — expect insurance premiums to compound above CPI over the hold.
Questions for the listing agent
- What's the actual annual flood-insurance premium (NFIP or private), and is the property in a SFHA with mandatory coverage?
- Is there a deadline driving the sale (1031 exchange, divorce, estate, relocation)? That informs how much negotiation room exists.
- Schools are F-rated, which usually means shorter tenancies and higher turnover. Who's the typical renter profile here, and what's been the actual vacancy rate?
- Crime grade is F in this area — have there been break-ins, vandalism, or insurance claims at this property in the last 3 years? What carrier currently insures it and at what premium?
- What's the average days-on-market for RENTAL listings here right now (not sales)? A rising rental-DOM trend means longer vacancies and softer asking-rent achievability than the comps imply.
- What's the recent tenant-quality profile in this submarket — average credit score on applications, eviction rate, late-payment / NSF rate, and stable-employment percentage? A property-management company in the area should have these aggregated.
- How much new for-sale + rental construction is in the pipeline within 1–3 miles? Heavy new supply typically softens prices + rents 12–24 months out; constrained supply supports both.
Investment metrics
- 1% rule
- 1.19% ✓
- Cap rate
- 9.45%
- Cash-on-cash
- 11.26%
- DSCR
- 1.50
- GRM
- 7.0
CMA / ARV
No comps found within radius.
Projected returns pro-forma
-3.0% appreciation · 3.0% rent growth · sell at horizon
- IRR
- -5.4%
- Equity multiple
- 0.80×
- Total profit
- $-24,523
- Equity at exit
- $65,084
- IRR
- 4.4%
- Equity multiple
- 1.32×
- Total profit
- $39,016
- Equity at exit
- $37,741
Cash invested: $122,220 (down + closing). Projections, not guarantees.
Landlord ↔ Tenant lean methodology
- Overall (STATE)
- 87 Strongly Landlord-Friendly
- State Texas
- 87 Strongly Landlord-Friendly · R+5
- County
- — inherits STATE
- City
- — inherits STATE
ZIP-level market 78578
- Home prices YoY
- -21.7%
- Active inventory
- 254
- Price-to-rent
- 7.0×
Monthly cashflow live
- Estimated rent
- $5,213 medium interval (Pro) →
- Mortgage (P&I)
- −$2,289
- Tax from tax record
- −$500 /mo · $6,003/yr
- Insurance
- −$182
- Flood insurance flood zone
- −$427 /mo · $5,118/yr
- HOA
- −$0
- Vacancy / Maint / Mgmt
- −$1,095
- Net cashflow
- $721
Break-even live
UW: 25.0% down · 7.5% · 30yr · 1.5% tax · 5.0% vac · 8.0% maint · 8.0% mgmt
Financing live
Cash to close
- Down payment
- $109,125
- Closing costs
- $13,095
- Reserves months
- —
- Total cash needed
- —
Loan-product check · same deal, 3 products live
Conventional
25% down · 7.5% · 30yr
- Down + closing
- —
- Monthly P&I
- —
- Monthly cashflow
- —
- DSCR
- —
- Eligible?
- —
Personal DTI + credit; lowest rate.
DSCR
20% down · 8.5% · 30yr
- Down + closing
- —
- Monthly P&I
- —
- Monthly cashflow
- —
- DSCR
- —
- Eligible?
- —
No personal income docs; deal must DSCR.
Hard money
10% down · 12.0% · 12mo
- Down + closing
- —
- Monthly P&I
- —
- Monthly cashflow
- —
- DSCR
- —
- Eligible?
- —
Short-term bridge; refi at stabilization.
Rent comps 4 comps
| Address | Beds | Baths | Sqft | Rent | $/sqft | DOM | Units | Dist |
|---|---|---|---|---|---|---|---|---|
| 1113 Pompano Ave Unit 1515052P Port Isabel, TX | 3.0 | 2.0 | 1991 | $7,195 | $3.61 | 13d | 1 | 0.61mi |
| 219 Las Joyas Blvd Port Isabel, TX | 3.0 | 2.5 | 1742 | $3,200 | $1.84 | 43d | 1 | 0.64mi |
| 602 N Shore Dr Port Isabel, TX | 4.0 | 4.5 | 2536 | $5,000 | $1.97 | 43d | 1 | 0.94mi |
| 602 N Shore Dr Port Isabel, TX | 4.0 | 4.5 | 2536 | $5,000 | $1.97 | 21d | 1 | 0.94mi |
Listing history 26 events
-
2026-06-18days on market $436,500 Active 27 DOM
-
2026-06-17days on market $436,500 Active 26 DOM
-
2026-06-16days on market $436,500 Active 25 DOM
-
2026-06-15days on market $436,500 Active 24 DOM
-
2026-06-14days on market $436,500 Active 22 DOM
-
2026-06-13remarks 301-char remark
-
2026-06-13pricedays on market $436,500 Active 21 DOM
-
2026-06-10days on market $450,000 Active 19 DOM
-
2026-06-09days on market $450,000 Active 18 DOM
-
2026-06-09days on market $450,000 Active 17 DOM
-
2026-06-07days on market $450,000 Active 16 DOM
-
2026-06-03days on market $450,000 Active 12 DOM
-
2026-06-02days on market $450,000 Active 11 DOM
-
2026-06-01days on market $450,000 Active 10 DOM
-
2026-05-31days on market $450,000 Active 9 DOM
-
2026-05-30days on market $450,000 Active 8 DOM
-
2026-05-22$450,000 Active
-
2017-01-25soldstatus 384-char remark
Show marketing remark (384 chars)
Two story corner lot home with water view of the Laguna Madre. The home has a large beautifully remodeled open kitchen with a lot of storage space, within walking distance to the elementary school in a very established neighborhood, spacious rooms, fenced yard, patio, two car garage with half bath and extra parking space. Close to shopping, restaurants, and public pool. A must see!
-
2017-01-24soldstatus
-
2016-06-02$229,000 384-char remark
Show marketing remark (384 chars)
Two story corner lot home with water view of the Laguna Madre. The home has a large beautifully remodeled open kitchen with a lot of storage space, within walking distance to the elementary school in a very established neighborhood, spacious rooms, fenced yard, patio, two car garage with half bath and extra parking space. Close to shopping, restaurants, and public pool. A must see!
-
2012-07-02soldstatus 341-char remark
Show marketing remark (341 chars)
Beautiful home on a corner lot with bayviews. This home features 12 ft celings, open layout with an extra large kitchen that faces the living room. The home has a seperate family room with an upstairs perfect for a gameroom. The house has so many amenties that they are hard to list. The home is priced below market value. Motivated Seller!!
-
2012-07-02soldstatus
Show marketing remark (341 chars)
Beautiful home on a corner lot with bayviews. This home features 12 ft celings, open layout with an extra large kitchen that faces the living room. The home has a seperate family room with an upstairs perfect for a gameroom. The house has so many amenties that they are hard to list. The home is priced below market value. Motivated Seller!!
-
2007-01-09soldstatus
-
2002-06-25soldstatus
-
1997-08-29soldstatus
-
1991-11-01soldstatus
ⓘ Source: listings_history table (triggers on properties + properties_extension) + one-shot
backfill from property_details.listing_events for pre-trigger history.
Tax reassessment forecast TX · Resets to sale price
- Current annual tax
- $6,003 · $500/mo
- Projected year-2 tax
- $7,988 · $666/mo
- Expected delta
- +$1,985/yr (+$165/mo · 33.1%)
ⓘ Screening estimate from a state-policy table — verify with the county assessor before closing.
Climate risk First Street
- Flood 8/10 Severe FEMA zone AE · 99% chance over 30 yrs
- Wildfire 3/10 Moderate
- Heat 10/10 Extreme 7 d/yr ≥107°F today · 27 d/yr by 30 yrs out
- Wind 9/10 Extreme 99% chance of damaging wind over 30 yrs
- Air quality 2/10 Low 0 unhealthy d/yr today · 1 by 30 yrs out
Nearby sold comps map
Loading sold comps map…
Walkable amenities ~0.75 mi
Loading nearby amenities…
Taxation est. · year 1
- Rental income
- $62,557
- − Mortgage interest
- −$24,451
- − Property taxes
- −$6,003
- − Insurance
- −$7,301
- − Repairs & maintenance
- −$5,005
- − Management
- −$5,005
- − Depreciation
- −$12,698
- Taxable income
- $2,095
- Est. tax owed @ 24.0%
- −$503
- After-tax cash flow
- $8,145/yr
For passive investors: Depreciation is non-cash, so a rental often shows a tax loss while cash-flowing — sheltering income. Rental losses are passive: they offset passive income freely, and up to $25,000/yr can offset ordinary (W-2) income if you actively participate and your MAGI is under $100k (phasing out to $0 by $150k); unused losses carry forward. On sale, claimed depreciation is recaptured at up to 25%, and gains may owe capital-gains tax (a 1031 exchange can defer both). Figures are a year-1 estimate at your 24.0% rate — not tax advice; consult a CPA.
Schools (NCES district)
- District
- Point Isabel ISD
- NCES district ID
- 4835250
- Math proficiency
- 14% ▼ -24.00%
- Reading proficiency
- 31% ▼ -10.00%
- Median HH income
- $38,115
- Composite
- 18.78/100
- National rank
- #8871
- State rank
- #756 of 826 in TX
Livability — Port Isabel
- Score
- 75/100
- State rank
- #157
- US rank
- #4282
Category grades
Schools grade is shown separately in the Schools card above.
Census & demographics
- Census place
- Port Isabel, TX
- Population (ZIP)
- 10,231
Population outlook (Cameron County) Hauer SSP2
- Today (2025)
- 441,603 people
- By 2030
- 448,113 · +1.5%
- By 2040
- 456,385 · +3.3%
- By 2050
- 456,294 · +3.3%
- By 2075
- 423,851 · -4.0%
- By 2100
- 342,787 · -22.4%
Race, ethnicity, and origin ACS 2023
- Neighborhood character
- Majority Hispanic (63%)
- Race & ethnicity
- Hispanic / Latino 63% White 35% Two or more races 19%
- Hispanic origin (detail)
- Mexican 59%
- Common ancestry
- Lithuanian 2% Romanian 1% Slovak 1%
- Foreign-born
- 18% · Canada
- Languages at home
- 57% English-only · Spanish 42%
Political lean MEDSL · Cameron
- 2024 margin
- Lean R (+5.8) · D 46.7% · R 52.5%
- 2008→2024 swing
- -34.6pp toward R · 2008: 28.8pp · 2024: -5.8pp
- All cycles
- 2024: R+5.8 2020: D+13.2 2016: D+32.5 2012: D+32.4 2008: D+28.8
Not yet ingested
- Civics
- —
Market trends
- HPI YoY
- ▼ -61.69%
- Current HPI
- 222.9501
- Rent YoY
- —
- Metro
- —
- State GDP YoY
- ▲ 3.95%
- F500 in state
- 110
Industry mix (Fortune 500 HQ in TX)
| Industry | F500 HQs | Revenue |
|---|---|---|
| Energy | 16 | $1,198B |
|
||
| Technology | 5 | $198B |
|
||
| Engineering / Construction | 4 | $72B |
|
||
| Energy Services | 3 | $60B |
|
||
| Utilities | 3 | $41B |
|
||
| Healthcare | 2 | $330B |
|
||
Price history
+96.5% since first listed10 events — show timeline
- 2026-05-22 Listed $450,000 SPIBOR
- 2017-01-25 Sold (MLS) — RGVMLS
- 2017-01-24 Sold (Public Records) — Public Records
- 2016-06-02 Listed $229,000 RGVMLS
- 2012-07-02 Sold (Public Records) — Public Records
- 2012-07-02 Sold (MLS) — SPIBOR
- 2007-01-09 Sold (Public Records) — Public Records
- 2002-06-25 Sold (Public Records) — Public Records
- 1997-08-29 Sold (Public Records) — Public Records
- 1991-11-01 Sold (Public Records) — Public Records
Property tax history
+4.5%/yrLatest (2025): $6,003 · +13.5% YoY. Source: county tax records.
Cash-flow waterfall
monthlySold comps — $/sqft
last 12 mo · ≤1 miLoading sold comps…