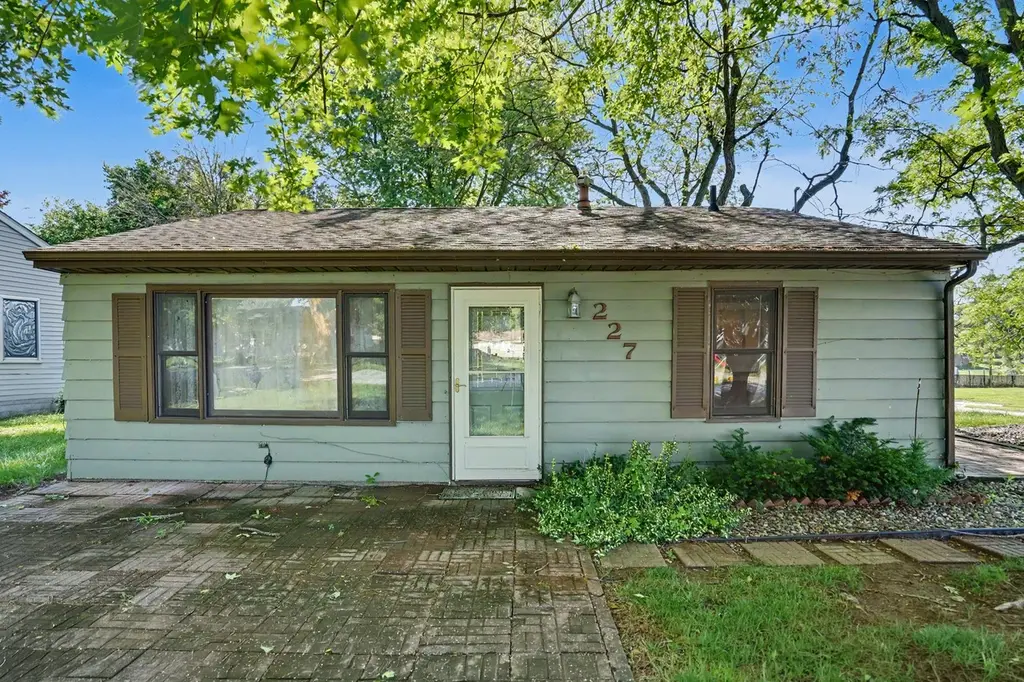
227 S 14th St · Le Claire, IA
Flood risk 1/10 · Minimal
- FEMA flood zone
- X (unshaded)
- Chance of flooding over 30 yrs
- 0.0%
- Est. flood insurance / yr
- $507 – $1,088
Fire risk 1/10 · Minimal
- Est. fire insurance / yr
- $902 – $1,676
Heat risk 3/10 · Minor
- Hot days now (above 104°F)
- 7 days/yr
- Hot days in 30 yrs
- 16 days/yr
Wind risk 2/10 · Minimal
- Chance of severe wind over 30 yrs
- —
Air-quality risk 2/10 · Minimal
- Unhealthy air days now
- 1 days/yr
- Unhealthy air days in 30 yrs
- 2 days/yr
Risk factors via First Street. Map © Google.
Why this score? — see what drove the A- grade
The composite is a weighted blend of 9 inputs, each scored 0–100. Each bar is that input's sub-score; the figure is the points it added to the 100-point composite (weight × sub-score).
- Cash flow +30.0/30.0
- ARV discount +15.0/15.0
- 1% rule +10.0/10.0
- DSCR +10.0/10.0
- Schools +7.6/10.0
- Livability +3.7/5.0
- Rent growth +2.5/5.0
- Condition / age +2.5/5.0
- Appreciation +0.0/10.0
$124,900
🖨 Deal sheet 📄 Offer letter ✓ Due diligence
Listing remarks
This charming 2-bedroom, 1-bath home offers the convenience of one-level living in highly desirable Le Claire, Iowa. Step inside to find an eat in kitchen, large living room, 2 nice sized bedrooms, main floor laundry and a spacious family room perfect for relaxing or entertaining. The updated bathroom features a beautiful walk-in shower. Outside, enjoy the private patio area ideal for morning coffee or summer evenings, plus a detached 2-car garage offering plenty of storage and parking. Nice corner lot and conveniently located near shopping, dining, parks, and everything Le Claire has to offer, this home combines comfort, convenience, and charm in one attractive package. Don't miss your opp
Key facts
- Eat in kitchen
- Main floor laundry
- Private patio area
Tags
Property features AI
Finance
- HOA & community: No master association fee required
Exterior
- Parking: Detached garage with garage door opener (2 garage spaces, 2 total parking spaces); Garage owned
- Utilities: Public water; Public sewer
- Home design: Detached single-family home; One-story
- Construction: Wood siding exterior; Asphalt roof; Concrete perimeter foundation; Built approximately 61–70 years ago; Built before 1978
- Exterior features: Patio; Corner, level lot
Interior
- Kitchen: Eating area / table space; Electric oven; Range; Refrigerator; Portable dishwasher
- Bedrooms: Two bedrooms (both on main level); Primary bedroom on main level, carpeted (approx. 11 x 10); Second bedroom on main level, carpeted (approx. 8 x 13)
- Flooring: Carpeted living areas and bedrooms
- Bathrooms: One full bathroom
- Heating & cooling: Natural gas heating; Window air conditioning units
- Interior features: Five total rooms; Main-level living areas
- Laundry & utility: Main-level laundry (in unit and common area accessible); Washer; Dryer
Neighborhood map
What this means for you Summary
Snapshot
- This is a 2-bed/1.0-bath single-family listed at $125k.
Deal economics
- At list price, monthly cash flow is $1k ($15k/yr) — positive.
- The deal already cash-flows at list — no discount required.
- Meets the 1% rule at list price ($3k rent vs $125k).
- Cap rate 18.6% vs local median 4.6% in Le Claire — top-decile yield for the area; either an underpriced asset or a hidden risk that comps aren't pricing in. Stress-test before assuming the spread holds.
Location & tenants
- Location reads 74/100 on livability (#256 in IA, #4,947 nationally) — a middle-class / working-renter tenant base. Strengths: schools A+, crime A+, housing A+; Watch: amenities F, commute F, health & safety F.
- Pleasant Valley Community School District (suburban): math 87% / reading 85% proficiency, ranked #5 of 289 in IA (top 2%) — strong family-tenant draw, lease renewals of 3-5y typical; only 8% free/reduced lunch — higher-income household profile.
- Market conditions: 80 active listings in the ZIP; 805 units permitted in Scott County in 2024 (479 in 5+ unit buildings).
Forward outlook
- Local home prices are declining (-3.0%/yr); year-one equity from $864 of loan paydown is wiped out by about $4k of value loss. Plan a longer hold.
- Scott County population projected at +19% by 2050 — long-run rental-demand tailwind backs the buy-and-hold thesis.
- At projected returns (-3.0% appreciation + 3.0% rent growth), your $35k cash investment doubles in ~3 years — after that, you're playing with house money.
Negotiation context
- Only 2 days on market — expect competitive offers; lowballing is unlikely to land.
Risks & watch-outs
- Watch-outs: built in 1959 — expect roof / HVAC / electrical / plumbing capex.
Questions for the listing agent
- Built in 1959 — when were the roof, HVAC, electrical panel, plumbing, and water heater last replaced?
- Is there a deadline driving the sale (1031 exchange, divorce, estate, relocation)? That informs how much negotiation room exists.
- Schools are A-rated — typically a magnet for longer-tenancy family renters. What's the average tenant stay here, and is there a school-zone premium baked into asking?
- What's the average days-on-market for RENTAL listings here right now (not sales)? A rising rental-DOM trend means longer vacancies and softer asking-rent achievability than the comps imply.
- What's the recent tenant-quality profile in this submarket — average credit score on applications, eviction rate, late-payment / NSF rate, and stable-employment percentage? A property-management company in the area should have these aggregated.
- How much new for-sale + rental construction is in the pipeline within 1–3 miles? Heavy new supply typically softens prices + rents 12–24 months out; constrained supply supports both.
Investment metrics
- 1% rule
- 2.17% ✓
- Cap rate
- 18.57%
- Cash-on-cash
- 43.85%
- DSCR
- 2.95
- GRM
- 3.8
CMA / ARV
- ARV (on-the-fly)
- $233,248
- Comps found
- 10
Show comp detail 10 sales within ~0.75 mi
| Address | Dist | Beds/Ba | Sqft | Sold | Price | $/sf | Match |
|---|---|---|---|---|---|---|---|
| 321 S 14th St | 0.06mi | 2/1.0 | 1,176 (-1%) | 14mo | $150,000 | $128 | 85 |
| 201 S 12th St | 0.14mi | 3/2.0 (+1) | 1,176 (-1%) | 14mo | $250,000 | $213 | 72 |
| 1208 Jones St | 0.21mi | 3/2.0 (+1) | 1,090 (-8%) | 4mo | $215,000 | $197 | 65 |
| 1124 Jones St | 0.22mi | 3/1.0 (+1) | 1,204 (+2%) | 21mo | $195,000 | $162 | 64 |
| 1305 Wisconsin St | 0.15mi | 3/2.0 (+1) | 1,309 (+11%) | 3mo | $241,500 | $184 | 64 |
| 814 Jones St | 0.40mi | 3/2.0 (+1) | 1,077 (-9%) | 0mo | $320,000 | $297 | 57 |
| 500 May St | 0.62mi | 3/1.5 (+1) | 1,152 (-3%) | 6mo | $250,000 | $217 | 54 |
| 648 Mississippi Ter | 0.51mi | 2/2.0 | 1,263 (+7%) | 20mo | $245,000 | $194 | 45 |
| 723 Dodge St | 0.41mi | 3/1.0 (+1) | 1,062 (-10%) | 21mo | $222,000 | $209 | 41 |
| 725 Cox Ct | 0.50mi | 2/2.5 | 1,352 (+14%) | 10mo | $215,000 | $159 | 39 |
Match score weights: distance 35% · size 25% · config 20% · recency 20%. Top-matched comps best support the ARV.
Projected returns pro-forma
-3.0% appreciation · 3.0% rent growth · sell at horizon
- IRR
- 40.8%
- Equity multiple
- 2.75×
- Total profit
- $61,196
- Equity at exit
- $18,623
- IRR
- 47.1%
- Equity multiple
- 5.53×
- Total profit
- $158,259
- Equity at exit
- $10,799
Cash invested: $34,972 (down + closing). Projections, not guarantees.
Landlord ↔ Tenant lean methodology
- Overall (STATE)
- 83 Strongly Landlord-Friendly
- State Iowa
- 83 Strongly Landlord-Friendly · R+6
- County
- — inherits STATE
- City
- — inherits STATE
ZIP-level market 52753
- Home prices YoY
- -31.0%
- Active inventory
- 80
- Price-to-rent
- 3.8×
Monthly cashflow live
- Estimated rent
- $2,708 medium interval (Pro) →
- Mortgage (P&I)
- −$655
- Tax from tax record
- −$154 /mo · $1,854/yr
- Insurance
- −$52
- HOA
- −$0
- Vacancy / Maint / Mgmt
- −$569
- Net cashflow
- $1,278
Break-even live
UW: 25.0% down · 7.5% · 30yr · 1.5% tax · 5.0% vac · 8.0% maint · 8.0% mgmt
Financing live
Cash to close
- Down payment
- $31,225
- Closing costs
- $3,747
- Reserves months
- —
- Total cash needed
- —
Loan-product check · same deal, 3 products live
Conventional
25% down · 7.5% · 30yr
- Down + closing
- —
- Monthly P&I
- —
- Monthly cashflow
- —
- DSCR
- —
- Eligible?
- —
Personal DTI + credit; lowest rate.
DSCR
20% down · 8.5% · 30yr
- Down + closing
- —
- Monthly P&I
- —
- Monthly cashflow
- —
- DSCR
- —
- Eligible?
- —
No personal income docs; deal must DSCR.
Hard money
10% down · 12.0% · 12mo
- Down + closing
- —
- Monthly P&I
- —
- Monthly cashflow
- —
- DSCR
- —
- Eligible?
- —
Short-term bridge; refi at stabilization.
Listing history 4 events
-
2026-06-15status $124,900 Pending 2 DOM
-
2026-06-15days on market $124,900 Active 2 DOM
-
2026-06-14remarks 699-char remark
-
2026-06-14$124,900 Active 1 DOM
ⓘ Source: listings_history table (triggers on properties + properties_extension) + one-shot
backfill from property_details.listing_events for pre-trigger history.
Tax reassessment forecast IA · Partial reset (capped growth)
- Current annual tax
- $1,854 · $154/mo
- Projected year-2 tax
- $1,907 · $159/mo
- Expected delta
- +$53/yr (+$4/mo · 2.9%)
ⓘ Screening estimate from a state-policy table — verify with the county assessor before closing.
Climate risk First Street
- Flood 1/10 Low FEMA zone X (unshaded) · 0% chance over 30 yrs
- Wildfire 1/10 Low
- Heat 3/10 Moderate 7 d/yr ≥104°F today · 16 d/yr by 30 yrs out
- Wind 2/10 Low
- Air quality 2/10 Low 1 unhealthy d/yr today · 2 by 30 yrs out
Nearby sold comps map
Loading sold comps map…
Walkable amenities ~0.75 mi
Loading nearby amenities…
Taxation est. · year 1
- Rental income
- $32,499
- − Mortgage interest
- −$6,996
- − Property taxes
- −$1,854
- − Insurance
- −$624
- − Repairs & maintenance
- −$2,600
- − Management
- −$2,600
- − Depreciation
- −$3,633
- Taxable income
- $14,191
- Est. tax owed @ 24.0%
- −$3,406
- After-tax cash flow
- $11,930/yr
For passive investors: Depreciation is non-cash, so a rental often shows a tax loss while cash-flowing — sheltering income. Rental losses are passive: they offset passive income freely, and up to $25,000/yr can offset ordinary (W-2) income if you actively participate and your MAGI is under $100k (phasing out to $0 by $150k); unused losses carry forward. On sale, claimed depreciation is recaptured at up to 25%, and gains may owe capital-gains tax (a 1031 exchange can defer both). Figures are a year-1 estimate at your 24.0% rate — not tax advice; consult a CPA.
Schools (NCES district)
- District
- Pleasant Valley Community School District
- NCES district ID
- 1923110
- Math proficiency
- 87% ▼ -4.00%
- Reading proficiency
- 85% ▼ -2.00%
- Median HH income
- $80,716
- Composite
- 75.59/100
- National rank
- #130
- State rank
- #5 of 289 in IA
Livability — Le Claire
- Score
- 74/100
- State rank
- #256
- US rank
- #4947
Category grades
Schools grade is shown separately in the Schools card above.
Census & demographics
- Census place
- Le Claire, IA
- Population (ZIP)
- 6,111
Population outlook (Scott County) Hauer SSP2
- Today (2025)
- 188,878 people
- By 2030
- 196,648 · +4.1%
- By 2040
- 210,860 · +11.6%
- By 2050
- 224,359 · +18.8%
- By 2075
- 258,884 · +37.1%
- By 2100
- 286,447 · +51.7%
Race, ethnicity, and origin ACS 2023
- Neighborhood character
- Predominantly White (91%)
- Race & ethnicity
- White 91% Two or more races 5% Asian 2% Hispanic / Latino 1%
- Common ancestry
- Serbian 3% Italian 3% Slovak 2%
- Foreign-born
- 0% · Canada
- Languages at home
- 99% English-only · Spanish 1%
Political lean MEDSL · Scott
- 2024 margin
- Toss-up / Even · D 47.3% · R 51.2% · Other 1.4%
- 2008→2024 swing
- -18.4pp toward R · 2008: 14.6pp · 2024: -3.9pp
- All cycles
- 2024: R+3.9 2020: D+3.5 2016: D+1.4 2012: D+13.8 2008: D+14.6
Not yet ingested
- Civics
- —
Market trends
- HPI YoY
- ▼ -91.47%
- Current HPI
- 203.798
- Rent YoY
- —
- Metro
- —
- State GDP YoY
- ▲ 2.48%
- F500 in state
- 4
Industry mix (Fortune 500 HQ in IA)
| Industry | F500 HQs | Revenue |
|---|---|---|
| Financial Services | 1 | $16B |
|
||
| Retail / Convenience | 1 | $15B |
|
||
Price history
1 event — show timeline
- 2026-06-13 Listed $124,900 MRED as Distributed by MLS Grid
Property tax history
+2.1%/yrLatest (2025): $1,854 · -1.3% YoY. Source: county tax records.
Cash-flow waterfall
monthlySold comps — $/sqft
last 12 mo · ≤1 miLoading sold comps…