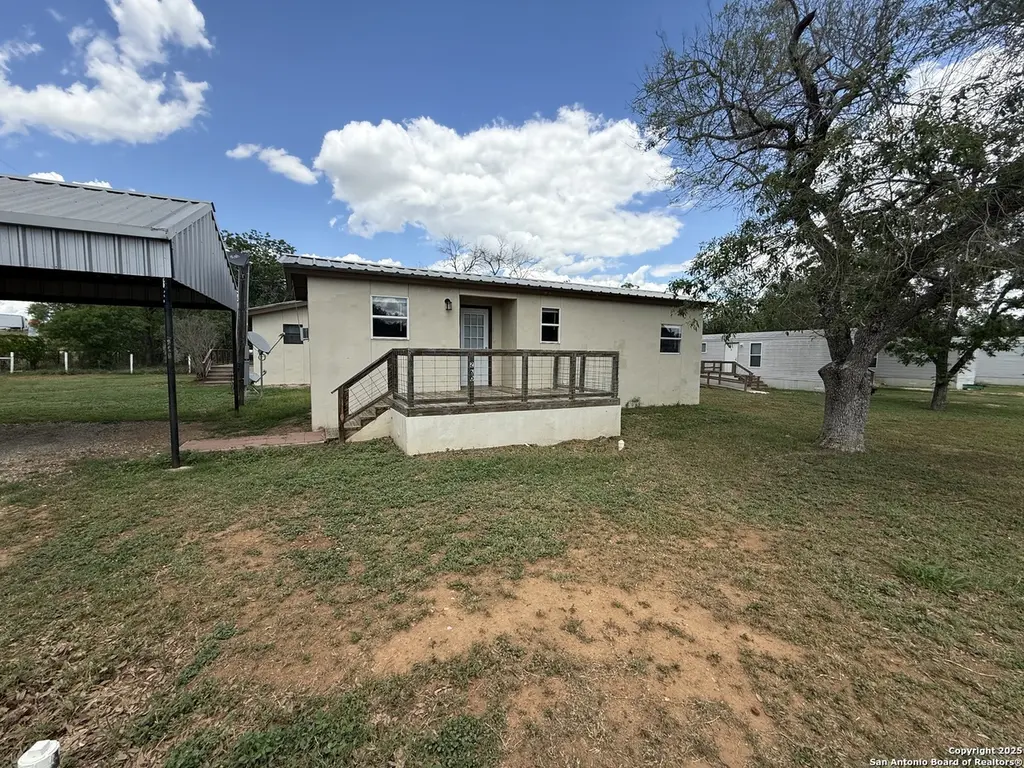
13338 Interstate 35 · Moore, TX
Flood risk No data
- FEMA flood zone
- —
- Chance of flooding over 30 yrs
- —
- Est. flood insurance / yr
- —
Fire risk No data
- Est. fire insurance / yr
- —
Heat risk No data
- Hot days now (above threshold)
- —
- Hot days in 30 yrs
- —
Wind risk No data
- Chance of severe wind over 30 yrs
- —
Air-quality risk No data
- Unhealthy air days now
- —
- Unhealthy air days in 30 yrs
- —
Risk factors via First Street. Map © Google.
Why this score? — see what drove the C+ grade
The composite is a weighted blend of 9 inputs, each scored 0–100. Each bar is that input's sub-score; the figure is the points it added to the 100-point composite (weight × sub-score).
- Cash flow +26.1/30.0
- DSCR +8.8/10.0
- ARV discount +7.5/15.0
- 1% rule +6.9/10.0
- Appreciation +5.6/10.0
- Rent growth +2.5/5.0
- Condition / age +2.2/5.0
- Livability +1.8/5.0
- Schools +1.3/10.0
$139,900
🖨 Deal sheet 📄 Offer letter ✓ Due diligence
Listing remarks MLS
2 homes on 1 tract of land in Moore, TX. Each home is a 1 bedroom 1 bathroom with a large living area. Complete with city water, electric, and sewer system. Perfect for investment or somebody wanting two separate homes for family or to rent out for investment. Live in one home and rent out the other?? Lots of potential. Right off the I-35 access rd with 3 to 4 space carport conveys with the sale. Keep a RV on site if you wish. Adjacent property next door with 3 manufactured homes also for sale! Seller will finance if needed!!
Key facts
- Large living area
- Rv on site
- 3 to 4 car carport
Tags
Neighborhood map
What this means for you Summary
Snapshot
- This is a 2-bed/2.0-bath manufactured listed at $140k. Condition is rated fair.
Deal economics
- At list price, monthly cash flow is $351 ($4k/yr) — positive.
- The deal already cash-flows at list — no discount required.
- Meets the 1% rule at list price ($2k rent vs $140k).
- Recommended offer: $123k (12.0% below list) — sets the bar for market timing.
Location & tenants
- Location reads 35/100 on livability (#1,662 in TX) — a limited-amenity area; tenant pool skews transient or value-seeking. Strengths: cost of living A+, crime A; Watch: schools F, amenities F, commute F.
- Pearsall ISD (town): math 12% / reading 19% proficiency, ranked #810 of 826 in TX (top 98%) — low school quality limits family demand, transient renter base, plan for 1-2y turnover; 76% free/reduced lunch — lower-income household profile, screen leases tightly.
- Market conditions: 118 active listings in the ZIP; 12 units permitted in Frio County in 2024 (0 in 5+ unit buildings).
Forward outlook
- In year one you build about $3k of equity ($967 loan paydown + $2k appreciation (1.1% local appreciation)).
- Frio County population projected at +50% by 2050 — long-run rental-demand tailwind backs the buy-and-hold thesis.
- At projected returns (1.1% appreciation + 3.0% rent growth), your $39k cash investment doubles in ~6 years — after that, you're playing with house money.
Negotiation context
- It's been on market 394 days — a 12% lower offer ($123k) is reasonable based on typical stale-listing flexibility.
Questions for the listing agent
- It's been on market 394 days. Have you received any prior offers? Is the seller open to a 12% concession, seller financing, or rate buy-down credit?
- Have any recent inspections been done? Can we get a copy of the seller's disclosures and any deferred-maintenance estimates?
- Why hasn't it sold? Are there any deal-killer items the seller is aware of (foundation, flood, title, zoning, code violations)?
- Is there a deadline driving the sale (1031 exchange, divorce, estate, relocation)? That informs how much negotiation room exists.
- Schools are F-rated, which usually means shorter tenancies and higher turnover. Who's the typical renter profile here, and what's been the actual vacancy rate?
- What's the average days-on-market for RENTAL listings here right now (not sales)? A rising rental-DOM trend means longer vacancies and softer asking-rent achievability than the comps imply.
- What's the recent tenant-quality profile in this submarket — average credit score on applications, eviction rate, late-payment / NSF rate, and stable-employment percentage? A property-management company in the area should have these aggregated.
- How much new for-sale + rental construction is in the pipeline within 1–3 miles? Heavy new supply typically softens prices + rents 12–24 months out; constrained supply supports both.
Investment metrics
- 1% rule
- 1.19% ✓
- Cap rate
- 9.30%
- Cash-on-cash
- 10.74%
- DSCR
- 1.48
- GRM
- 7.0
CMA / ARV
No comps found within radius.
Projected returns pro-forma
1.14% appreciation · 3.0% rent growth · sell at horizon
- IRR
- 12.9%
- Equity multiple
- 1.66×
- Total profit
- $25,950
- Equity at exit
- $48,806
- IRR
- 16.4%
- Equity multiple
- 3.02×
- Total profit
- $78,935
- Equity at exit
- $65,675
Cash invested: $39,172 (down + closing). Projections, not guarantees.
Landlord ↔ Tenant lean methodology
- Overall (STATE)
- 87 Strongly Landlord-Friendly
- State Texas
- 87 Strongly Landlord-Friendly · R+5
- County
- — inherits STATE
- City
- — inherits STATE
ZIP-level market 78057
- Home prices YoY
- 1.4%
- Active inventory
- 118
- Price-to-rent
- 7.0×
Monthly cashflow live
- Estimated rent
- $1,668 medium interval (Pro) →
- Mortgage (P&I)
- −$734
- Tax est. 1.5%
- −$175 /mo · $2,098/yr
- Insurance
- −$58
- HOA
- −$0
- Vacancy / Maint / Mgmt
- −$350
- Net cashflow
- $351
Break-even live
UW: 25.0% down · 7.5% · 30yr · 1.5% tax · 5.0% vac · 8.0% maint · 8.0% mgmt
Financing live
Cash to close
- Down payment
- $34,975
- Closing costs
- $4,197
- Reserves months
- —
- Total cash needed
- —
Loan-product check · same deal, 3 products live
Conventional
25% down · 7.5% · 30yr
- Down + closing
- —
- Monthly P&I
- —
- Monthly cashflow
- —
- DSCR
- —
- Eligible?
- —
Personal DTI + credit; lowest rate.
DSCR
20% down · 8.5% · 30yr
- Down + closing
- —
- Monthly P&I
- —
- Monthly cashflow
- —
- DSCR
- —
- Eligible?
- —
No personal income docs; deal must DSCR.
Hard money
10% down · 12.0% · 12mo
- Down + closing
- —
- Monthly P&I
- —
- Monthly cashflow
- —
- DSCR
- —
- Eligible?
- —
Short-term bridge; refi at stabilization.
Listing history 16 events
-
2026-06-18days on market $139,900 Active 394 DOM
-
2026-06-17days on market $139,900 Active 393 DOM
-
2026-06-16days on market $139,900 Active 392 DOM
-
2026-06-15days on market $139,900 Active 391 DOM
-
2026-06-15days on market $139,900 Active 390 DOM
-
2026-06-13days on market $139,900 Active 389 DOM
-
2026-06-12days on market $139,900 Active 388 DOM
-
2026-06-10days on market $139,900 Active 385 DOM
-
2026-06-08days on market $139,900 Active 384 DOM
-
2026-06-08days on market $139,900 Active 383 DOM
-
2026-06-05days on market $139,900 Active 381 DOM
-
2026-06-03days on market $139,900 Active 379 DOM
-
2026-06-02days on market $139,900 Active 378 DOM
-
2026-06-01days on market $139,900 Active 377 DOM
-
2026-05-31days on market $139,900 Active 376 DOM
-
2025-05-20$139,900 New 535-char remark
Show marketing remark (535 chars)
2 homes on 1 tract of land in Moore, TX. Each home is a 1 bedroom 1 bathroom with a large living area. Complete with city water, electric, and sewer system. Perfect for investment or somebody wanting two separate homes for family or to rent out for investment. Live in one home and rent out the other?? Lots of potential. Right off the I-35 access rd with 3 to 4 space carport conveys with the sale. Keep a RV on site if you wish. Adjacent property next door with 3 manufactured homes also for sale! Seller will finance if needed!!
ⓘ Source: listings_history table (triggers on properties + properties_extension) + one-shot
backfill from property_details.listing_events for pre-trigger history.
Nearby sold comps map
Loading sold comps map…
Walkable amenities ~0.75 mi
Loading nearby amenities…
Taxation est. · year 1
- Rental income
- $20,010
- − Mortgage interest
- −$7,837
- − Property taxes
- −$2,098
- − Insurance
- −$700
- − Repairs & maintenance
- −$1,601
- − Management
- −$1,601
- − Depreciation
- −$4,070
- Taxable income
- $2,104
- Est. tax owed @ 24.0%
- −$505
- After-tax cash flow
- $3,701/yr
For passive investors: Depreciation is non-cash, so a rental often shows a tax loss while cash-flowing — sheltering income. Rental losses are passive: they offset passive income freely, and up to $25,000/yr can offset ordinary (W-2) income if you actively participate and your MAGI is under $100k (phasing out to $0 by $150k); unused losses carry forward. On sale, claimed depreciation is recaptured at up to 25%, and gains may owe capital-gains tax (a 1031 exchange can defer both). Figures are a year-1 estimate at your 24.0% rate — not tax advice; consult a CPA.
Condition & rehab AI · 13 photos
The property presents as a moderate renovation opportunity with average condition. Repainting and updating key areas can significantly enhance its value.
Repairs flagged
- Moderate Exterior siding — Weathered appearance suggests potential for peeling or damage.
- Moderate Paint — Paint appears faded and may need repainting for a fresh look.
Value-add opportunities
- Resale Paint exterior siding and repainting interior walls — Fresh paint can significantly improve the home's curb appeal and resale value.
- Resale Replace or repair damaged roof — A functional roof is crucial for a home's value and can prevent costly repairs in the future.
- Both Update kitchen and bathroom fixtures — Modernizing these spaces can increase both resale and rental value.
Renovation cost estimate screening
| Repair item | Severity | Est. cost |
|---|---|---|
| Exterior siding · Weathered appearance suggests potential for peeling or damage. | Moderate | $3,000–15,000 |
| Paint · Paint appears faded and may need repainting for a fresh look. | Moderate | $3,000–15,000 |
| Total estimated repair cost · 2 items | $6,000–30,000 |
Value-add ROI direction
- Resale Paint exterior siding and repainting interior walls — Fresh paint can significantly improve the home's curb appeal and resale value. ↑
- Resale Replace or repair damaged roof — A functional roof is crucial for a home's value and can prevent costly repairs in the future. ↑
- Both Update kitchen and bathroom fixtures — Modernizing these spaces can increase both resale and rental value. ↑
ⓘ Cost ranges are severity-bucket heuristics (US national rule-of-thumb). Get contractor quotes + a written scope before underwriting a rehab budget.
Schools (NCES district)
- District
- Pearsall ISD
- NCES district ID
- 4834470
- Math proficiency
- 12% ▼ -18.00%
- Reading proficiency
- 19% ▼ -12.00%
- Median HH income
- $36,681
- Composite
- 12.89/100
- National rank
- #9588
- State rank
- #810 of 826 in TX
Livability — Moore
- Score
- 35/100
- State rank
- #1662
- US rank
- #27697
Category grades
Schools grade is shown separately in the Schools card above.
Census & demographics
- Census place
- Moore, TX
- City population
- 509
- Population (ZIP)
- 509
Population outlook (Frio County) Hauer SSP2
- Today (2025)
- 22,420 people
- By 2030
- 24,445 · +9.0%
- By 2040
- 28,783 · +28.4%
- By 2050
- 33,604 · +49.9%
- By 2075
- 46,166 · +105.9%
- By 2100
- 52,553 · +134.4%
Race, ethnicity, and origin ACS 2023
- Neighborhood character
- Diverse neighborhood (Simpson 0.59)
- Race & ethnicity
- Asian 51% White 38% Hispanic / Latino 10% Two or more races 6% Black 2%
- Hispanic origin (detail)
- Mexican 10%
- Common ancestry
- Slovak 20% Lithuanian 3%
- Foreign-born
- 62% · China, Canada
- Languages at home
- 89% English-only · German/W. Germanic 6% Spanish 4% Other Indo-European 1%
Political lean MEDSL · Frio
- 2024 margin
- Strong R (+24.6) · D 37.5% · R 62.0%
- 2008→2024 swing
- -43.3pp toward R · 2008: 18.7pp · 2024: -24.6pp
- All cycles
- 2024: R+24.6 2020: R+7.6 2016: D+6.3 2012: D+20.6 2008: D+18.7
Not yet ingested
- Civics
- —
Market trends
- HPI YoY
- ▲ 1.14%
- Current HPI
- 85.2233
- Rent YoY
- —
- Metro
- —
- State GDP YoY
- ▲ 3.95%
- F500 in state
- 110
Industry mix (Fortune 500 HQ in TX)
| Industry | F500 HQs | Revenue |
|---|---|---|
| Energy | 16 | $1,198B |
|
||
| Technology | 5 | $198B |
|
||
| Engineering / Construction | 4 | $72B |
|
||
| Energy Services | 3 | $60B |
|
||
| Utilities | 3 | $41B |
|
||
| Healthcare | 2 | $330B |
|
||
Price history
1 event — show timeline
- 2025-05-20 Listed $139,900 LERA
Cash-flow waterfall
monthlySold comps — $/sqft
last 12 mo · ≤1 miLoading sold comps…