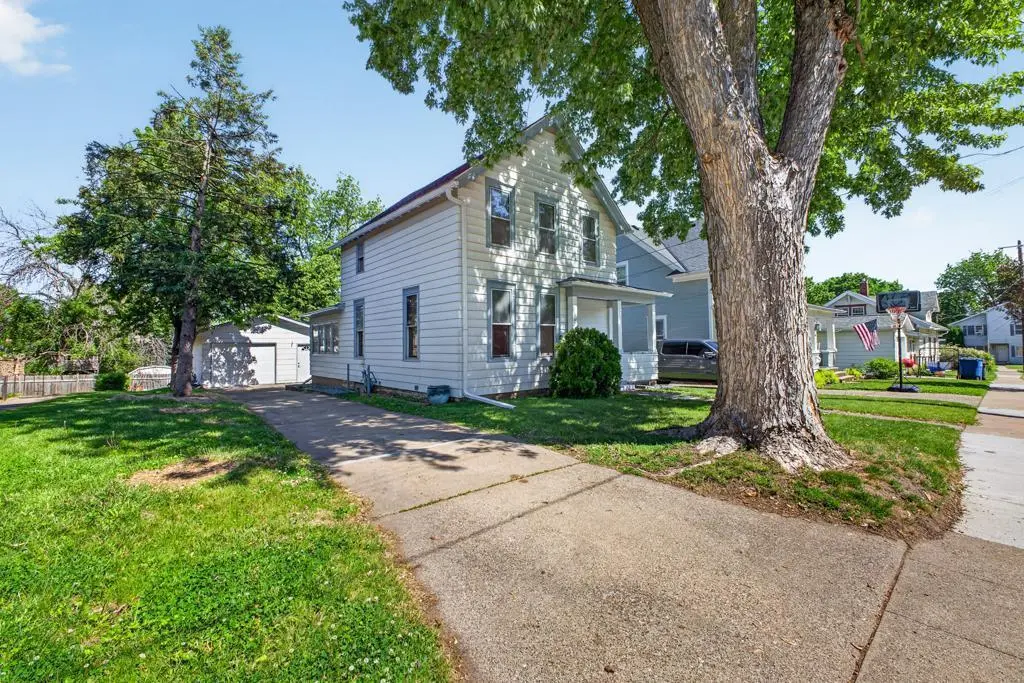
418 8th St · Red Wing, MN
Flood risk 1/10 · Minimal
- FEMA flood zone
- X (unshaded)
- Chance of flooding over 30 yrs
- 0.0%
- Est. flood insurance / yr
- $473 – $860
Fire risk 3/10 · Minor
- Est. fire insurance / yr
- $888 – $1,650
Heat risk 2/10 · Minimal
- Hot days now (above 100°F)
- 7 days/yr
- Hot days in 30 yrs
- 15 days/yr
Wind risk 2/10 · Minimal
- Chance of severe wind over 30 yrs
- —
Air-quality risk 1/10 · Minimal
- Unhealthy air days now
- 0 days/yr
- Unhealthy air days in 30 yrs
- 0 days/yr
Risk factors via First Street. Map © Google.
Why this score? — see what drove the D grade
The composite is a weighted blend of 9 inputs, each scored 0–100. Each bar is that input's sub-score; the figure is the points it added to the 100-point composite (weight × sub-score).
- Cash flow +15.6/30.0
- ARV discount +7.5/15.0
- DSCR +4.8/10.0
- Livability +4.0/5.0
- 1% rule +3.7/10.0
- Schools +3.5/10.0
- Rent growth +2.5/5.0
- Condition / age +2.5/5.0
- Appreciation +0.0/10.0
$229,900
🖨 Deal sheet (PDF) 📄 Offer letter ✓ Due diligence
Listing remarks MLS
This historic 4-bedroom, 1.5-bathroom home at 418 8th St, Red Wing is a rare opportunity to restore a piece of local history. Built in 1880, it has remained in the same family for 70 years and maintains much of its original woodwork and structural integrity. Home is being sold As Is. Some home improvements have been made by Three Rivers Community Action in 2020, insulating, appliance upgrade, and electrical in 2020. All highest and best offers are due by 9:00 am 2/03/2026
Key facts
- 5,662 sq ft lot
- Garage
- Built 1880
Property features AI
Exterior
- Parking: Detached concrete parking; 1-car garage (approx. 18 x 24)
- Utilities: City water (connected); City sewer (connected); Natural gas; Electric with circuit breakers (Xcel Energy)
- Home design: Residential property; Two levels; Entry facing front
- Construction: Block and frame construction; Asphalt roof (age 8 years or less); Block foundation
- Exterior features: Front porch; Metal exterior; Light tree coverage; City street frontage with curbs and sidewalks; Publicly maintained road
Interior
- Kitchen: Dishwasher; Microwave; Range; Refrigerator; Stainless steel appliances; Kitchen window
- Bedrooms: 4 bedrooms (includes a main-floor bedroom and upper-level bedrooms)
- Bathrooms: 1 full bath (upper level); 1 half bath (main floor)
- Heating & cooling: Forced air heating; Central air conditioning
- Interior features: Kitchen/Dining room; Natural woodwork; Water softener (owned)
- Laundry & utility: Washer; Dryer; Laundry in basement
Neighborhood map
What this means for you Summary
Snapshot
- This is a 4-bed/2.0-bath single-family listed at $230k.
Deal economics
- At list price, monthly cash flow is $98 ($1k/yr) — positive.
- The deal already cash-flows at list — no discount required.
- To meet the 1% rule (rent ≥ 1% of price), the offer needs to be $200k (13.2% below list).
- Recommended offer: $200k (13.2% below list) — sets the bar for 1% rule.
- Cap rate 6.8% vs local median 3.5% in Red Wing — top-decile yield for the area; either an underpriced asset or a hidden risk that comps aren't pricing in. Stress-test before assuming the spread holds.
Location & tenants
- Location reads 81/100 on livability (#64 in MN, #1,570 nationally) — a professional / high-income tenant draw. Strengths: cost of living A+, housing A+, health & safety A+; Watch: amenities D.
- Red Wing Public School District (rural): math 36% / reading 44% proficiency, ranked #220 of 301 in MN (top 73%) — families likely to look elsewhere, expect single-tenant / working-renter base with shorter leases.
- Zoned schools: Burnside Elementary (math 47% / reading 50%, grade D, #480 of 857 statewide, top 56%, 522 students, 42% FRL); Twin Bluff School (math 40% / reading 40%, grade F, #147 of 258 statewide, top 57%, 534 students, 37% FRL); Red Wing Senior High (math 31% / reading 44%, grade F, #280 of 471 statewide, top 59%, 866 students, 37% FRL).
- Market conditions: 141 active listings in the ZIP; 86 units permitted in Goodhue County in 2024 (0 in 5+ unit buildings).
- This rent runs 33% of the median local income ($74k/yr) — at the standard rent-burdened threshold; future hikes will face affordability resistance.
Forward outlook
- Local home prices are declining (-3.0%/yr); year-one equity from $2k of loan paydown is wiped out by about $7k of value loss. Plan a longer hold.
- Goodhue County population projected at -11% by 2050 — secular population decline; favor cash flow + early exit over multi-decade hold.
Negotiation context
- It's been on market 21 days — a 2% lower offer ($226k) is reasonable based on typical stale-listing flexibility.
- Current owner paid $124k; list at $230k implies a 85% gain — meaningful room to come down on a strong offer.
Risks & watch-outs
- Watch-outs: built in 1880 — expect roof / HVAC / electrical / plumbing capex.
Questions for the listing agent
- Built in 1880 — when were the roof, HVAC, electrical panel, plumbing, and water heater last replaced?
- Is there a deadline driving the sale (1031 exchange, divorce, estate, relocation)? That informs how much negotiation room exists.
- The area grade is low — what's the realistic commute time and amenity access for the typical tenant pool here? Any planned neighborhood developments (good or bad) we should know about?
- What's the average days-on-market for RENTAL listings here right now (not sales)? A rising rental-DOM trend means longer vacancies and softer asking-rent achievability than the comps imply.
- What's the recent tenant-quality profile in this submarket — average credit score on applications, eviction rate, late-payment / NSF rate, and stable-employment percentage? A property-management company in the area should have these aggregated.
- How much new for-sale + rental construction is in the pipeline within 1–3 miles? Heavy new supply typically softens prices + rents 12–24 months out; constrained supply supports both.
Investment metrics
- 1% rule
- 0.87% ✗
- Cap rate
- 6.81%
- Cash-on-cash
- 1.83%
- DSCR
- 1.08
- GRM
- 9.6
CMA / ARV
No comps found within radius.
Projected returns pro-forma
-3.0% appreciation · 3.0% rent growth · sell at horizon
- IRR
- -13.4%
- Equity multiple
- 0.52×
- Total profit
- $-31,025
- Equity at exit
- $34,279
- IRR
- -4.5%
- Equity multiple
- 0.70×
- Total profit
- $-19,100
- Equity at exit
- $19,878
Cash invested: $64,372 (down + closing). Projections, not guarantees.
Landlord ↔ Tenant lean methodology
- Overall (STATE)
- 46 Balanced
- State Minnesota
- 46 Balanced · D+2
- County
- — inherits STATE
- City
- — inherits STATE
ZIP-level market 55066
- Home prices YoY
- -28.1%
- Active inventory
- 141
- Price-to-rent
- 9.6×
Monthly cashflow live
- Estimated rent
- $1,996 medium interval (Pro) →
- Mortgage (P&I)
- −$1,206
- Tax from tax record
- −$177 /mo · $2,128/yr
- Insurance
- −$96
- HOA
- −$0
- Vacancy / Maint / Mgmt
- −$419
- Net cashflow
- $98
Break-even live
Sensitivity live
| Price | -10% $229 | -5% $163 | +0% $98 | +5% $33 | +10% $-32 |
|---|---|---|---|---|---|
| Rent | -10% $-59 | -5% $20 | +0% $98 | +5% $177 | +10% $256 |
| Rate | -1.0pp $214 | -0.5pp $157 | base $98 | +0.5pp $39 | +1.0pp $-22 |
UW: 25.0% down · 7.5% · 30yr · 1.5% tax · 5.0% vac · 8.0% maint · 8.0% mgmt
Financing live
Cash to close
- Down payment
- $57,475
- Closing costs
- $6,897
- Reserves months
- —
- Total cash needed
- —
Loan-product check · same deal, 3 products live
Conventional
25% down · 7.5% · 30yr
- Down + closing
- —
- Monthly P&I
- —
- Monthly cashflow
- —
- DSCR
- —
- Eligible?
- —
Personal DTI + credit; lowest rate.
DSCR
20% down · 8.5% · 30yr
- Down + closing
- —
- Monthly P&I
- —
- Monthly cashflow
- —
- DSCR
- —
- Eligible?
- —
No personal income docs; deal must DSCR.
Hard money
10% down · 12.0% · 12mo
- Down + closing
- —
- Monthly P&I
- —
- Monthly cashflow
- —
- DSCR
- —
- Eligible?
- —
Short-term bridge; refi at stabilization.
Listing history 15 events
-
2026-06-22price $229,900 Active 21 DOM
-
2026-06-21days on market $239,900 Active 21 DOM
-
2026-06-18days on market $239,900 Active 18 DOM
-
2026-06-17days on market $239,900 Active 17 DOM
-
2026-06-16days on market $239,900 Active 16 DOM
-
2026-06-15days on market $239,900 Active 15 DOM
-
2026-06-13days on market $239,900 Active 13 DOM
-
2026-06-09pricedays on market $239,900 Active 9 DOM
-
2026-06-08days on market $249,900 Active 8 DOM
-
2026-06-07days on market $249,900 Active 7 DOM
-
2026-06-04days on market $249,900 Active 4 DOM
-
2026-06-03days on market $249,900 Active 3 DOM
-
2026-06-02days on market $249,900 Active 2 DOM
-
2026-06-01statusdays on market $249,900 Active 1 DOM
-
2026-05-31days on market $249,900 Coming Soon 2 DOM
ⓘ Source: listings_history table (triggers on properties + properties_extension) + one-shot
backfill from property_details.listing_events for pre-trigger history.
Tax reassessment forecast MN · Partial reset (capped growth)
- Current annual tax
- $2,128 · $177/mo
- Projected year-2 tax
- $2,351 · $196/mo
- Expected delta
- +$223/yr (+$19/mo · 10.5%)
ⓘ Screening estimate from a state-policy table — verify with the county assessor before closing.
Climate risk First Street
- Flood 1/10 Low FEMA zone X (unshaded) · 0% chance over 30 yrs
- Wildfire 3/10 Moderate
- Heat 2/10 Low 7 d/yr ≥100°F today · 15 d/yr by 30 yrs out
- Wind 2/10 Low
- Air quality 1/10 Low 0 unhealthy d/yr today · 0 by 30 yrs out
Nearby sold comps map
Loading sold comps map…
Walkable amenities ~0.75 mi
Loading nearby amenities…
Taxation est. · year 1
- Rental income
- $23,956
- − Mortgage interest
- −$12,878
- − Property taxes
- −$2,128
- − Insurance
- −$1,150
- − Repairs & maintenance
- −$1,917
- − Management
- −$1,917
- − Depreciation
- −$6,688
- Taxable loss
- −$2,720
- Est. tax savings @ 24.0%
- +$653
- After-tax cash flow
- $1,833/yr
For passive investors: Depreciation is non-cash, so a rental often shows a tax loss while cash-flowing — sheltering income. Rental losses are passive: they offset passive income freely, and up to $25,000/yr can offset ordinary (W-2) income if you actively participate and your MAGI is under $100k (phasing out to $0 by $150k); unused losses carry forward. On sale, claimed depreciation is recaptured at up to 25%, and gains may owe capital-gains tax (a 1031 exchange can defer both). Figures are a year-1 estimate at your 24.0% rate — not tax advice; consult a CPA.
Schools (NCES district)
- District
- Red Wing Public School District
- NCES district ID
- 2730480
- Math proficiency
- 36% ▼ -13.00%
- Reading proficiency
- 44% ▼ -11.00%
- Median HH income
- $53,206
- Composite
- 34.77/100
- National rank
- #5122
- State rank
- #220 of 301 in MN
Livability — Red Wing
- Score
- 81/100
- State rank
- #64
- US rank
- #1570
Category grades
Schools grade is shown separately in the Schools card above.
Census & demographics
- Census place
- Red Wing, MN
- County
- Goodhue County · 19,226 people
- City population
- 19,226
- Metro
- Red Wing, MN
- Population (ZIP)
- 19,226
- Household income
- $73,584
- Rent vs Own
- Severe rent burden
- 504.0
Population outlook (Goodhue County) Hauer SSP2
- Today (2025)
- 46,532 people
- By 2030
- 46,185 · -0.7%
- By 2040
- 44,531 · -4.3%
- By 2050
- 41,532 · -10.7%
- By 2075
- 33,745 · -27.5%
- By 2100
- 23,716 · -49.0%
Race, ethnicity, and origin ACS 2023
- Neighborhood character
- Predominantly White (87%)
- Race & ethnicity
- White 87% Hispanic / Latino 6% Two or more races 4% Black 3%
- Hispanic origin (detail)
- Mexican 3%
- Common ancestry
- Portuguese 14% Romanian 3% Scottish 2%
- Foreign-born
- 4% · Canada
- Languages at home
- 95% English-only · Spanish 4%
Political lean MEDSL · Goodhue
- 2024 margin
- R (+16.4) · D 40.8% · R 57.3% · Other 1.9%
- 2008→2024 swing
- -15.1pp toward R · 2008: -1.4pp · 2024: -16.4pp
- All cycles
- 2024: R+16.4 2020: R+14.8 2016: R+18.0 2012: R+3.0 2008: R+1.4
Not yet ingested
- Civics
- —
Market trends
- HPI YoY
- ▼ -97.16%
- Current HPI
- 247.9899
- Rent YoY
- —
- Metro
- Red Wing, MN
- State GDP YoY
- ▲ 2.41%
- F500 in state
- 34
Industry mix (Fortune 500 HQ in MN)
| Industry | F500 HQs | Revenue |
|---|---|---|
| Healthcare | 2 | $407B |
|
||
| Retail | 2 | $150B |
|
||
| Consumer Goods | 2 | $32B |
|
||
| Industrial Machinery | 2 | $6B |
|
||
| Agriculture | 1 | $40B |
|
||
| Healthcare / Medical Devices | 1 | $32B |
|
||
Price history
+120.4% since first listed6 events — show timeline
- 2026-05-29 Coming Soon $249,900 NORTHSTARMLS as Distributed by MLS Grid
- 2026-04-01 Sold (Public Records) $124,000 Public Records
- 2026-03-27 Sold (MLS) $124,000 NORTHSTARMLS as Distributed by MLS Grid
- 2026-02-04 Contingent — NORTHSTARMLS as Distributed by MLS Grid
- 2026-01-29 Listed $113,377 NORTHSTARMLS as Distributed by MLS Grid
- 2026-01-22 Coming Soon $113,377 NORTHSTARMLS as Distributed by MLS Grid
Property tax history
+4.8%/yrLatest (2025): $2,128 · +10.0% YoY. Source: county tax records.
Cash-flow waterfall
monthlySold comps — $/sqft
last 12 mo · ≤1 miLoading sold comps…