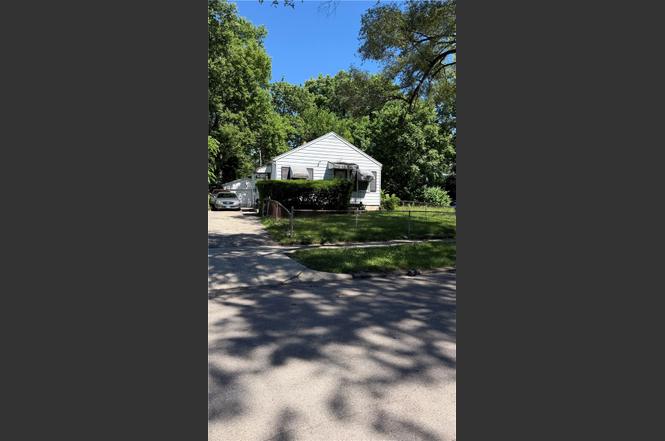
1216 Alcott Dr · Dayton, OH
Flood risk 1/10 · Minimal
- FEMA flood zone
- X (unshaded)
- Chance of flooding over 30 yrs
- 0.0%
- Est. flood insurance / yr
- $473 – $860
Fire risk 1/10 · Minimal
- Est. fire insurance / yr
- $713 – $1,323
Heat risk 3/10 · Minor
- Hot days now (above 104°F)
- 7 days/yr
- Hot days in 30 yrs
- 19 days/yr
Wind risk 2/10 · Minimal
- Chance of severe wind over 30 yrs
- 0.0%
Air-quality risk 3/10 · Minor
- Unhealthy air days now
- 2 days/yr
- Unhealthy air days in 30 yrs
- 4 days/yr
Risk factors via First Street. Map © Google.
Why this score? — see what drove the D+ grade
The composite is a weighted blend of 9 inputs, each scored 0–100. Each bar is that input's sub-score; the figure is the points it added to the 100-point composite (weight × sub-score).
- Cash flow +22.3/30.0
- DSCR +7.1/10.0
- 1% rule +5.2/10.0
- Rent growth +3.3/5.0
- Livability +3.2/5.0
- Condition / age +2.5/5.0
- Schools +1.3/10.0
- ARV discount +0.0/15.0
- Appreciation +0.0/10.0
$79,900
🖨 Deal sheet 📄 Offer letter ✓ Due diligence
Listing remarks
on day one?Dayton, OH is already cash flowing with a month-to-month tenant in place! Whether you’re looking to expand your portfolio or jump into real estate investing, this property offers immediate income potential and flexibility for the future. ?? Income-producing property ?? Month-to-month tenant ?? Start collecting rent from day one ?? Great opportunity for new or seasoned investors Opportunities like this do not stay on the market long. Don’t let this cash-flowing investment pass you by! Contact me today for more details or to schedule a showing.
Key facts
- 6,203 sq ft lot
- Garage
- Built 1949
Property features AI
Finance
- Financial info: Offered for sale
Exterior
- Parking: One-car detached garage
- Utilities: Check RTA for bus service
- Home design: Single-story residence
- Construction: Aluminum siding construction
- Exterior features: Aluminum siding; Residential lot approximately 0.14 acres (about 163 x 45)
Interior
- Bedrooms: Two main-level bedrooms (approx. 12 x 12 and 13 x 13)
- Bathrooms: One full bathroom on the main level
- Heating & cooling: Central air conditioning; Forced air heating
- Interior features: Unfinished basement
Neighborhood map
What this means for you Summary
Snapshot
- This is a 2-bed/1.0-bath single-family listed at $80k.
Deal economics
- At list price, monthly cash flow is $132 ($2k/yr) — positive.
- The deal already cash-flows at list — no discount required.
- Meets the 1% rule at list price ($818 rent vs $80k).
Location & tenants
- Location reads 65/100 on livability (#716 in OH) — a middle-class / working-renter tenant base. Strengths: cost of living A+, housing A+, health & safety A; Watch: schools C-, amenities C-, crime F.
- Dayton City (urban): math 12% / reading 21% proficiency, ranked #641 of 656 in OH (top 98%) — low school quality limits family demand, transient renter base, plan for 1-2y turnover; 74% free/reduced lunch — lower-income household profile, screen leases tightly.
- Market conditions: Rents rising (+3.0%/yr); 156 active listings in the ZIP; 19 comparable units currently listed for rent nearby; rentals at typical pace (median 24d on market — plan ~3-4 weeks tenant-placement turnaround); 47% of comp listings sitting > 30 days — soft ceiling on asking rent; lower-income renter base — watch delinquency; 907 units permitted in Montgomery County in 2024 (416 in 5+ unit buildings).
Forward outlook
- Local home prices are declining (-3.0%/yr); year-one equity from $552 of loan paydown is wiped out by about $2k of value loss. Plan a longer hold.
- Montgomery County population projected at -10% by 2050 — secular population decline; favor cash flow + early exit over multi-decade hold.
Negotiation context
- Only 4 days on market — expect competitive offers; lowballing is unlikely to land.
- Current owner paid $26k; list at $80k implies a 207% gain — meaningful room to come down on a strong offer.
Risks & watch-outs
- Watch-outs: built in 1949 — expect roof / HVAC / electrical / plumbing capex.
Questions for the listing agent
- Built in 1949 — when were the roof, HVAC, electrical panel, plumbing, and water heater last replaced?
- Is there a deadline driving the sale (1031 exchange, divorce, estate, relocation)? That informs how much negotiation room exists.
- Crime grade is F in this area — have there been break-ins, vandalism, or insurance claims at this property in the last 3 years? What carrier currently insures it and at what premium?
- The area grade is low — what's the realistic commute time and amenity access for the typical tenant pool here? Any planned neighborhood developments (good or bad) we should know about?
- What's the average days-on-market for RENTAL listings here right now (not sales)? A rising rental-DOM trend means longer vacancies and softer asking-rent achievability than the comps imply.
- What's the recent tenant-quality profile in this submarket — average credit score on applications, eviction rate, late-payment / NSF rate, and stable-employment percentage? A property-management company in the area should have these aggregated.
- How much new for-sale + rental construction is in the pipeline within 1–3 miles? Heavy new supply typically softens prices + rents 12–24 months out; constrained supply supports both.
Investment metrics
- 1% rule
- 1.02% ✓
- Cap rate
- 8.27%
- Cash-on-cash
- 7.07%
- DSCR
- 1.31
- GRM
- 8.1
CMA / ARV
- ARV (on-the-fly)
- $55,440
- Comps found
- 12
Show comp detail 12 sales within ~0.75 mi
| Address | Dist | Beds/Ba | Sqft | Sold | Price | $/sf | Match |
|---|---|---|---|---|---|---|---|
| 1251 Canfield Ave | 0.09mi | 2/1.0 | 720 (0%) | 7mo | $75,000 | $104 | 90 |
| 640 Shoop Ave | 0.38mi | 2/1.0 | 776 (+8%) | 7mo | $30,000 | $39 | 64 |
| 936 Walton Ave | 0.40mi | 2/1.0 | 792 (+10%) | 5mo | $60,000 | $76 | 61 |
| 1028 Walton Ave | 0.29mi | 2/1.0 | 788 (+9%) | 13mo | $94,000 | $119 | 60 |
| 1425 Shaftesbury Rd | 0.23mi | 2/1.0 | 792 (+10%) | 17mo | $75,000 | $95 | 58 |
| 932 Crestmore Ave | 0.53mi | 3/1.0 (+1) | 702 (-2%) | 12mo | $75,000 | $107 | 56 |
| 676 Brooklyn Ave | 0.46mi | 2/1.0 | 814 (+13%) | 6mo | $35,000 | $43 | 52 |
| 741 Leland Ave | 0.55mi | 2/1.0 | 776 (+8%) | 17mo | $31,350 | $40 | 47 |
| 3007 Cornell Dr | 0.46mi | 2/1.0 | 827 (+15%) | 9mo | $29,019 | $35 | 46 |
| 649 Brooklyn Ave | 0.50mi | 2/1.0 | 816 (+13%) | 13mo | $62,500 | $77 | 44 |
| 911 Crestmore Ave | 0.58mi | 2/1.0 | 616 (-14%) | 13mo | $29,990 | $49 | 38 |
| 2407 Hoover Ave | 0.69mi | 2/2.0 | 819 (+14%) | 8mo | $116,900 | $143 | 34 |
Match score weights: distance 35% · size 25% · config 20% · recency 20%. Top-matched comps best support the ARV.
Projected returns pro-forma
-3.0% appreciation · 3.03% rent growth · sell at horizon
- IRR
- -5.4%
- Equity multiple
- 0.80×
- Total profit
- $-4,535
- Equity at exit
- $11,913
- IRR
- 4.2%
- Equity multiple
- 1.31×
- Total profit
- $6,922
- Equity at exit
- $6,908
Cash invested: $22,372 (down + closing). Projections, not guarantees.
Landlord ↔ Tenant lean methodology
- Overall (STATE)
- 73 Landlord-Friendly
- State Ohio
- 73 Landlord-Friendly · R+6
- County
- — inherits STATE
- City
- — inherits STATE
ZIP-level market 45406
- Rents YoY
- 3.0%
- Active inventory
- 156
- Price-to-rent
- 8.1×
Monthly cashflow live
- Estimated rent
- $818 high interval (Pro) →
- Mortgage (P&I)
- −$419
- Tax from tax record
- −$62 /mo · $743/yr
- Insurance
- −$33
- HOA
- −$0
- Vacancy / Maint / Mgmt
- −$172
- Net cashflow
- $132
Break-even live
UW: 25.0% down · 7.5% · 30yr · 1.5% tax · 5.0% vac · 8.0% maint · 8.0% mgmt
Financing live
Cash to close
- Down payment
- $19,975
- Closing costs
- $2,397
- Reserves months
- —
- Total cash needed
- —
Loan-product check · same deal, 3 products live
Conventional
25% down · 7.5% · 30yr
- Down + closing
- —
- Monthly P&I
- —
- Monthly cashflow
- —
- DSCR
- —
- Eligible?
- —
Personal DTI + credit; lowest rate.
DSCR
20% down · 8.5% · 30yr
- Down + closing
- —
- Monthly P&I
- —
- Monthly cashflow
- —
- DSCR
- —
- Eligible?
- —
No personal income docs; deal must DSCR.
Hard money
10% down · 12.0% · 12mo
- Down + closing
- —
- Monthly P&I
- —
- Monthly cashflow
- —
- DSCR
- —
- Eligible?
- —
Short-term bridge; refi at stabilization.
Rent comps 19 comps
| Address | Beds | Baths | Sqft | Rent | $/sqft | DOM | Units | Dist |
|---|---|---|---|---|---|---|---|---|
| 3222 Athens Ave Unit C Dayton, OH | 2.0 | 1.0 | 700 | $700 | $1.00 | 43d | 1 | 0.03mi |
| 828 Walton Ave Unit 832 Walton Dayton, OH | 2.0 | 1.0 | 750 | $795 | $1.06 | 23d | 1 | 0.47mi |
| 3652 Otterbein Ave Unit 3652 Dayton, OH | 2.0 | 1.0 | 700 | $800 | $1.14 | 2d | 1 | 0.70mi |
| 1903 W Grand Ave Unit 4 Dayton, OH | 2.0 | 1.0 | 600 | $850 | $1.42 | 43d | 1 | 0.72mi |
| 322 Lorenz Ave Dayton, OH | 1.0 | 1.0 | 634 | $850 | $1.34 | 43d | 1 | 0.83mi |
| 1934 Tennyson Ave Dayton, OH | 1.0 | 1.0 | 675 | $700 | $1.04 | 43d | 1 | 0.99mi |
| 3627 Delphos Ave Dayton, OH | 1.0 | 1.0 | 525 | $625 | $1.19 | 14d | 1 | 0.99mi |
| 1982 Victoria Ave Dayton, OH | 1.0 | 1.0 | 675 | $700 | $1.04 | 43d | 1 | 1.07mi |
| 1923 Auburn Ave Dayton, OH | 1.0 | 1.0 | 490 | $600 | $1.22 | 14d | 1 | 1.12mi |
| 1923 Auburn Ave Apt 2 Dayton, OH | 1.0 | 1.0 | 490 | $600 | $1.22 | 43d | 1 | 1.12mi |
| 41 N Marion St Dayton, OH | 2.0 | 1.0 | 652 | $925 | $1.42 | 3d | 1 | 1.18mi |
| 2109 Victoria Ave Dayton, OH | 2.0 | 1.0 | 714 | $950 | $1.33 | 3d | 1 | 1.18mi |
| 2010 Auburn Ave Dayton, OH | 1.0 | 1.0 | 560 | $625 | $1.12 | 2d | 1 | 1.21mi |
| 2257 Hepburn Ave Dayton, OH | 1.0 | 1.0 | 600 | $695 | $1.16 | 43d | 1 | 1.39mi |
| 2039 Emerson Ave Dayton, OH | 1.0 | 1.0 | 725 | $725 | $1.00 | 3d | 1 | 1.39mi |
| 729 Cleverly Rd Dayton, OH | 2.0 | 1.0 | 626 | $950 | $1.52 | 43d | 1 | 1.44mi |
| 136 Lexington Ave Unit 1 Dayton, OH | 1.0 | 1.0 | 700 | $759 | $1.08 | 21d | 1 | 1.47mi |
| 1330 W Hillcrest Ave Dayton, OH | 1.0 | 1.0 | 525 | $825 | $1.57 | 43d | 1 | 1.47mi |
| 265 Victor Ave Dayton, OH | 1.0 | 1.0 | 602 | $699 | $1.16 | 3d | 1 | 1.50mi |
Listing history 5 events
-
2026-06-18days on market $79,900 Active 4 DOM
-
2026-06-17days on market $79,900 Active 3 DOM
-
2026-06-16days on market $79,900 Active 2 DOM
-
2026-06-15remarks 561-char remark
-
2026-06-15$79,900 Active 1 DOM
ⓘ Source: listings_history table (triggers on properties + properties_extension) + one-shot
backfill from property_details.listing_events for pre-trigger history.
Tax reassessment forecast OH · Partial reset (capped growth)
- Current annual tax
- $743 · $62/mo
- Projected year-2 tax
- $995 · $83/mo
- Expected delta
- +$252/yr (+$21/mo · 33.9%)
ⓘ Screening estimate from a state-policy table — verify with the county assessor before closing.
Climate risk First Street
- Flood 1/10 Low FEMA zone X (unshaded) · 0% chance over 30 yrs
- Wildfire 1/10 Low
- Heat 3/10 Moderate 7 d/yr ≥104°F today · 19 d/yr by 30 yrs out
- Wind 2/10 Low 0% chance of damaging wind over 30 yrs
- Air quality 3/10 Moderate 2 unhealthy d/yr today · 4 by 30 yrs out
Nearby sold comps map
Loading sold comps map…
Walkable amenities ~0.75 mi
Loading nearby amenities…
Taxation est. · year 1
- Rental income
- $9,814
- − Mortgage interest
- −$4,476
- − Property taxes
- −$743
- − Insurance
- −$400
- − Repairs & maintenance
- −$785
- − Management
- −$785
- − Depreciation
- −$2,324
- Taxable income
- $301
- Est. tax owed @ 24.0%
- −$72
- After-tax cash flow
- $1,510/yr
For passive investors: Depreciation is non-cash, so a rental often shows a tax loss while cash-flowing — sheltering income. Rental losses are passive: they offset passive income freely, and up to $25,000/yr can offset ordinary (W-2) income if you actively participate and your MAGI is under $100k (phasing out to $0 by $150k); unused losses carry forward. On sale, claimed depreciation is recaptured at up to 25%, and gains may owe capital-gains tax (a 1031 exchange can defer both). Figures are a year-1 estimate at your 24.0% rate — not tax advice; consult a CPA.
Schools (NCES district)
- District
- Dayton City
- NCES district ID
- 3904384
- Math proficiency
- 12% ▼ -12.00%
- Reading proficiency
- 21% ▼ -11.00%
- Median HH income
- $28,688
- Composite
- 12.94/100
- National rank
- #9579
- State rank
- #641 of 656 in OH
Livability — Dayton
- Score
- 65/100
- State rank
- #716
- US rank
- #12895
Category grades
Schools grade is shown separately in the Schools card above.
Census & demographics
- Census place
- Dayton, OH
- County
- Montgomery County · 459,541 people
- City population
- 164,387
- Metro
- Dayton-Kettering, OH
- Population (ZIP)
- 19,991
- Household income
- $41,796
- Rent vs Own
- Severe rent burden
- 1504.0
Population outlook (Montgomery County) Hauer SSP2
- Today (2025)
- 523,241 people
- By 2030
- 514,948 · -1.6%
- By 2040
- 493,378 · -5.7%
- By 2050
- 469,639 · -10.2%
- By 2075
- 418,360 · -20.0%
- By 2100
- 353,315 · -32.5%
Race, ethnicity, and origin ACS 2023
- Neighborhood character
- Predominantly Black (75%)
- Race & ethnicity
- Black 75% White 16% Two or more races 7% Hispanic / Latino 3%
- Common ancestry
- Italian 2% Lithuanian 1% Slovak 1%
- Foreign-born
- 2% · Canada
- Languages at home
- 97% English-only · Spanish 1%
Political lean MEDSL · Montgomery
- 2024 margin
- Toss-up / Even · D 49.8% · R 49.3%
- 2008→2024 swing
- -5.8pp toward R · 2008: 6.2pp · 2024: 0.5pp
- All cycles
- 2024: D+0.5 2020: D+2.2 2016: R+1.2 2012: D+3.1 2008: D+6.2
Not yet ingested
- Civics
- —
Market trends
- HPI YoY
- ▼ -113.75%
- Current HPI
- 197.1302
- Rent YoY
- ▲ 3.03%
- Metro
- Dayton-Kettering, OH
- State GDP YoY
- ▲ 1.98%
- F500 in state
- 48
Industry mix (Fortune 500 HQ in OH)
| Industry | F500 HQs | Revenue |
|---|---|---|
| Insurance | 3 | $145B |
|
||
| Industrial Machinery | 3 | $49B |
|
||
| Financial Services | 3 | $24B |
|
||
| Consumer Goods | 2 | $93B |
|
||
| Aerospace / Defense | 2 | $47B |
|
||
| Utilities | 2 | $33B |
|
||
Price history
+597.8% since first listed5 events — show timeline
- 2026-06-14 Listed $79,900 Dayton MLS
- 1997-09-19 Sold (Public Records) $26,000 Public Records
- 1987-09-29 Sold (Public Records) $6,025 Public Records
- 1985-12-18 Sold (Public Records) $26,500 Public Records
- 1985-02-25 Sold (Public Records) $11,450 Public Records
Property tax history
-2.4%/yrLatest (2025): $743 · -0.2% YoY. Source: county tax records.
Cash-flow waterfall
monthlySold comps — $/sqft
last 12 mo · ≤1 miLoading sold comps…