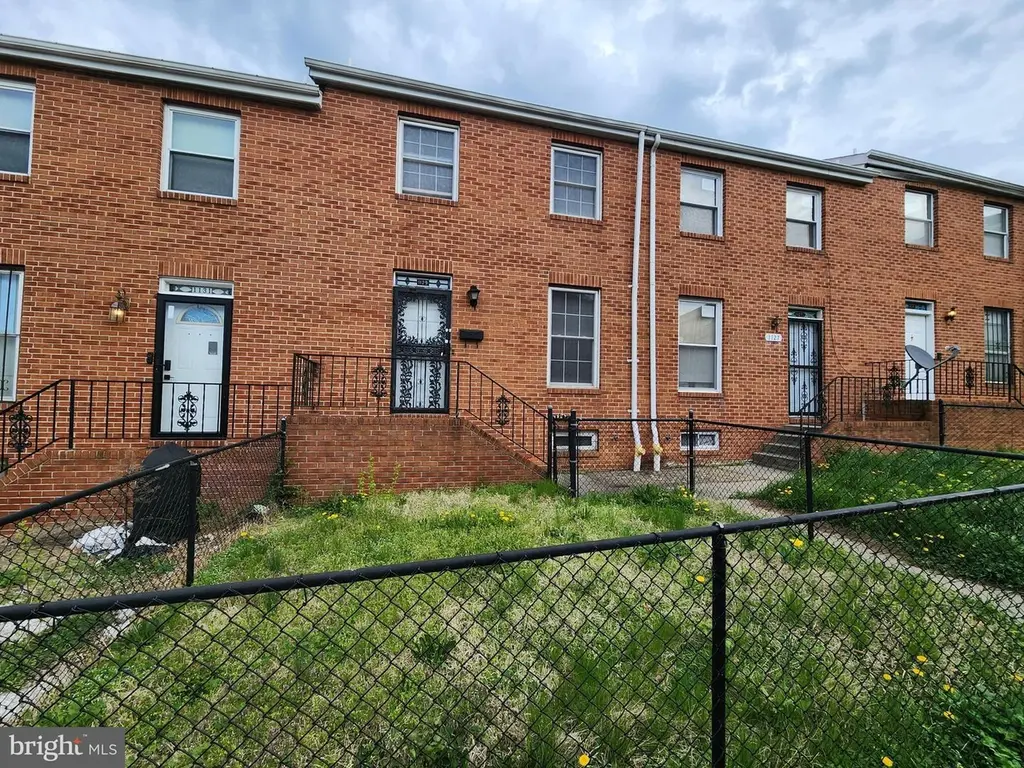
1129 Willinger Ct · Baltimore, MD
Flood risk 1/10 · Minimal
- FEMA flood zone
- X (unshaded)
- Chance of flooding over 30 yrs
- 0.0%
- Est. flood insurance / yr
- $473 – $860
Fire risk 1/10 · Minimal
- Est. fire insurance / yr
- $755 – $1,403
Heat risk 7/10 · Major
- Hot days now (above 103°F)
- 7 days/yr
- Hot days in 30 yrs
- 15 days/yr
Wind risk 6/10 · Moderate
- Chance of severe wind over 30 yrs
- 27.0%
Air-quality risk 4/10 · Minor
- Unhealthy air days now
- 6 days/yr
- Unhealthy air days in 30 yrs
- 7 days/yr
Risk factors via First Street. Map © Google.
Why this score? — see what drove the B grade
The composite is a weighted blend of 9 inputs, each scored 0–100. Each bar is that input's sub-score; the figure is the points it added to the 100-point composite (weight × sub-score).
- Cash flow +30.0/30.0
- ARV discount +15.0/15.0
- 1% rule +10.0/10.0
- DSCR +10.0/10.0
- Livability +3.8/5.0
- Rent growth +2.6/5.0
- Condition / age +2.5/5.0
- Schools +1.0/10.0
- Appreciation +0.0/10.0
$70,000
🖨 Deal sheet (PDF) 📄 Offer letter ✓ Due diligence
Listing remarks MLS
ONLINE AUCTION: This auction takes place on the Ashland Auction Group Website Bidding Platform. Bidding begins 6/4/2026 @ 10:00 AM. Bidding ends 6/8/2026 @ 12:40 PM. List Price is Suggested Opening Bid. Deposit: $15,000. This three-bedroom townhome located in the Johnston Square neighborhood of Baltimore City. The property contains approximately 1,152 square feet of finished living space across two levels and was originally constructed in 1986, with recent updates noted in 2025. The home features a traditional interior layout with multiple bathrooms (1 full and additional half baths), a functional kitchen equipped with stainless steel appliances, and in-unit laundry. Central heating and cooling provide year-round comfort. Positioned within close proximity to Johnston Square Park and just minutes from major commuter routes, the property offers convenient access to Downtown Baltimore, Johns Hopkins Hospital, and surrounding employment centers.
Key facts
- Functional kitchen
- In-unit laundry
- 2 parking spots
Tags
Neighborhood map
What this means for you Summary
Snapshot
- This is a 3-bed/1.5-bath townhouse listed at $70k.
Deal economics
- At list price, monthly cash flow is $988 ($12k/yr) — positive.
- The deal already cash-flows at list — no discount required.
- Meets the 1% rule at list price ($2k rent vs $70k).
- Recommended offer: $66k (6.0% below list) — sets the bar for market timing.
- Cap rate 23.2% vs local median 6.0% in Baltimore — top-decile yield for the area; either an underpriced asset or a hidden risk that comps aren't pricing in. Stress-test before assuming the spread holds.
Location & tenants
- Location reads 76/100 on livability (#90 in MD, #3,396 nationally) — a middle-class / working-renter tenant base. Strengths: amenities A+, commute A+, housing A+; Watch: crime F.
- Baltimore City Public Schools (urban): math 7% / reading 16% proficiency, ranked #24 of 24 in MD (top 100%) — low school quality limits family demand, transient renter base, plan for 1-2y turnover; 79% free/reduced lunch — lower-income household profile, screen leases tightly.
- Zoned schools: Elmer A. Henderson: A Johns Hopkins Partnership (math 2% / reading 16%, grade F, #650 of 860 statewide, top 77%, 642 students, 80% FRL); Vanguard Collegiate Middle (math 3% / reading 15%, grade F, #212 of 225 statewide, top 95%, 343 students, 84% FRL); Baltimore Polytechnic Institute (math 71% / reading 84%, grade A-, #22 of 222 statewide, top 10%, 1,555 students, 43% FRL).
- Zoned-school proficiency averages 32% at this address vs 12% district-wide (+20 pts) — the actual schools serving this property are materially stronger than the Baltimore City Public Schools average implies; a family-tenant draw the district grade alone would hide.
- Market conditions: Rents flat; 135 active listings in the ZIP; 40 comparable units currently listed for rent nearby; rentals at typical pace (median 26d on market — plan ~3-4 weeks tenant-placement turnaround); 1,273 units permitted in Baltimore city in 2024 (1,104 in 5+ unit buildings).
- This rent runs 38% of the median local income ($59k/yr) — at the standard rent-burdened threshold; future hikes will face affordability resistance.
Forward outlook
- Local home prices are declining (-3.0%/yr); year-one equity from $484 of loan paydown is wiped out by about $2k of value loss. Plan a longer hold.
- Baltimore County population projected to shrink 4% by 2050 — rents likely to lag national; underwrite the cash flow, not the appreciation.
- At projected returns (-3.0% appreciation + 0.6% rent growth), your $20k cash investment doubles in ~2 years — after that, you're playing with house money.
Negotiation context
- It's been on market 73 days — a 6% lower offer ($66k) is reasonable based on typical stale-listing flexibility.
- 5 sale attempts; this cycle's ask has dropped $30k (30%) from the opening price — seller is motivated, your offer sets the floor, not the list.
Risks & watch-outs
- Climate carrying-cost: major wind risk, 27% chance of damaging wind over 30y; extreme-heat days projected 7→15/yr by 2055 (HVAC capex compounding) — expect insurance premiums to compound above CPI over the hold.
Questions for the listing agent
- It's been on market 73 days. Have you received any prior offers? Is the seller open to a 6% concession, seller financing, or rate buy-down credit?
- Why hasn't it sold? Are there any deal-killer items the seller is aware of (foundation, flood, title, zoning, code violations)?
- Is there a deadline driving the sale (1031 exchange, divorce, estate, relocation)? That informs how much negotiation room exists.
- Schools are D-rated, which usually means shorter tenancies and higher turnover. Who's the typical renter profile here, and what's been the actual vacancy rate?
- Crime grade is F in this area — have there been break-ins, vandalism, or insurance claims at this property in the last 3 years? What carrier currently insures it and at what premium?
- What's the average days-on-market for RENTAL listings here right now (not sales)? A rising rental-DOM trend means longer vacancies and softer asking-rent achievability than the comps imply.
- What's the recent tenant-quality profile in this submarket — average credit score on applications, eviction rate, late-payment / NSF rate, and stable-employment percentage? A property-management company in the area should have these aggregated.
- How much new for-sale + rental construction is in the pipeline within 1–3 miles? Heavy new supply typically softens prices + rents 12–24 months out; constrained supply supports both.
Investment metrics
- 1% rule
- 2.66% ✓
- Cap rate
- 23.24%
- Cash-on-cash
- 60.51%
- DSCR
- 3.69
- GRM
- 3.1
CMA / ARV
- ARV (median comp)
- $134,273
- List price
- $70,000
- Delta
- -47.87%
- Verdict
- UNDERPRICED
- Comps
- 20 within 1.0 mi
Show comp detail 12 sales within ~0.75 mi
| Address | Dist | Beds/Ba | Sqft | Sold | Price | $/sf | Match |
|---|---|---|---|---|---|---|---|
| 1104 Harford Ave | 0.04mi | 3/1.5 | 1,152 (0%) | 2mo | $100,000 | $87 | 97 |
| 1543 Holbrook St | 0.31mi | 3/2.0 | 1,200 (+4%) | 2mo | $110,000 | $92 | 75 |
| 1110 N Central Ave | 0.15mi | 3/2.0 | 1,260 (+9%) | 2mo | $135,000 | $107 | 74 |
| 1234 E Lafayette Ave E | 0.50mi | 3/2.5 | 1,225 (+6%) | 2mo | $219,000 | $179 | 61 |
| 1205 Ashland Ave | 0.26mi | 3/1.0 | 992 (-14%) | 3mo | $95,000 | $96 | 60 |
| 1619 E Federal St E | 0.52mi | 3/2.5 | 1,216 (+6%) | 4mo | $75,000 | $62 | 59 |
| 1722 E Lanvale St | 0.67mi | 3/1.0 | 1,200 (+4%) | 0mo | $125,000 | $104 | 59 |
| 819 Aisquith St | 0.28mi | 3/1.0 | 991 (-14%) | 3mo | $93,500 | $94 | 59 |
| 1753 E Preston St | 0.56mi | 2/2.0 (-1) | 1,200 (+4%) | 3mo | $225,000 | $188 | 57 |
| 1822 Aiken St | 0.54mi | 3/1.0 | 1,050 (-9%) | 3mo | $49,000 | $47 | 56 |
| 1 E Chase St #303 | 0.66mi | 2/2.0 (-1) | 1,211 (+5%) | 2mo | $200,000 | $165 | 52 |
| 1423 E Lanvale St | 0.46mi | 4/2.0 (+1) | 1,000 (-13%) | 3mo | $77,750 | $78 | 47 |
Match score weights: distance 35% · size 25% · config 20% · recency 20%. Top-matched comps best support the ARV.
Projected returns pro-forma
-3.0% appreciation · 0.59% rent growth · sell at horizon
- IRR
- 56.5%
- Equity multiple
- 3.41×
- Total profit
- $47,225
- Equity at exit
- $10,437
- IRR
- 60.6%
- Equity multiple
- 6.36×
- Total profit
- $105,045
- Equity at exit
- $6,052
Cash invested: $19,600 (down + closing). Projections, not guarantees.
Landlord ↔ Tenant lean methodology
- Overall (CITY)
- 12 Strongly Tenant-Friendly
- State Maryland
- 27 Tenant-Leaning · D+14
- County
- — inherits STATE
- City Baltimore
- 12 Strongly Tenant-Friendly · D+58
ZIP-level market 21202
- Home prices YoY
- -8.0%
- Rents YoY
- 0.6%
- Active inventory
- 135
- Price-to-rent
- 3.1×
Monthly cashflow live
- Estimated rent
- $1,864 high interval (Pro) →
- Mortgage (P&I)
- −$367
- Tax est. 1.5%
- −$88 /mo · $1,050/yr
- Insurance
- −$29
- HOA
- −$0
- Vacancy / Maint / Mgmt
- −$391
- Net cashflow
- $988
Break-even live
Sensitivity live
| Price | -10% $1,037 | -5% $1,013 | +0% $988 | +5% $964 | +10% $940 |
|---|---|---|---|---|---|
| Rent | -10% $841 | -5% $915 | +0% $988 | +5% $1,062 | +10% $1,136 |
| Rate | -1.0pp $1,024 | -0.5pp $1,006 | base $988 | +0.5pp $970 | +1.0pp $952 |
UW: 25.0% down · 7.5% · 30yr · 1.5% tax · 5.0% vac · 8.0% maint · 8.0% mgmt
Financing live
Cash to close
- Down payment
- $17,500
- Closing costs
- $2,100
- Reserves months
- —
- Total cash needed
- —
Loan-product check · same deal, 3 products live
Conventional
25% down · 7.5% · 30yr
- Down + closing
- —
- Monthly P&I
- —
- Monthly cashflow
- —
- DSCR
- —
- Eligible?
- —
Personal DTI + credit; lowest rate.
DSCR
20% down · 8.5% · 30yr
- Down + closing
- —
- Monthly P&I
- —
- Monthly cashflow
- —
- DSCR
- —
- Eligible?
- —
No personal income docs; deal must DSCR.
Hard money
10% down · 12.0% · 12mo
- Down + closing
- —
- Monthly P&I
- —
- Monthly cashflow
- —
- DSCR
- —
- Eligible?
- —
Short-term bridge; refi at stabilization.
Rent comps 40 comps
| Address | Beds | Baths | Sqft | Rent | $/sqft | DOM | Units | Dist |
|---|---|---|---|---|---|---|---|---|
| 814 Showell Ct Baltimore, MD | 3.0 | 1.0 | 1152 | $1,900 | $1.65 | 0d | 1 | 0.14mi |
| 1027 N Central Ave Baltimore, MD | 3.0 | 1.0 | 1200 | $1,600 | $1.33 | 23d | 1 | 0.18mi |
| 1010 N Central Ave Baltimore, MD | 2.0 | 1.0 | 1023 | $1,650 | $1.61 | 25d | 1 | 0.18mi |
| 1009 Hillman St Baltimore, MD | 3.0 | 1.0 | 1200 | $1,650 | $1.38 | 22d | 1 | 0.19mi |
| 1317 E Eager St Baltimore, MD | 4.0 | 1.5 | 1400 | $1,900 | $1.36 | 23d | 1 | 0.25mi |
| 931 N Central Ave Baltimore, MD | 3.0 | 1.0 | 1085 | $1,400 | $1.29 | 25d | 1 | 0.25mi |
| 1100 Greenmount Ave Baltimore, MD | 1.0–3.0 | 1.0–2.0 | 839 | $2,584 | $3.08 | 4d | 1 | 0.28mi |
| 1205 Ashland Ave Baltimore, MD | 3.0 | 1.0 | 992 | $1,550 | $1.56 | 25d | 1 | 0.28mi |
| 1232 Ashland Ave Baltimore, MD | 3.0 | 1.0 | 1200 | $1,600 | $1.33 | 23d | 1 | 0.28mi |
| 1226 E Madison St Baltimore, MD | 3.0 | 1.0 | 1100 | $2,179 | $1.98 | 6d | 1 | 0.35mi |
| 1243 E Lanvale St Baltimore, MD | 3.0 | 1.5 | 1281 | $1,750 | $1.37 | 18d | 1 | 0.37mi |
| 1243 E Lanvale St Baltimore, MD | 3.0 | 1.5 | 1281 | $1,750 | $1.37 | 4d | 1 | 0.37mi |
| 1607 Hakesley Pl Baltimore, MD | 3.0 | 1.0 | 720 | $1,400 | $1.94 | 45d | 1 | 0.38mi |
| 1307 E Madison St Baltimore, MD | 2.0 | 1.0 | 1200 | $1,650 | $1.38 | 45d | 1 | 0.38mi |
| 458 E Federal St Baltimore, MD | 2.0 | 2.5 | 1300 | $1,850 | $1.42 | 5d | 1 | 0.44mi |
| 456 E Federal St Baltimore, MD | 2.0 | 2.0 | 1450 | $1,850 | $1.28 | 45d | 1 | 0.44mi |
| 1418 E Monument St Baltimore, MD | 2.0–4.0 | 1.0–2.0 | 1265 | $1,602 | $1.27 | 16d | 5 | 0.46mi |
| 415 E Federal St Baltimore, MD | 2.0 | 1.5 | 1450 | $1,800 | $1.24 | 0d | 1 | 0.47mi |
| 448 Pitman Pl Baltimore, MD | 2.0 | 1.5 | 940 | $2,145 | $2.28 | 25d | 1 | 0.47mi |
| 412 E Federal St Baltimore, MD | 2.0 | 2.5 | 1100 | $1,700 | $1.55 | 25d | 1 | 0.48mi |
| 218 E Preston St Baltimore, MD | 2.0 | 1.0 | 1250 | $1,724 | $1.38 | 45d | 1 | 0.50mi |
| 1312 Guilford Ave Baltimore, MD | 1.0–2.0 | 1.0–2.0 | 1040 | $1,850 | $1.78 | 45d | 6 | 0.51mi |
| 226 E Eager St Baltimore, MD | 3.0 | 2.0 | 1484 | $650 | $0.44 | 45d | 1 | 0.51mi |
| 802 N Broadway #1 Baltimore, MD | 2.0 | 1.0 | 1120 | $1,800 | $1.61 | 19d | 1 | 0.54mi |
| 1101 N Calvert St Baltimore, MD | 2.0 | 1.0–2.0 | 910 | $2,262 | $2.49 | 0d | 19 | 0.54mi |
| 1121 N Calvert St Baltimore, MD | 2.0 | 1.0 | 1300 | $1,550 | $1.19 | 45d | 1 | 0.54mi |
| 1512 E Lafayette Ave Baltimore, MD | 3.0 | 2.5 | 1476 | $1,950 | $1.32 | 45d | 1 | 0.55mi |
| 1514 E Lafayette Ave Baltimore, MD | 3.0 | 1.5 | 1215 | $2,000 | $1.65 | 25d | 1 | 0.55mi |
| 1803 N Dallas St Baltimore, MD | 2.0 | 2.5 | 1250 | $2,100 | $1.68 | 25d | 1 | 0.56mi |
| 1122 N Calvert St Apt 001 Baltimore, MD | 2.0 | 2.0 | 902 | $1,800 | $2.00 | 45d | 1 | 0.56mi |
| 103 E Mt Royal Ave Baltimore, MD | 1.0–3.0 | 1.0–2.0 | 825 | $2,624 | $3.18 | 0d | 19 | 0.58mi |
| 1711 Latrobe St Baltimore, MD | 2.0 | 1.5 | 1000 | $1,700 | $1.70 | 25d | 1 | 0.59mi |
| 210 Federal St Baltimore, MD | 3.0 | 1.0 | 900 | $1,350 | $1.50 | 22d | 1 | 0.59mi |
| 1125 Saint Paul St Unit 4 Baltimore, MD | 2.0 | 1.0 | 930 | $1,650 | $1.77 | 6d | 1 | 0.60mi |
| 1125 Saint Paul St Unit 4 Baltimore, MD | 2.0 | 1.0 | 930 | $1,650 | $1.77 | 19d | 1 | 0.60mi |
| 1708 Latrobe St Baltimore, MD | 2.0 | 1.0 | 750 | $2,250 | $3.00 | 25d | 1 | 0.60mi |
| 1101 Saint Paul St Baltimore, MD | 1.0–2.0 | 1.0–2.0 | 1108 | $2,200 | $1.99 | 19d | 3 | 0.60mi |
| 1301 Saint Paul St Baltimore, MD | 3.0 | 1.0–3.0 | 1050 | $2,399 | $2.28 | 45d | 1 | 0.60mi |
| 22 E Preston St Unit 22-1 Baltimore, MD | 2.0 | 2.0 | 1000 | $1,699 | $1.70 | 6d | 1 | 0.66mi |
| 1627 Rutland Ave Baltimore, MD | 3.0 | 2.0 | 1100 | $1,950 | $1.77 | 25d | 1 | 0.67mi |
Listing history 30 events
-
2026-06-21days on market $70,000 Active 73 DOM
-
2026-06-18days on market $70,000 Active 70 DOM
-
2026-06-17days on market $70,000 Active 69 DOM
-
2026-06-16days on market $70,000 Active 68 DOM
-
2026-06-15days on market $70,000 Active 67 DOM
-
2026-06-13pricedays on market $70,000 Active 65 DOM
-
2026-06-09days on market $100,000 Active 61 DOM
-
2026-06-08days on market $100,000 Active 60 DOM
-
2026-06-07days on market $100,000 Active 59 DOM
-
2026-06-04days on market $100,000 Active 56 DOM
-
2026-06-03days on market $100,000 Active 55 DOM
-
2026-06-02days on market $100,000 Active 54 DOM
-
2026-06-01days on market $100,000 Active 53 DOM
-
2026-05-31days on market $100,000 Active 52 DOM
-
2026-05-01historical $2,000
-
2026-04-27price $100,000 957-char remark
Show marketing remark (957 chars)
ONLINE AUCTION: This auction takes place on the Ashland Auction Group Website Bidding Platform. Bidding begins 6/4/2026 @ 10:00 AM. Bidding ends 6/8/2026 @ 12:40 PM. List Price is Suggested Opening Bid. Deposit: $15,000. This three-bedroom townhome located in the Johnston Square neighborhood of Baltimore City. The property contains approximately 1,152 square feet of finished living space across two levels and was originally constructed in 1986, with recent updates noted in 2025. The home features a traditional interior layout with multiple bathrooms (1 full and additional half baths), a functional kitchen equipped with stainless steel appliances, and in-unit laundry. Central heating and cooling provide year-round comfort. Positioned within close proximity to Johnston Square Park and just minutes from major commuter routes, the property offers convenient access to Downtown Baltimore, Johns Hopkins Hospital, and surrounding employment centers.
-
2026-04-24price $10,000 957-char remark
Show marketing remark (957 chars)
ONLINE AUCTION: This auction takes place on the Ashland Auction Group Website Bidding Platform. Bidding begins 6/4/2026 @ 10:00 AM. Bidding ends 6/8/2026 @ 12:40 PM. List Price is Suggested Opening Bid. Deposit: $15,000. This three-bedroom townhome located in the Johnston Square neighborhood of Baltimore City. The property contains approximately 1,152 square feet of finished living space across two levels and was originally constructed in 1986, with recent updates noted in 2025. The home features a traditional interior layout with multiple bathrooms (1 full and additional half baths), a functional kitchen equipped with stainless steel appliances, and in-unit laundry. Central heating and cooling provide year-round comfort. Positioned within close proximity to Johnston Square Park and just minutes from major commuter routes, the property offers convenient access to Downtown Baltimore, Johns Hopkins Hospital, and surrounding employment centers.
-
2026-04-09$100,000 Active 957-char remark
Show marketing remark (957 chars)
ONLINE AUCTION: This auction takes place on the Ashland Auction Group Website Bidding Platform. Bidding begins 6/4/2026 @ 10:00 AM. Bidding ends 6/8/2026 @ 12:40 PM. List Price is Suggested Opening Bid. Deposit: $15,000. This three-bedroom townhome located in the Johnston Square neighborhood of Baltimore City. The property contains approximately 1,152 square feet of finished living space across two levels and was originally constructed in 1986, with recent updates noted in 2025. The home features a traditional interior layout with multiple bathrooms (1 full and additional half baths), a functional kitchen equipped with stainless steel appliances, and in-unit laundry. Central heating and cooling provide year-round comfort. Positioned within close proximity to Johnston Square Park and just minutes from major commuter routes, the property offers convenient access to Downtown Baltimore, Johns Hopkins Hospital, and surrounding employment centers.
-
2026-02-28historical
-
2025-10-10$250,000 Active
-
2025-09-06$2,000
-
2025-09-05historical
-
2025-07-20$250,000 Active
-
2025-07-20price $250,000
-
2025-07-11historical
-
2025-03-12soldstatus $95,000
-
2025-02-17soldstatus $95,000 Closed
-
2025-01-23status Pending
-
2025-01-06$50,000 Active
-
1987-01-28soldstatus $60,112
ⓘ Source: listings_history table (triggers on properties + properties_extension) + one-shot
backfill from property_details.listing_events for pre-trigger history.
Climate risk First Street
- Flood 1/10 Low FEMA zone X (unshaded) · 0% chance over 30 yrs
- Wildfire 1/10 Low
- Heat 7/10 Severe 7 d/yr ≥103°F today · 15 d/yr by 30 yrs out
- Wind 6/10 Major 27% chance of damaging wind over 30 yrs
- Air quality 4/10 Moderate 6 unhealthy d/yr today · 7 by 30 yrs out
Nearby sold comps map
Loading sold comps map…
Walkable amenities ~0.75 mi
Loading nearby amenities…
Taxation est. · year 1
- Rental income
- $22,362
- − Mortgage interest
- −$3,921
- − Property taxes
- −$1,050
- − Insurance
- −$350
- − Repairs & maintenance
- −$1,789
- − Management
- −$1,789
- − Depreciation
- −$2,036
- Taxable income
- $11,427
- Est. tax owed @ 24.0%
- −$2,742
- After-tax cash flow
- $9,119/yr
For passive investors: Depreciation is non-cash, so a rental often shows a tax loss while cash-flowing — sheltering income. Rental losses are passive: they offset passive income freely, and up to $25,000/yr can offset ordinary (W-2) income if you actively participate and your MAGI is under $100k (phasing out to $0 by $150k); unused losses carry forward. On sale, claimed depreciation is recaptured at up to 25%, and gains may owe capital-gains tax (a 1031 exchange can defer both). Figures are a year-1 estimate at your 24.0% rate — not tax advice; consult a CPA.
Schools (NCES district)
- District
- Baltimore City Public Schools
- NCES district ID
- 2400090
- Math proficiency
- 7% ▼ -9.00%
- Reading proficiency
- 16% ▼ -5.00%
- Median HH income
- $42,108
- Composite
- 10.08/100
- National rank
- #9805
- State rank
- #24 of 24 in MD
Livability — Baltimore
- Score
- 76/100
- State rank
- #90
- US rank
- #3396
Category grades
Schools grade is shown separately in the Schools card above.
Census & demographics
- Census place
- Baltimore, MD
- County
- Baltimore City · 558,601 people
- City population
- 588,727
- Metro
- Baltimore-Columbia-Towson, MD
- Population (ZIP)
- 20,683
- Household income
- $59,377
- Rent vs Own
- Severe rent burden
- 1863.0
Population outlook (Baltimore County) Hauer SSP2
- Today (2025)
- 624,249 people
- By 2030
- 621,541 · -0.4%
- By 2040
- 609,756 · -2.3%
- By 2050
- 597,249 · -4.3%
- By 2075
- 552,236 · -11.5%
- By 2100
- 513,934 · -17.7%
Race, ethnicity, and origin ACS 2023
- Neighborhood character
- Diverse neighborhood (Simpson 0.63)
- Race & ethnicity
- Black 52% White 31% Hispanic / Latino 7% Two or more races 6% Asian 5%
- Hispanic origin (detail)
- Mexican 2%
- Common ancestry
- Lithuanian 2% Romanian 2% Slovak 1%
- Foreign-born
- 12% · Canada, South Korea, China
- Languages at home
- 87% English-only · Spanish 4% Other Indo-European 2% Arabic 1%
Political lean MEDSL · Baltimore
- 2024 margin
- Solid D (+73.0) · D 85.2% · R 12.2% · Other 2.6%
- 2008→2024 swing
- -2.5pp toward R · 2008: 75.5pp · 2024: 73.0pp
- All cycles
- 2024: D+73.0 2020: D+76.6 2016: D+74.6 2012: D+76.4 2008: D+75.5
Not yet ingested
- Civics
- —
Market trends
- HPI YoY
- ▼ -25.44%
- Current HPI
- 291.3702
- Rent YoY
- ▲ 0.59%
- Metro
- Baltimore-Columbia-Towson, MD
- State GDP YoY
- ▲ 2.97%
- F500 in state
- 12
Industry mix (Fortune 500 HQ in MD)
| Industry | F500 HQs | Revenue |
|---|---|---|
| Aerospace / Defense | 1 | $71B |
|
||
| Utilities | 1 | $25B |
|
||
| Hotels | 1 | $24B |
|
||
| Consumer Goods | 1 | $7B |
|
||
| Real Estate | 1 | $6B |
|
||
| Chemicals | 1 | $2B |
|
||
Price history
-96.7% since first listed16 events — show timeline
- 2026-05-01 Rental Removed $2,000 BRIGHTMLS
- 2026-04-27 Price Changed $100,000 BRIGHT MLS
- 2026-04-24 Price Changed $10,000 BRIGHT MLS
- 2026-04-09 Listed $100,000 BRIGHT MLS
- 2026-02-28 Listing Removed — BRIGHT MLS
- 2025-10-10 Listed $250,000 BRIGHT MLS
- 2025-09-06 Listed for Rent $2,000 BRIGHTMLS
- 2025-09-05 Listing Removed — BRIGHT MLS
- 2025-07-20 Listed $250,000 BRIGHT MLS
- 2025-07-20 Price Changed $250,000 BRIGHT MLS
- 2025-07-11 Coming Soon — BRIGHT MLS
- 2025-03-12 Sold (Public Records) $95,000 Public Records
- 2025-02-17 Sold (MLS) $95,000 BRIGHT MLS
- 2025-01-23 Pending — BRIGHT MLS
- 2025-01-06 Listed $50,000 BRIGHT MLS
- 1987-01-28 Sold (Public Records) $60,112 Public Records
Property tax history
+5.0%/yrLatest (2025): $4,030 · +20.0% YoY. Source: county tax records.
Cash-flow waterfall
monthlySold comps — $/sqft
last 12 mo · ≤1 miLoading sold comps…