27022 Walla Walla St · Sprague River, OR
Flood risk 1/10 · Minimal
- FEMA flood zone
- X
- Chance of flooding over 30 yrs
- 0.0%
- Est. flood insurance / yr
- $507 – $1,088
Fire risk 7/10 · Major
- Est. fire insurance / yr
- $498 – $926
Heat risk 3/10 · Minor
- Hot days now (above 92°F)
- 7 days/yr
- Hot days in 30 yrs
- 17 days/yr
Wind risk 1/10 · Minimal
- Chance of severe wind over 30 yrs
- —
Air-quality risk 9/10 · Severe
- Unhealthy air days now
- 20 days/yr
- Unhealthy air days in 30 yrs
- 20 days/yr
Risk factors via First Street. Map © Google.
Why this score? — see what drove the D- grade
The composite is a weighted blend of 9 inputs, each scored 0–100. Each bar is that input's sub-score; the figure is the points it added to the 100-point composite (weight × sub-score).
- Cash flow +10.5/30.0
- ARV discount +7.5/15.0
- Appreciation +6.3/10.0
- DSCR +3.0/10.0
- Rent growth +2.5/5.0
- Schools +2.5/10.0
- Livability +2.5/5.0
- Condition / age +2.5/5.0
- 1% rule +2.0/10.0
$200,000
🖨 Deal sheet (PDF) 📄 Offer letter ✓ Due diligence
Listing remarks
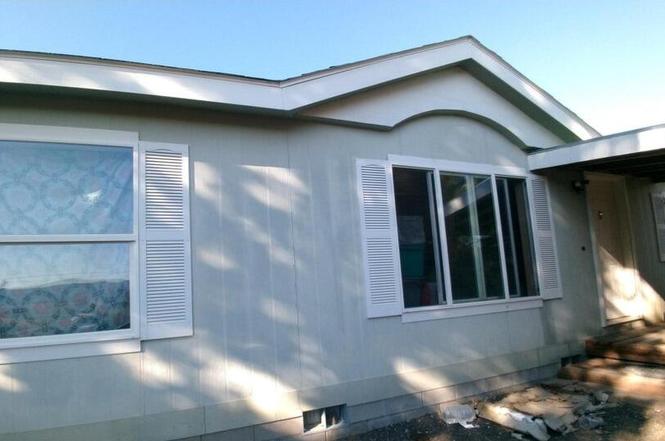
2006 MFH on 2.46 acres. Located up on a hill over looking Sprague River. Has it's own well. Nice shed. May need a 4 wheel drive vehicle. Just over 35 minutes from Klamath Falls. Newer wood like vinyl flooring throughout. Comes with Stainless Steel refrigerator, dishwasher, oven, range, washer and drier. Central Air Conditioner and heat. Living room and den. Open and spacious 1512 sq ft with nice views!
Key facts
- Own well
- 2.46 acres
- 2.46 acre lot
Tags
Property features AI
Finance
- Financial info: Property is not currently rented; FIRPTA applies
- HOA & community: No CCRs
Exterior
- Parking: Driveway; Gravel parking; RV access/parking
- Security: Carbon monoxide detector(s); Smoke detector(s)
- Utilities: Well water; Septic tank; Public utilities available; Gravel road access
- Home design: Manufactured on land (double wide); Residential property; One level; Built in 2006; No common walls; Block foundation; Flood zone status: unknown; Zoned R
- Construction: Double wide manufactured body type
- Exterior features: Composition roof; Shed(s); Corner lot; Sloped lot
Interior
- Kitchen: Dishwasher; Oven; Range; Range hood; Refrigerator
- Bedrooms: 3 bedrooms (includes primary bedroom)
- Flooring: Vinyl
- Bathrooms: 2 full bathrooms
- Heating & cooling: Forced air heating; Central air conditioning
- Interior features: Breakfast bar; Built-in features; Ceiling fan(s); Double vanity; Open floorplan; Pantry; Shower/tub combo; Soaking tub
- Laundry & utility: Washer; Laundry room; Water heater
Neighborhood map
What this means for you Summary
Snapshot
- This is a 3-bed/2.0-bath manufactured listed at $200k.
Deal economics
- At list price, monthly cash flow is $-103 ($-1k/yr) — negative.
- To cash-flow at today's rent, offer at most $182k (9.1% below list).
- To meet the 1% rule (rent ≥ 1% of price), the offer needs to be $139k (30.4% below list).
- Recommended offer: $139k (30.4% below list) — sets the bar for 1% rule.
Location & tenants
- Location reads: area grade D — affects rentability + tenant quality, not the cash-flow math above.
- Klamath County SD (rural): math 21% / reading 37% proficiency, ranked #46 of 58 in OR (top 79%) — low school quality limits family demand, transient renter base, plan for 1-2y turnover.
- Zoned schools: Chiloquin Elementary School (math 24% / reading 34%, grade F, #263 of 412 statewide, top 68%, 226 students, 76% FRL) — zoned schools average 76% FRL vs 59% district-wide (17 pts higher); higher-poverty schools than district average — tighter screening recommended.
- Market conditions: 80 active listings in the ZIP; 232 units permitted in Klamath County in 2024 (72 in 5+ unit buildings).
Forward outlook
- In year one you build about $7k of equity ($1k loan paydown + $5k appreciation (2.6% local appreciation)).
- Klamath County population projected at -12% by 2050 — secular population decline; favor cash flow + early exit over multi-decade hold.
- By year 6, paydown + projected appreciation supports a ~$35k cash-out refi (75% LTV) — recoverable capital for the next deal without selling this one.
Negotiation context
- It's been on market 68 days — a 6% lower offer ($188k) is reasonable based on typical stale-listing flexibility.
- 2 sale attempts with the ask held roughly flat each time — persistent listings suggest the price (not the market) is what's stuck; bring a comps-based counter.
Risks & watch-outs
- Climate carrying-cost: major wildfire risk — expect insurance premiums to compound above CPI over the hold.
Questions for the listing agent
- What do current leases actually rent for vs. the listed asking? Can we see a recent rent roll and the last 12 months of T-12 income?
- It's been on market 68 days. Have you received any prior offers? Is the seller open to a 30% concession, seller financing, or rate buy-down credit?
- Why hasn't it sold? Are there any deal-killer items the seller is aware of (foundation, flood, title, zoning, code violations)?
- Is there a deadline driving the sale (1031 exchange, divorce, estate, relocation)? That informs how much negotiation room exists.
- The area grade is low — what's the realistic commute time and amenity access for the typical tenant pool here? Any planned neighborhood developments (good or bad) we should know about?
- What's the average days-on-market for RENTAL listings here right now (not sales)? A rising rental-DOM trend means longer vacancies and softer asking-rent achievability than the comps imply.
- What's the recent tenant-quality profile in this submarket — average credit score on applications, eviction rate, late-payment / NSF rate, and stable-employment percentage? A property-management company in the area should have these aggregated.
- How much new for-sale + rental construction is in the pipeline within 1–3 miles? Heavy new supply typically softens prices + rents 12–24 months out; constrained supply supports both.
Investment metrics
- 1% rule
- 0.70% ✗
- Cap rate
- 5.67%
- Cash-on-cash
- -2.21%
- DSCR
- 0.90
- GRM
- 12.0
CMA / ARV
No comps found within radius.
Projected returns pro-forma
2.61% appreciation · 3.0% rent growth · sell at horizon
- IRR
- 4.2%
- Equity multiple
- 1.24×
- Total profit
- $13,291
- Equity at exit
- $85,522
- IRR
- 7.6%
- Equity multiple
- 2.10×
- Total profit
- $61,665
- Equity at exit
- $128,472
Cash invested: $56,000 (down + closing). Projections, not guarantees.
Landlord ↔ Tenant lean methodology
- Overall (STATE)
- 28 Tenant-Leaning
- State Oregon
- 28 Tenant-Leaning · D+6
- County
- — inherits STATE
- City
- — inherits STATE
ZIP-level market 97639
- Home prices YoY
- 2.6%
- Active inventory
- 80
- Price-to-rent
- 12.0×
Monthly cashflow live
- Estimated rent
- $1,392 medium interval (Pro) →
- Mortgage (P&I)
- −$1,049
- Tax from tax record
- −$71 /mo · $848/yr
- Insurance
- −$83
- HOA
- −$0
- Vacancy / Maint / Mgmt
- −$292
- Net cashflow
- $-103
Break-even live
Sensitivity live
| Price | -10% $10 | -5% $-47 | +0% $-103 | +5% $-160 | +10% $-216 |
|---|---|---|---|---|---|
| Rent | -10% $-213 | -5% $-158 | +0% $-103 | +5% $-48 | +10% $7 |
| Rate | -1.0pp $-2 | -0.5pp $-52 | base $-103 | +0.5pp $-155 | +1.0pp $-208 |
UW: 25.0% down · 7.5% · 30yr · 1.5% tax · 5.0% vac · 8.0% maint · 8.0% mgmt
Financing live
Cash to close
- Down payment
- $50,000
- Closing costs
- $6,000
- Reserves months
- —
- Total cash needed
- —
Loan-product check · same deal, 3 products live
Conventional
25% down · 7.5% · 30yr
- Down + closing
- —
- Monthly P&I
- —
- Monthly cashflow
- —
- DSCR
- —
- Eligible?
- —
Personal DTI + credit; lowest rate.
DSCR
20% down · 8.5% · 30yr
- Down + closing
- —
- Monthly P&I
- —
- Monthly cashflow
- —
- DSCR
- —
- Eligible?
- —
No personal income docs; deal must DSCR.
Hard money
10% down · 12.0% · 12mo
- Down + closing
- —
- Monthly P&I
- —
- Monthly cashflow
- —
- DSCR
- —
- Eligible?
- —
Short-term bridge; refi at stabilization.
Listing history 11 events
-
2026-06-19days on market $200,000 Active 68 DOM
-
2026-06-18days on market $200,000 Active 67 DOM
-
2026-06-17days on market $200,000 Active 66 DOM
-
2026-06-16days on market $200,000 Active 65 DOM
-
2026-06-15days on market $200,000 Active 64 DOM
-
2026-06-14days on market $200,000 Active 62 DOM
-
2026-06-12days on market $200,000 Active 61 DOM
-
2026-06-09days on market $200,000 Active 58 DOM
-
2026-06-08days on market $200,000 Active 57 DOM
-
2026-06-07remarks 405-char remark
-
2026-06-07$200,000 Active 56 DOM
ⓘ Source: listings_history table (triggers on properties + properties_extension) + one-shot
backfill from property_details.listing_events for pre-trigger history.
Tax reassessment forecast OR · Resets to sale price
- Current annual tax
- $848 · $71/mo
- Projected year-2 tax
- $1,940 · $162/mo
- Expected delta
- +$1,092/yr (+$91/mo · 128.8%)
ⓘ Screening estimate from a state-policy table — verify with the county assessor before closing.
Climate risk First Street
- Flood 1/10 Low FEMA zone X · 0% chance over 30 yrs
- Wildfire 7/10 Severe
- Heat 3/10 Moderate 7 d/yr ≥92°F today · 17 d/yr by 30 yrs out
- Wind 1/10 Low
- Air quality 9/10 Extreme 20 unhealthy d/yr today · 20 by 30 yrs out
Nearby sold comps map
Loading sold comps map…
Walkable amenities ~0.75 mi
Loading nearby amenities…
Taxation est. · year 1
- Rental income
- $16,704
- − Mortgage interest
- −$11,203
- − Property taxes
- −$848
- − Insurance
- −$1,000
- − Repairs & maintenance
- −$1,336
- − Management
- −$1,336
- − Depreciation
- −$5,818
- Taxable loss
- −$4,838
- Est. tax savings @ 24.0%
- +$1,161
- After-tax cash flow
- $-77/yr
For passive investors: Depreciation is non-cash, so a rental often shows a tax loss while cash-flowing — sheltering income. Rental losses are passive: they offset passive income freely, and up to $25,000/yr can offset ordinary (W-2) income if you actively participate and your MAGI is under $100k (phasing out to $0 by $150k); unused losses carry forward. On sale, claimed depreciation is recaptured at up to 25%, and gains may owe capital-gains tax (a 1031 exchange can defer both). Figures are a year-1 estimate at your 24.0% rate — not tax advice; consult a CPA.
Schools (NCES district)
- District
- Klamath County SD
- NCES district ID
- 4107020
- Math proficiency
- 21% ▼ -17.00%
- Reading proficiency
- 37% ▼ -16.00%
- Median HH income
- $44,906
- Composite
- 24.83/100
- National rank
- #7593
- State rank
- #46 of 58 in OR
Livability — Sprague River
No livability data for this city. (Only ~50 U.S. cities are tracked.)
Census & demographics
- Population (ZIP)
- 9
Population outlook (Klamath County) Hauer SSP2
- Today (2025)
- 63,870 people
- By 2030
- 62,279 · -2.5%
- By 2040
- 58,891 · -7.8%
- By 2050
- 56,207 · -12.0%
- By 2075
- 51,239 · -19.8%
- By 2100
- 46,526 · -27.2%
Race, ethnicity, and origin ACS 2023
- Neighborhood character
- Predominantly White (100%)
- Race & ethnicity
- White 100%
Political lean MEDSL · Klamath
- 2024 margin
- Solid R (+41.9) · D 27.9% · R 69.8% · Other 2.4%
- 2008→2024 swing
- -8.8pp toward R · 2008: -33.1pp · 2024: -41.9pp
- All cycles
- 2024: R+41.9 2020: R+40.6 2016: R+44.8 2012: R+38.2 2008: R+33.1
Not yet ingested
- Civics
- —
Market trends
- HPI YoY
- ▲ 2.61%
- Current HPI
- 102.6475
- Rent YoY
- —
- Metro
- —
- State GDP YoY
- ▲ 2.05%
- F500 in state
- 2
Industry mix (Fortune 500 HQ in OR)
| Industry | F500 HQs | Revenue |
|---|---|---|
| Consumer Goods | 1 | $51B |
|
||
Price history
3 events — show timeline
- 2026-06-05 Relisted — MLSCO
- 2026-03-23 Pending — MLSCO
- 2026-01-28 Listed $200,000 MLSCO
Property tax history
+3.5%/yrLatest (2025): $848 · +3.9% YoY. Source: county tax records.
Cash-flow waterfall
monthlySold comps — $/sqft
last 12 mo · ≤1 miLoading sold comps…