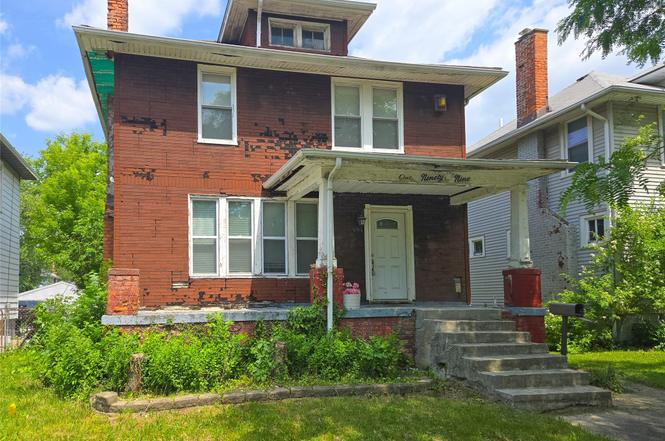
199 Massachusetts St · Highland Park, MI
Flood risk 1/10 · Minimal
- FEMA flood zone
- X (unshaded)
- Chance of flooding over 30 yrs
- 0.0%
- Est. flood insurance / yr
- $473 – $860
Fire risk 1/10 · Minimal
- Est. fire insurance / yr
- $784 – $1,456
Heat risk 3/10 · Minor
- Hot days now (above 96°F)
- 7 days/yr
- Hot days in 30 yrs
- 15 days/yr
Wind risk 2/10 · Minimal
- Chance of severe wind over 30 yrs
- —
Air-quality risk 4/10 · Minor
- Unhealthy air days now
- 4 days/yr
- Unhealthy air days in 30 yrs
- 6 days/yr
Risk factors via First Street. Map © Google.
Why this score? — see what drove the B- grade
The composite is a weighted blend of 9 inputs, each scored 0–100. Each bar is that input's sub-score; the figure is the points it added to the 100-point composite (weight × sub-score).
- Cash flow +30.0/30.0
- 1% rule +10.0/10.0
- DSCR +10.0/10.0
- Schools +5.0/10.0
- Livability +3.7/5.0
- Rent growth +2.5/5.0
- Condition / age +2.5/5.0
- ARV discount +1.4/15.0
- Appreciation +0.0/10.0
$67,000
🖨 Deal sheet 📄 Offer letter ✓ Due diligence
Listing remarks MLS
Attention investors and owner-occupants! This 4-bedroom, 1-bath colonial offers 1,439 square feet of living space and strong potential for rental income or value-add improvements. Featuring a spacious floor plan, large bedrooms, and classic character throughout, this property presents an excellent opportunity to add to your portfolio or create your ideal home. Conveniently located near major roads, shopping, schools, and local amenities. With the right vision, this property can truly shine. Schedule your showing today!
Key facts
- 6,098 sq ft lot
- 2 garage spots
- Built 1913
Property features AI
Finance
- Other: Residential property in STEVEN SUB BLK 2 subdivision; Directions: West of Oakland Avenue, South of Davidson
- Financial info: No investor or income/expense details provided
- HOA & community: No HOA details provided
Exterior
- Parking: Detached 2-car garage
- Security: No security details provided
- Utilities: Public water; Public sewer
- Home design: Single-family residence; Two levels; Ground-level entry with steps; Brick veneer exterior
- Construction: Brick veneer construction; Brick/mortar foundation
- Exterior features: Covered porch; Porch; Fenced backyard; Level lot; Paved road access; Lot dimensions approximately 40 x 150 (0.14 acres)
Interior
- Kitchen: No specific kitchen appliance list provided
- Bedrooms: 7 total rooms (includes bedrooms and living spaces)
- Flooring: No flooring details provided
- Bathrooms: 1 full bathroom
- Heating & cooling: Forced air heating; Natural gas heating; No cooling
- Interior features: Gas water heater; Living room fireplace; Unfinished basement
- Laundry & utility: No laundry details provided
Neighborhood map
What this means for you Summary
Snapshot
- This is a 4-bed/1.5-bath single-family listed at $67k.
Deal economics
- At list price, monthly cash flow is $798 ($10k/yr) — positive.
- The deal already cash-flows at list — no discount required.
- Meets the 1% rule at list price ($2k rent vs $67k).
- Cap rate 20.6% vs local median 14.2% in Highland Park — top-decile yield for the area; either an underpriced asset or a hidden risk that comps aren't pricing in. Stress-test before assuming the spread holds.
Location & tenants
- Location reads 73/100 on livability (#214 in MI) — a middle-class / working-renter tenant base. Strengths: commute A+, cost of living A+, housing A+; Watch: schools F, crime F, employment F.
- Market conditions: 216 active listings in the ZIP; 18 comparable units currently listed for rent nearby; rentals at typical pace (median 17d on market — plan ~3-4 weeks tenant-placement turnaround); lower-income renter base — watch delinquency; 2,639 units permitted in Wayne County in 2024 (1,216 in 5+ unit buildings).
- At $1,588/mo this rent would consume 50% of the median local household income ($38k/yr) (locally 1192% of renters already pay >50% of income on rent) — very limited rent-growth headroom before tenants either downsize or default.
Forward outlook
- Local home prices are declining (-3.0%/yr); year-one equity from $463 of loan paydown is wiped out by about $2k of value loss. Plan a longer hold.
- Wayne County population projected at -17% by 2050 — secular population decline; favor cash flow + early exit over multi-decade hold.
- At projected returns (-3.0% appreciation + 3.0% rent growth), your $19k cash investment doubles in ~3 years — after that, you're playing with house money.
Negotiation context
- Only 2 days on market — expect competitive offers; lowballing is unlikely to land.
- 4 sale attempts since 9y ago with the ask held roughly flat each time — persistent listings suggest the price (not the market) is what's stuck; bring a comps-based counter.
- Current owner paid $4k; list at $67k implies a 1814% gain — meaningful room to come down on a strong offer.
Risks & watch-outs
- Watch-outs: built in 1913 — expect roof / HVAC / electrical / plumbing capex.
Questions for the listing agent
- Built in 1913 — when were the roof, HVAC, electrical panel, plumbing, and water heater last replaced?
- Is there a deadline driving the sale (1031 exchange, divorce, estate, relocation)? That informs how much negotiation room exists.
- Schools are F-rated, which usually means shorter tenancies and higher turnover. Who's the typical renter profile here, and what's been the actual vacancy rate?
- Crime grade is F in this area — have there been break-ins, vandalism, or insurance claims at this property in the last 3 years? What carrier currently insures it and at what premium?
- What's the average days-on-market for RENTAL listings here right now (not sales)? A rising rental-DOM trend means longer vacancies and softer asking-rent achievability than the comps imply.
- What's the recent tenant-quality profile in this submarket — average credit score on applications, eviction rate, late-payment / NSF rate, and stable-employment percentage? A property-management company in the area should have these aggregated.
- How much new for-sale + rental construction is in the pipeline within 1–3 miles? Heavy new supply typically softens prices + rents 12–24 months out; constrained supply supports both.
Investment metrics
- 1% rule
- 2.37% ✓
- Cap rate
- 20.58%
- Cash-on-cash
- 51.02%
- DSCR
- 3.27
- GRM
- 3.5
CMA / ARV
- ARV (on-the-fly)
- $58,999
- Comps found
- 12
Show comp detail 12 sales within ~0.75 mi
| Address | Dist | Beds/Ba | Sqft | Sold | Price | $/sf | Match |
|---|---|---|---|---|---|---|---|
| 193 Massachusetts St | 0.02mi | 3/1.5 (-1) | 1,548 (+8%) | 4mo | $59,900 | $39 | 78 |
| 225 Farrand Park | 0.30mi | 3/1.0 (-1) | 1,458 (+1%) | 2mo | $20,000 | $14 | 75 |
| 207 Connecticut St | 0.14mi | 3/1.0 (-1) | 1,472 (+2%) | 9mo | $35,000 | $24 | 75 |
| 535 Woodland St | 0.28mi | 3/2.0 (-1) | 1,472 (+2%) | 2mo | $170,000 | $115 | 74 |
| 137 Rhode Island St | 0.14mi | 3/2.0 (-1) | 1,405 (-2%) | 12mo | $47,000 | $33 | 72 |
| 202 Farrand Park | 0.26mi | 3/1.0 (-1) | 1,482 (+3%) | 4mo | $40,000 | $27 | 72 |
| 600 Harmon St | 0.49mi | 4/1.0 | 1,375 (-4%) | 6mo | $57,000 | $41 | 62 |
| 194 Farrand Park | 0.26mi | 4/2.0 | 1,610 (+12%) | 5mo | $189,000 | $117 | 62 |
| 29 Tennyson St | 0.39mi | 4/1.0 | 1,596 (+11%) | 16mo | $165,000 | $103 | 48 |
| 324 Woodland St | 0.32mi | 3/1.5 (-1) | 1,648 (+14%) | 15mo | $118,000 | $72 | 44 |
| 53 Richton St | 0.50mi | 3/1.0 (-1) | 1,602 (+11%) | 16mo | $20,000 | $12 | 38 |
| 63 Tyler St | 0.66mi | 3/2.0 (-1) | 1,610 (+12%) | 14mo | $220,000 | $137 | 31 |
Match score weights: distance 35% · size 25% · config 20% · recency 20%. Top-matched comps best support the ARV.
Projected returns pro-forma
-3.0% appreciation · 3.0% rent growth · sell at horizon
- IRR
- 48.8%
- Equity multiple
- 3.13×
- Total profit
- $39,962
- Equity at exit
- $9,990
- IRR
- 54.4%
- Equity multiple
- 6.35×
- Total profit
- $100,292
- Equity at exit
- $5,793
Cash invested: $18,760 (down + closing). Projections, not guarantees.
Landlord ↔ Tenant lean methodology
- Overall (STATE)
- 62 Landlord-Friendly
- State Michigan
- 62 Landlord-Friendly · EVEN
- County
- — inherits STATE
- City
- — inherits STATE
ZIP-level market 48203
- Home prices YoY
- -23.3%
- Active inventory
- 216
- Price-to-rent
- 3.5×
Monthly cashflow live
- Estimated rent
- $1,588 high interval (Pro) →
- Mortgage (P&I)
- −$351
- Tax from tax record
- −$78 /mo · $933/yr
- Insurance
- −$28
- HOA
- −$0
- Vacancy / Maint / Mgmt
- −$333
- Net cashflow
- $798
Break-even live
UW: 25.0% down · 7.5% · 30yr · 1.5% tax · 5.0% vac · 8.0% maint · 8.0% mgmt
Financing live
Cash to close
- Down payment
- $16,750
- Closing costs
- $2,010
- Reserves months
- —
- Total cash needed
- —
Loan-product check · same deal, 3 products live
Conventional
25% down · 7.5% · 30yr
- Down + closing
- —
- Monthly P&I
- —
- Monthly cashflow
- —
- DSCR
- —
- Eligible?
- —
Personal DTI + credit; lowest rate.
DSCR
20% down · 8.5% · 30yr
- Down + closing
- —
- Monthly P&I
- —
- Monthly cashflow
- —
- DSCR
- —
- Eligible?
- —
No personal income docs; deal must DSCR.
Hard money
10% down · 12.0% · 12mo
- Down + closing
- —
- Monthly P&I
- —
- Monthly cashflow
- —
- DSCR
- —
- Eligible?
- —
Short-term bridge; refi at stabilization.
Rent comps 18 comps
| Address | Beds | Baths | Sqft | Rent | $/sqft | DOM | Units | Dist |
|---|---|---|---|---|---|---|---|---|
| 165 Rhode Island St Highland Park, MI | 4.0 | 1.5 | 1639 | $1,200 | $0.73 | 17d | 1 | 0.10mi |
| 101 Colorado St Unit NA Highland Park, MI | 4.0 | 1.5 | 1695 | $1,500 | $0.88 | 24d | 1 | 0.24mi |
| 520 Englewood St Detroit, MI | 4.0 | 1.5 | 1086 | $1,725 | $1.59 | 24d | 1 | 0.36mi |
| 168 Beresford St Highland Park, MI | 4.0 | 1.0 | 1541 | $1,475 | $0.96 | 17d | 1 | 0.46mi |
| 41 Richton St Highland Park, MI | 5.0 | 2.0 | 1871 | $1,800 | $0.96 | 1d | 1 | 0.49mi |
| 41 Richton St Highland Park, MI | 5.0 | 2.0 | 1871 | $1,800 | $0.96 | 14d | 1 | 0.49mi |
| 64 Glendale St Highland Park, MI | 4.0 | 1.0 | 1464 | $1,500 | $1.02 | 10d | 1 | 0.58mi |
| 613 Belmont St Detroit, MI | 3.0 | 1.0 | 1100 | $1,350 | $1.23 | 17d | 1 | 0.59mi |
| 505 Westminster St Detroit, MI | 3.0 | 1.0 | 1700 | $1,400 | $0.82 | 17d | 1 | 0.85mi |
| 156 Leicester Ct Apt 2 Detroit, MI | 3.0 | 1.0 | 1000 | $1,250 | $1.25 | 43d | 1 | 1.04mi |
| 419 King St Detroit, MI | 3.0 | 1.0 | 1668 | $2,300 | $1.38 | 10d | 1 | 1.23mi |
| 1427 Calvert Ave Detroit, MI | 3.0 | 1.0 | 1100 | $1,750 | $1.59 | 43d | 1 | 1.24mi |
| 1427 Calvert Ave Detroit, MI | 3.0 | 1.0 | 1100 | $1,850 | $1.68 | 24d | 1 | 1.24mi |
| 9844 Woodrow Wilson St Detroit, MI | 3.0 | 1.0 | 1187 | $1,300 | $1.10 | 12d | 1 | 1.38mi |
| 528 E Philadelphia St Detroit, MI | 3.0 | 1.0 | 1625 | $2,400 | $1.48 | 1d | 1 | 1.44mi |
| 8416 Brush St Detroit, MI | 3.0 | 1.5 | 1200 | $2,200 | $1.83 | 1d | 1 | 1.47mi |
| 8410 Brush St Detroit, MI | 3.0 | 2.5 | 1300 | $2,200 | $1.69 | 1d | 1 | 1.47mi |
| 68 E Philadelphia St Detroit, MI | 3.0 | 2.0 | 1000 | $1,750 | $1.75 | 43d | 1 | 1.48mi |
Listing history 3 events
-
2026-06-18days on market $67,000 Active 2 DOM
-
2026-06-16remarks 524-char remark
Show marketing remark (524 chars)
Attention investors and owner-occupants! This 4-bedroom, 1-bath colonial offers 1,439 square feet of living space and strong potential for rental income or value-add improvements. Featuring a spacious floor plan, large bedrooms, and classic character throughout, this property presents an excellent opportunity to add to your portfolio or create your ideal home. Conveniently located near major roads, shopping, schools, and local amenities. With the right vision, this property can truly shine. Schedule your showing today!
-
2026-06-16$67,000 Active 1 DOM
Show marketing remark (524 chars)
Attention investors and owner-occupants! This 4-bedroom, 1-bath colonial offers 1,439 square feet of living space and strong potential for rental income or value-add improvements. Featuring a spacious floor plan, large bedrooms, and classic character throughout, this property presents an excellent opportunity to add to your portfolio or create your ideal home. Conveniently located near major roads, shopping, schools, and local amenities. With the right vision, this property can truly shine. Schedule your showing today!
ⓘ Source: listings_history table (triggers on properties + properties_extension) + one-shot
backfill from property_details.listing_events for pre-trigger history.
Tax reassessment forecast MI · Partial reset (capped growth)
- Current annual tax
- $933 · $78/mo
- Projected year-2 tax
- $982 · $82/mo
- Expected delta
- +$50/yr (+$4/mo · 5.3%)
ⓘ Screening estimate from a state-policy table — verify with the county assessor before closing.
Climate risk First Street
- Flood 1/10 Low FEMA zone X (unshaded) · 0% chance over 30 yrs
- Wildfire 1/10 Low
- Heat 3/10 Moderate 7 d/yr ≥96°F today · 15 d/yr by 30 yrs out
- Wind 2/10 Low
- Air quality 4/10 Moderate 4 unhealthy d/yr today · 6 by 30 yrs out
Nearby sold comps map
Loading sold comps map…
Walkable amenities ~0.75 mi
Loading nearby amenities…
Taxation est. · year 1
- Rental income
- $19,057
- − Mortgage interest
- −$3,753
- − Property taxes
- −$933
- − Insurance
- −$335
- − Repairs & maintenance
- −$1,525
- − Management
- −$1,525
- − Depreciation
- −$1,949
- Taxable income
- $9,038
- Est. tax owed @ 24.0%
- −$2,169
- After-tax cash flow
- $7,402/yr
For passive investors: Depreciation is non-cash, so a rental often shows a tax loss while cash-flowing — sheltering income. Rental losses are passive: they offset passive income freely, and up to $25,000/yr can offset ordinary (W-2) income if you actively participate and your MAGI is under $100k (phasing out to $0 by $150k); unused losses carry forward. On sale, claimed depreciation is recaptured at up to 25%, and gains may owe capital-gains tax (a 1031 exchange can defer both). Figures are a year-1 estimate at your 24.0% rate — not tax advice; consult a CPA.
Schools (NCES district)
No district data.
Livability — Highland Park
- Score
- 73/100
- State rank
- #214
- US rank
- #5271
Category grades
Schools grade is shown separately in the Schools card above.
Census & demographics
- Census place
- Highland Park, MI
- County
- Wayne County · 1,562,939 people
- Metro
- Detroit-Warren-Dearborn, MI
- Population (ZIP)
- 20,049
- Household income
- $38,404
- Rent vs Own
- Severe rent burden
- 1192.0
Population outlook (Wayne County) Hauer SSP2
- Today (2025)
- 1,675,273 people
- By 2030
- 1,620,300 · -3.3%
- By 2040
- 1,502,341 · -10.3%
- By 2050
- 1,384,039 · -17.4%
- By 2075
- 1,124,592 · -32.9%
- By 2100
- 881,193 · -47.4%
Race, ethnicity, and origin ACS 2023
- Neighborhood character
- Predominantly Black (85%)
- Race & ethnicity
- Black 85% White 8% Two or more races 5% Hispanic / Latino 2%
- Common ancestry
- Lithuanian 1%
- Foreign-born
- 2% · Canada
- Languages at home
- 95% English-only · Spanish 3% French/Haitian/Cajun 1%
Political lean MEDSL · Wayne
- 2024 margin
- Strong D (+29.0) · D 62.7% · R 33.7% · Other 3.6%
- 2008→2024 swing
- -20.5pp toward R · 2008: 49.5pp · 2024: 29.0pp
- All cycles
- 2024: D+29.0 2020: D+38.1 2016: D+37.3 2012: D+46.9 2008: D+49.5
Not yet ingested
- Civics
- —
Market trends
- HPI YoY
- ▼ -90.13%
- Current HPI
- 297.0176
- Rent YoY
- —
- Metro
- Detroit-Warren-Dearborn, MI
- State GDP YoY
- ▲ 1.37%
- F500 in state
- 28
Industry mix (Fortune 500 HQ in MI)
| Industry | F500 HQs | Revenue |
|---|---|---|
| Automotive Parts | 3 | $48B |
|
||
| Automotive | 2 | $372B |
|
||
| Chemicals | 1 | $45B |
|
||
| Automotive Retail | 1 | $29B |
|
||
| Healthcare / Medical Devices | 1 | $23B |
|
||
| Automotive Technology | 1 | $20B |
|
||
Price history
+1814.3% since first listed8 events — show timeline
- 2026-06-16 Listed $67,000 REALCOMP
- 2026-06-16 Listed $67,000 MiRealSource-MiMLS
- 2017-01-30 Sold (MLS) $3,500 MiRealSource-MiMLS
- 2017-01-30 Sold (MLS) $3,500 REALCOMP
- 2017-01-27 Pending — MiRealSource-MiMLS
- 2017-01-23 Pending — REALCOMP
- 2017-01-18 Listed $3,500 MiRealSource-MiMLS
- 2017-01-18 Listed $3,500 REALCOMP
Property tax history
-0.2%/yrLatest (2025): $933 · -18.5% YoY. Source: county tax records.
Cash-flow waterfall
monthlySold comps — $/sqft
last 12 mo · ≤1 miLoading sold comps…