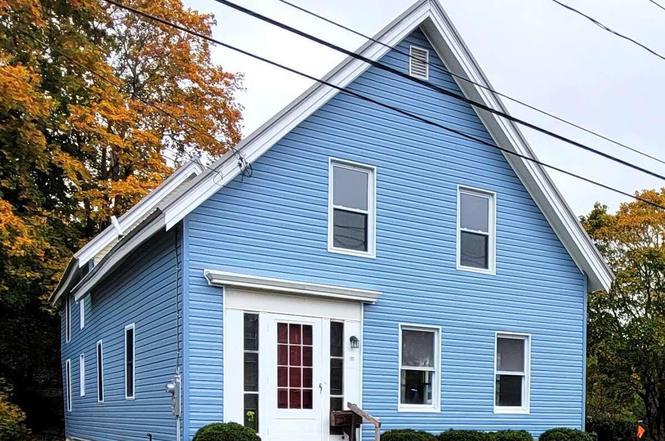
30 Elm St · Old Town, ME
Flood risk 1/10 · Minimal
- FEMA flood zone
- X (unshaded)
- Chance of flooding over 30 yrs
- 0.0%
- Est. flood insurance / yr
- $507 – $1,088
Fire risk 1/10 · Minimal
- Est. fire insurance / yr
- $669 – $1,243
Heat risk 3/10 · Minor
- Hot days now (above 92°F)
- 7 days/yr
- Hot days in 30 yrs
- 15 days/yr
Wind risk 6/10 · Moderate
- Chance of severe wind over 30 yrs
- 27.0%
Air-quality risk 1/10 · Minimal
- Unhealthy air days now
- 0 days/yr
- Unhealthy air days in 30 yrs
- 0 days/yr
Risk factors via First Street. Map © Google.
Why this score? — see what drove the B+ grade
The composite is a weighted blend of 9 inputs, each scored 0–100. Each bar is that input's sub-score; the figure is the points it added to the 100-point composite (weight × sub-score).
- Cash flow +27.0/30.0
- ARV discount +15.0/15.0
- DSCR +9.3/10.0
- 1% rule +8.4/10.0
- Schools +6.8/10.0
- Livability +3.8/5.0
- Rent growth +2.5/5.0
- Condition / age +2.5/5.0
- Appreciation +2.4/10.0
$145,000
🖨 Deal sheet (PDF) 📄 Offer letter ✓ Due diligence
Listing remarks
Fixer-Upper 5 Bed, 1 Bath w/ Duplex Potential Large 0.38 acre lot very conveniently located on Elm st. in Old Town. Just a few minutes from the university. Exterior and foundation work has just been completed. Updates include brand new vinyl siding, 1 inch of foam insulation added, newer metal roof, newer windows (many brand new), painted and/or replaced fascia around house. Solid foundation with some block repairs recently done. Needs complete interior renovation (Electrical, plumbing, drywall, etc. ). Current layout is a 5 bedroom, 1 bath. Could easily add a 2nd bathroom on the second floor. Could potentially be made made into a duplex as well. Includes heated 24x30 1 car garage with att
Key facts
- Large lot
- Solid foundation
- Newer windows
Tags
Property features AI
Finance
- Financial info: Annual taxes listed
Exterior
- Parking: Detached garage (1-car); Carport; 1–4 paved on-site parking spaces
- Utilities: Public water; Public sewer; Electric service with circuit breakers
- Home design: Single family residence; Built in 1890; Pitched metal roof; Vinyl siding with wood frame construction; R-2 general residential zoning; Intown entry orientation
- Construction: Block, stone, and pillar/post/pier foundation
- Exterior features: Sidewalks; In-town location; Near shopping; Neighborhood setting; Paved road
Interior
- Kitchen: Refrigerator; Gas range
- Bedrooms: Five bedrooms, all on the first floor
- Flooring: Wood flooring
- Bathrooms: One full bathroom
- Heating & cooling: Forced air heating; Circuit breaker electric service
- Interior features: Walk-in closets; Storage; Internet access available; Cable
Neighborhood map
What this means for you Summary
Snapshot
- This is a 3-bed/1.0-bath single-family listed at $145k.
Deal economics
- At list price, monthly cash flow is $407 ($5k/yr) — positive.
- The deal already cash-flows at list — no discount required.
- Meets the 1% rule at list price ($2k rent vs $145k).
- Recommended offer: $128k (12.0% below list) — sets the bar for market timing.
- Cap rate 9.7% vs local median 6.0% in Old Town — top-decile yield for the area; either an underpriced asset or a hidden risk that comps aren't pricing in. Stress-test before assuming the spread holds.
Location & tenants
- Location reads 75/100 on livability (#38 in ME, #3,905 nationally) — a middle-class / working-renter tenant base. Strengths: crime A+, cost of living A+, housing A+; Watch: schools D+, employment D, amenities F.
- RSU 34 (suburban): math 81% / reading 83% proficiency, ranked #80 of 112 in ME (top 71%) — strong family-tenant draw, lease renewals of 3-5y typical.
- Market conditions: 46 active listings in the ZIP; 4 comparable units currently listed for rent nearby; rentals lingering (median 45d on market — plan ~5-8 weeks vacancy on turnover, expect pricing pressure); 100% of comp listings sitting > 30 days — soft ceiling on asking rent; 440 units permitted in Penobscot County in 2024 (40 in 5+ unit buildings).
- This rent runs 41% of the median local income ($56k/yr) — at the standard rent-burdened threshold; future hikes will face affordability resistance.
Forward outlook
- Local home prices are declining (-3.0%/yr); year-one equity from $1k of loan paydown is wiped out by about $4k of value loss. Plan a longer hold.
- Penobscot County population projected at -17% by 2050 — secular population decline; favor cash flow + early exit over multi-decade hold.
- At projected returns (-3.0% appreciation + 3.0% rent growth), your $41k cash investment doubles in ~10 years — after that, you're playing with house money.
Negotiation context
- It's been on market 137 days — a 12% lower offer ($128k) is reasonable based on typical stale-listing flexibility.
- 4 sale attempts since 7y ago with the ask held roughly flat each time — persistent listings suggest the price (not the market) is what's stuck; bring a comps-based counter.
Risks & watch-outs
- Watch-outs: property tax is 2.5% of price; built in 1890 — expect roof / HVAC / electrical / plumbing capex.
- Climate carrying-cost: major wind risk, 27% chance of damaging wind over 30y — expect insurance premiums to compound above CPI over the hold.
Questions for the listing agent
- It's been on market 137 days. Have you received any prior offers? Is the seller open to a 12% concession, seller financing, or rate buy-down credit?
- Built in 1890 — when were the roof, HVAC, electrical panel, plumbing, and water heater last replaced?
- Property tax is high relative to price — has the assessment been appealed recently, and will the sale trigger a re-assessment?
- Why hasn't it sold? Are there any deal-killer items the seller is aware of (foundation, flood, title, zoning, code violations)?
- Is there a deadline driving the sale (1031 exchange, divorce, estate, relocation)? That informs how much negotiation room exists.
- Schools are D-rated, which usually means shorter tenancies and higher turnover. Who's the typical renter profile here, and what's been the actual vacancy rate?
- What's the average days-on-market for RENTAL listings here right now (not sales)? A rising rental-DOM trend means longer vacancies and softer asking-rent achievability than the comps imply.
- What's the recent tenant-quality profile in this submarket — average credit score on applications, eviction rate, late-payment / NSF rate, and stable-employment percentage? A property-management company in the area should have these aggregated.
- How much new for-sale + rental construction is in the pipeline within 1–3 miles? Heavy new supply typically softens prices + rents 12–24 months out; constrained supply supports both.
Investment metrics
- 1% rule
- 1.34% ✓
- Cap rate
- 9.66%
- Cash-on-cash
- 12.02%
- DSCR
- 1.53
- GRM
- 6.2
CMA / ARV
- ARV (on-the-fly)
- $251,502
- Comps found
- 12
Show comp detail 12 sales within ~0.75 mi
| Address | Dist | Beds/Ba | Sqft | Sold | Price | $/sf | Match |
|---|---|---|---|---|---|---|---|
| 32 Fifth St | 0.26mi | 3/2.5 | 1,512 (+0%) | 2mo | $295,000 | $195 | 80 |
| 26 Elm St | 0.01mi | 3/2.0 | 1,305 (-13%) | 6mo | $209,000 | $160 | 68 |
| 108 Middle St | 0.14mi | 3/2.0 | 1,368 (-9%) | 9mo | $264,900 | $194 | 67 |
| 24 Gilman Falls Ave | 0.49mi | 3/1.5 | 1,437 (-5%) | 1mo | $271,500 | $189 | 66 |
| 110 Lincoln St | 0.38mi | 3/1.0 | 1,600 (+6%) | 11mo | $284,200 | $178 | 63 |
| 59 Carroll St | 0.45mi | 4/1.5 (+1) | 1,578 (+5%) | 2mo | $251,000 | $159 | 62 |
| 87 Veazie St | 0.31mi | 4/1.5 (+1) | 1,355 (-10%) | 9mo | $215,000 | $159 | 55 |
| 164 Lincoln St | 0.48mi | 3/1.5 | 1,682 (+12%) | 2mo | $281,000 | $167 | 55 |
| 202 Fourth St | 0.34mi | 3/1.0 | 1,700 (+13%) | 12mo | $222,500 | $131 | 52 |
| 377 Stillwater Ave | 0.47mi | 4/2.0 (+1) | 1,614 (+7%) | 7mo | $249,900 | $155 | 51 |
| 133 Front St | 0.65mi | 4/1.0 (+1) | 1,641 (+9%) | 3mo | $179,000 | $109 | 47 |
| 58 Fourth St | 0.61mi | 3/2.5 | 1,650 (+10%) | 8mo | $450,000 | $273 | 43 |
Match score weights: distance 35% · size 25% · config 20% · recency 20%. Top-matched comps best support the ARV.
Projected returns pro-forma
-3.0% appreciation · 3.0% rent growth · sell at horizon
- IRR
- 1.6%
- Equity multiple
- 1.06×
- Total profit
- $2,508
- Equity at exit
- $21,620
- IRR
- 11.3%
- Equity multiple
- 1.89×
- Total profit
- $35,961
- Equity at exit
- $12,537
Cash invested: $40,600 (down + closing). Projections, not guarantees.
Landlord ↔ Tenant lean methodology
- Overall (STATE)
- 41 Moderately Tenant-Leaning
- State Maine
- 41 Moderately Tenant-Leaning · D+2
- County
- — inherits STATE
- City
- — inherits STATE
ZIP-level market 04468
- Home prices YoY
- -1.8%
- Active inventory
- 46
- Price-to-rent
- 6.2×
Monthly cashflow live
- Estimated rent
- $1,941 medium interval (Pro) →
- Mortgage (P&I)
- −$760
- Tax from tax record
- −$306 /mo · $3,668/yr
- Insurance
- −$60
- HOA
- −$0
- Vacancy / Maint / Mgmt
- −$408
- Net cashflow
- $407
Break-even live
Sensitivity live
| Price | -10% $489 | -5% $448 | +0% $407 | +5% $366 | +10% $325 |
|---|---|---|---|---|---|
| Rent | -10% $253 | -5% $330 | +0% $407 | +5% $483 | +10% $560 |
| Rate | -1.0pp $480 | -0.5pp $444 | base $407 | +0.5pp $369 | +1.0pp $331 |
UW: 25.0% down · 7.5% · 30yr · 1.5% tax · 5.0% vac · 8.0% maint · 8.0% mgmt
Financing live
Cash to close
- Down payment
- $36,250
- Closing costs
- $4,350
- Reserves months
- —
- Total cash needed
- —
Loan-product check · same deal, 3 products live
Conventional
25% down · 7.5% · 30yr
- Down + closing
- —
- Monthly P&I
- —
- Monthly cashflow
- —
- DSCR
- —
- Eligible?
- —
Personal DTI + credit; lowest rate.
DSCR
20% down · 8.5% · 30yr
- Down + closing
- —
- Monthly P&I
- —
- Monthly cashflow
- —
- DSCR
- —
- Eligible?
- —
No personal income docs; deal must DSCR.
Hard money
10% down · 12.0% · 12mo
- Down + closing
- —
- Monthly P&I
- —
- Monthly cashflow
- —
- DSCR
- —
- Eligible?
- —
Short-term bridge; refi at stabilization.
Rent comps 4 comps
| Address | Beds | Baths | Sqft | Rent | $/sqft | DOM | Units | Dist |
|---|---|---|---|---|---|---|---|---|
| 21 Jefferson St Unit 5 Old Town, ME | 3.0 | 2.0 | 1250 | $1,795 | $1.44 | 44d | 1 | 0.26mi |
| 53 Perkins Ave Apt 1 Old Town, ME | 3.0 | 1.5 | 1400 | $2,100 | $1.50 | 44d | 1 | 0.38mi |
| 128 Jefferson St Old Town, ME | 3.0 | 1.0 | 1300 | $1,850 | $1.42 | 44d | 1 | 0.42mi |
| 13 Eaton St Old Town, ME | 3.0 | 1.0 | 1200 | $2,100 | $1.75 | 44d | 1 | 0.59mi |
Listing history 27 events
-
2026-06-18status $145,000 Pending 137 DOM
-
2026-06-17days on market $145,000 Active Under Contract 137 DOM
-
2026-06-16days on market $145,000 Active Under Contract 136 DOM
-
2026-06-15days on market $145,000 Active Under Contract 135 DOM
-
2026-06-14days on market $145,000 Active Under Contract 133 DOM
-
2026-06-13days on market $145,000 Active Under Contract 132 DOM
-
2026-06-10days on market $145,000 Active Under Contract 130 DOM
-
2026-06-09days on market $145,000 Active Under Contract 129 DOM
-
2026-06-08days on market $145,000 Active Under Contract 128 DOM
-
2026-06-07days on market $145,000 Active Under Contract 127 DOM
-
2026-06-02days on market $145,000 Active Under Contract 122 DOM
-
2026-06-01days on market $145,000 Active Under Contract 121 DOM
-
2026-05-31days on market $145,000 Active Under Contract 120 DOM
-
2026-05-30days on market $145,000 Active Under Contract 119 DOM
-
2026-04-15historical Active Under Contract
-
2026-03-24price $145,000
-
2026-02-26status Active
-
2026-01-26status Pending
-
2026-01-02$149,000 Active
-
2023-02-16$52,250
-
2019-08-30historical
-
2019-08-06price $90,000
-
2019-07-23price $95,000
-
2019-07-08price $104,000
-
2019-06-05price $109,000
-
2019-04-30price $114,000
-
2019-04-15$119,000 Active
ⓘ Source: listings_history table (triggers on properties + properties_extension) + one-shot
backfill from property_details.listing_events for pre-trigger history.
Tax reassessment forecast ME · Partial reset (capped growth)
- Current annual tax
- $3,668 · $306/mo
- Projected year-2 tax
- $3,668 · $306/mo
- Expected delta
- $0/yr ($0/mo · 0.0%)
ⓘ Screening estimate from a state-policy table — verify with the county assessor before closing.
Climate risk First Street
- Flood 1/10 Low FEMA zone X (unshaded) · 0% chance over 30 yrs
- Wildfire 1/10 Low
- Heat 3/10 Moderate 7 d/yr ≥92°F today · 15 d/yr by 30 yrs out
- Wind 6/10 Major 27% chance of damaging wind over 30 yrs
- Air quality 1/10 Low 0 unhealthy d/yr today · 0 by 30 yrs out
Nearby sold comps map
Loading sold comps map…
Walkable amenities ~0.75 mi
Loading nearby amenities…
Taxation est. · year 1
- Rental income
- $23,288
- − Mortgage interest
- −$8,122
- − Property taxes
- −$3,668
- − Insurance
- −$725
- − Repairs & maintenance
- −$1,863
- − Management
- −$1,863
- − Depreciation
- −$4,218
- Taxable income
- $2,828
- Est. tax owed @ 24.0%
- −$679
- After-tax cash flow
- $4,201/yr
For passive investors: Depreciation is non-cash, so a rental often shows a tax loss while cash-flowing — sheltering income. Rental losses are passive: they offset passive income freely, and up to $25,000/yr can offset ordinary (W-2) income if you actively participate and your MAGI is under $100k (phasing out to $0 by $150k); unused losses carry forward. On sale, claimed depreciation is recaptured at up to 25%, and gains may owe capital-gains tax (a 1031 exchange can defer both). Figures are a year-1 estimate at your 24.0% rate — not tax advice; consult a CPA.
Schools (NCES district)
- District
- RSU 34
- NCES district ID
- 2314782
- Math proficiency
- 81% ▲ 48.00%
- Reading proficiency
- 83% ▲ 31.00%
- Median HH income
- $39,466
- Composite
- 68.31/100
- National rank
- #351
- State rank
- #80 of 112 in ME
Livability — Old Town
- Score
- 75/100
- State rank
- #38
- US rank
- #3905
Category grades
Schools grade is shown separately in the Schools card above.
Census & demographics
- Census place
- Old Town, ME
- County
- Penobscot County · 81,539 people
- City population
- 9,291
- Metro
- Bangor, ME
- Population (ZIP)
- 9,291
- Household income
- $56,358
- Rent vs Own
- Severe rent burden
- 334.0
Population outlook (Penobscot County) Hauer SSP2
- Today (2025)
- 149,928 people
- By 2030
- 146,386 · -2.4%
- By 2040
- 135,952 · -9.3%
- By 2050
- 123,864 · -17.4%
- By 2075
- 97,825 · -34.8%
- By 2100
- 77,196 · -48.5%
Race, ethnicity, and origin ACS 2023
- Neighborhood character
- Predominantly White (88%)
- Race & ethnicity
- White 88% Native American 6% Two or more races 3% Hispanic / Latino 2%
- Common ancestry
- Lithuanian 18% Slovak 4% Romanian 1%
- Foreign-born
- 2% · Canada
- Languages at home
- 96% English-only · French/Haitian/Cajun 1% Other Indo-European 1%
Political lean MEDSL · Penobscot
- 2024 margin
- R (+10.9) · D 43.6% · R 54.5% · Other 1.9%
- 2008→2024 swing
- -15.9pp toward R · 2008: 5.0pp · 2024: -10.9pp
- All cycles
- 2024: R+10.9 2020: R+8.3 2016: R+10.9 2012: D+2.9 2008: D+5.0
Not yet ingested
- Civics
- —
Market trends
- HPI YoY
- ▼ -5.29%
- Current HPI
- 285.3183
- Rent YoY
- —
- Metro
- Bangor, ME
- State GDP YoY
- —
- F500 in state
- 0
Price history
+21.8% since first listed13 events — show timeline
- 2026-04-15 Contingent — MREIS
- 2026-03-24 Price Changed $145,000 MREIS
- 2026-02-26 Relisted — MREIS
- 2026-01-26 Pending — MREIS
- 2026-01-02 Listed $149,000 MREIS
- 2023-02-16 Listed $52,250 MREIS
- 2019-08-30 Delisted — MREIS
- 2019-08-06 Price Changed $90,000 MREIS
- 2019-07-23 Price Changed $95,000 MREIS
- 2019-07-08 Price Changed $104,000 MREIS
- 2019-06-05 Price Changed $109,000 MREIS
- 2019-04-30 Price Changed $114,000 MREIS
- 2019-04-15 Listed $119,000 MREIS
Property tax history
+4.2%/yrLatest (2025): $3,668 · +12.9% YoY. Source: county tax records.
Cash-flow waterfall
monthlySold comps — $/sqft
last 12 mo · ≤1 miLoading sold comps…