 🏗️ New Construction
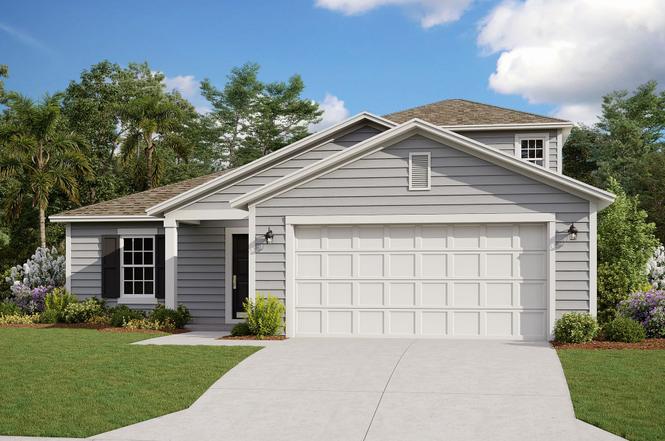
Emory II Plan · Jacksonville, FL
Flood risk 1/10 · Minimal
- FEMA flood zone
- X (unshaded)
- Chance of flooding over 30 yrs
- 0.0%
- Est. flood insurance / yr
- $507 – $1,088
Fire risk 8/10 · Major
- Est. fire insurance / yr
- $947 – $1,759
Heat risk 8/10 · Major
- Hot days now (above 108°F)
- 7 days/yr
- Hot days in 30 yrs
- 19 days/yr
Wind risk 9/10 · Severe
- Chance of severe wind over 30 yrs
- 99.0%
Air-quality risk 3/10 · Minor
- Unhealthy air days now
- 3 days/yr
- Unhealthy air days in 30 yrs
- 3 days/yr
Risk factors via First Street. Map © Google.
Why this score? — see what drove the D grade
The composite is a weighted blend of 9 inputs, each scored 0–100. Each bar is that input's sub-score; the figure is the points it added to the 100-point composite (weight × sub-score).
- Cash flow +10.7/30.0
- ARV discount +7.5/15.0
- Appreciation +5.2/10.0
- Livability +4.2/5.0
- Schools +3.9/10.0
- 1% rule +3.5/10.0
- DSCR +3.1/10.0
- Rent growth +2.5/5.0
- Condition / age +2.5/5.0
$343,990
🖨 Deal sheet 📄 Offer letter ✓ Due diligence
Listing remarks
The Emory II home plan offers a spacious and versatile design featuring 5 bedrooms, 3 bathrooms, and 2,286 square feet of living space. This well-appointed home boasts an open-concept floor plan that seamlessly connects the modern kitchen, dining area, and expansive living room, ideal for both entertaining and everyday living. The additional bedrooms provide ample space and flexibility, perfect for family members, guests, or a home office. With a 2-car garage and contemporary finishes throughout, the Emory II home plan combines elegance, functionality, and modern convenience, ensuring a comfortable and stylish living experience for its residents. Photos are representative of a Emory II Floo
Key facts
- 2 garage spots
- Listed 285 days
Property features AI
Finance
- Other: Address: Emory II Plan, Jacksonville, FL 32234; Listing status: Active
- Financial info: List price $343,990
- HOA & community: Association fee of $100
Exterior
- Parking: 2 total parking spaces; 2-car garage
- Home design: Emory II plan (new construction plan)
Interior
- Bedrooms: 5 bedrooms
- Bathrooms: 3 full bathrooms
- Interior features: Open living area totaling 2,286
Neighborhood map
What this means for you Summary
Snapshot
- This is a 5-bed/3.0-bath single-family listed at $344k.
Deal economics
- At list price, monthly cash flow is $-159 ($-2k/yr) — negative.
- To cash-flow at today's rent, offer at most $308k (10.3% below list).
- To meet the 1% rule (rent ≥ 1% of price), the offer needs to be $282k (17.9% below list).
- Recommended offer: $282k (17.9% below list) — sets the bar for 1% rule.
- Cap rate 5.7% vs local median 4.0% in Jacksonville — top-decile yield for the area; either an underpriced asset or a hidden risk that comps aren't pricing in. Stress-test before assuming the spread holds.
Location & tenants
- Location reads 83/100 on livability (#50 in FL, #911 nationally) — a professional / high-income tenant draw. Strengths: amenities A+, commute A+, housing A+.
- Duval (urban): math 46% / reading 45% proficiency, ranked #48 of 73 in FL (top 66%) — families likely to look elsewhere, expect single-tenant / working-renter base with shorter leases.
- Market conditions: 232 active listings in the ZIP; 4 comparable units currently listed for rent nearby; rentals leasing fast (median 5d on market — plan ~1-2 weeks tenant-placement turnaround); solid renter incomes; 6,503 units permitted in Duval County in 2024 (1,131 in 5+ unit buildings).
- This rent runs 39% of the median local income ($87k/yr) — at the standard rent-burdened threshold; future hikes will face affordability resistance.
Forward outlook
- In year one you build about $4k of equity ($2k loan paydown + $1k appreciation (0.5% local appreciation)).
- Duval County population projected at +19% by 2050 — long-run rental-demand tailwind backs the buy-and-hold thesis.
- By year 8, paydown + projected appreciation supports a ~$33k cash-out refi (75% LTV) — recoverable capital for the next deal without selling this one.
Negotiation context
- It's been on market 286 days — a 12% lower offer ($303k) is reasonable based on typical stale-listing flexibility.
Risks & watch-outs
- Climate carrying-cost: severe wind risk, 99% chance of damaging wind over 30y; severe wildfire risk; extreme-heat days projected 7→19/yr by 2055 (HVAC capex compounding) — expect insurance premiums to compound above CPI over the hold.
Questions for the listing agent
- What do current leases actually rent for vs. the listed asking? Can we see a recent rent roll and the last 12 months of T-12 income?
- It's been on market 286 days. Have you received any prior offers? Is the seller open to a 18% concession, seller financing, or rate buy-down credit?
- What does the HOA fee cover, when was the last increase, and are there any pending special assessments or reserve-fund shortfalls?
- Why hasn't it sold? Are there any deal-killer items the seller is aware of (foundation, flood, title, zoning, code violations)?
- Is there a deadline driving the sale (1031 exchange, divorce, estate, relocation)? That informs how much negotiation room exists.
- Schools are B-rated — typically a magnet for longer-tenancy family renters. What's the average tenant stay here, and is there a school-zone premium baked into asking?
- The area grade is low — what's the realistic commute time and amenity access for the typical tenant pool here? Any planned neighborhood developments (good or bad) we should know about?
- What's the average days-on-market for RENTAL listings here right now (not sales)? A rising rental-DOM trend means longer vacancies and softer asking-rent achievability than the comps imply.
- What's the recent tenant-quality profile in this submarket — average credit score on applications, eviction rate, late-payment / NSF rate, and stable-employment percentage? A property-management company in the area should have these aggregated.
- How much new for-sale + rental construction is in the pipeline within 1–3 miles? Heavy new supply typically softens prices + rents 12–24 months out; constrained supply supports both.
Investment metrics
- 1% rule
- 0.85% ✗
- Cap rate
- 5.72%
- Cash-on-cash
- -2.06%
- DSCR
- 0.91
- GRM
- 9.8
CMA / ARV
- ARV (on-the-fly)
- $331,470
- Comps found
- 7
Show comp detail 7 sales within ~0.75 mi
| Address | Dist | Beds/Ba | Sqft | Sold | Price | $/sf | Match |
|---|---|---|---|---|---|---|---|
| 5724 Lagoon Cruise Way | 0.05mi | 4/3.0 (-1) | 2,500 (+9%) | 2mo | $384,990 | $154 | 75 |
| 5733 Lagoon Cruise Way | 0.09mi | 4/3.0 (-1) | 2,500 (+9%) | 4mo | $389,990 | $156 | 72 |
| 5709 Lagoon Cruise Way | 0.20mi | 4/3.0 (-1) | 2,500 (+9%) | 2mo | $387,990 | $155 | 68 |
| 15330 Bareback Dr | 0.31mi | 4/2.5 (-1) | 2,330 (+2%) | 13mo | $299,000 | $128 | 65 |
| 15336 Spotted Stallion Trl | 0.36mi | 4/3.0 (-1) | 2,262 (-1%) | 16mo | $285,000 | $126 | 64 |
| 6118 Black Filly Ln | 0.47mi | 4/2.5 (-1) | 2,330 (+2%) | 15mo | $337,900 | $145 | 56 |
| 15439 Buckskin Jumper Dr | 0.70mi | 5/3.0 | 2,507 (+10%) | 22mo | $305,000 | $122 | 33 |
Match score weights: distance 35% · size 25% · config 20% · recency 20%. Top-matched comps best support the ARV.
Projected returns pro-forma
0.45% appreciation · 3.0% rent growth · sell at horizon
- IRR
- -2.8%
- Equity multiple
- 0.86×
- Total profit
- $-12,641
- Equity at exit
- $103,778
- IRR
- 2.6%
- Equity multiple
- 1.30×
- Total profit
- $28,014
- Equity at exit
- $130,924
Cash invested: $92,812 (down + closing). Projections, not guarantees.
Landlord ↔ Tenant lean methodology
- Overall (STATE)
- 87 Strongly Landlord-Friendly
- State Florida
- 87 Strongly Landlord-Friendly · R+3
- County
- — inherits STATE
- City
- — inherits STATE
ZIP-level market 32234
- Home prices YoY
- 0.2%
- Active inventory
- 232
- Price-to-rent
- 10.1×
Monthly cashflow live
- Estimated rent
- $2,825 medium interval (Pro) →
- Mortgage (P&I)
- −$1,738
- Tax est. 1.5%
- −$414 /mo · $4,972/yr
- Insurance
- −$138
- HOA
- −$100
- Vacancy / Maint / Mgmt
- −$593
- Net cashflow
- $-159
Break-even live
UW: 25.0% down · 7.5% · 30yr · 1.5% tax · 5.0% vac · 8.0% maint · 8.0% mgmt
Financing live
Cash to close
- Down payment
- $82,868
- Closing costs
- $9,944
- Reserves months
- —
- Total cash needed
- —
Loan-product check · same deal, 3 products live
Conventional
25% down · 7.5% · 30yr
- Down + closing
- —
- Monthly P&I
- —
- Monthly cashflow
- —
- DSCR
- —
- Eligible?
- —
Personal DTI + credit; lowest rate.
DSCR
20% down · 8.5% · 30yr
- Down + closing
- —
- Monthly P&I
- —
- Monthly cashflow
- —
- DSCR
- —
- Eligible?
- —
No personal income docs; deal must DSCR.
Hard money
10% down · 12.0% · 12mo
- Down + closing
- —
- Monthly P&I
- —
- Monthly cashflow
- —
- DSCR
- —
- Eligible?
- —
Short-term bridge; refi at stabilization.
Rent comps 4 comps
| Address | Beds | Baths | Sqft | Rent | $/sqft | DOM | Units | Dist |
|---|---|---|---|---|---|---|---|---|
| 5724 Lagoon Cruise Way Jacksonville, FL | 4.0 | 3.0 | 2494 | $2,800 | $1.12 | 4d | 1 | 0.08mi |
| 15180 Bareback Dr Jacksonville, FL | 4.0 | 2.0 | 1840 | $1,999 | $1.09 | 3d | 1 | 0.26mi |
| 6092 Bucking Bronco Dr Jacksonville, FL | 4.0 | 2.0 | 1778 | $1,995 | $1.12 | 7d | 1 | 1.10mi |
| 15647 Woodbury Dr Jacksonville, FL | 3.0–5.0 | 2.0–3.5 | 1863 | $2,670 | $1.43 | 1d | 27 | 1.31mi |
HOA detail
- Monthly dues
- $100 · $1,200/yr
Listing history 10 events
-
2026-06-18days on market $343,990 Active 286 DOM
-
2026-06-17days on market $343,990 Active 285 DOM
-
2026-06-16days on market $343,990 Active 284 DOM
-
2026-06-15days on market $343,990 Active 283 DOM
-
2026-06-10days on market $343,990 Active 277 DOM
-
2026-06-08days on market $343,990 Active 276 DOM
-
2026-06-03days on market $343,990 Active 271 DOM
-
2026-06-02days on market $343,990 Active 270 DOM
-
2026-06-01days on market $343,990 Active 269 DOM
-
2026-05-31days on market $343,990 Active 268 DOM
ⓘ Source: listings_history table (triggers on properties + properties_extension) + one-shot
backfill from property_details.listing_events for pre-trigger history.
Climate risk First Street
- Flood 1/10 Low FEMA zone X (unshaded) · 0% chance over 30 yrs
- Wildfire 8/10 Severe
- Heat 8/10 Severe 7 d/yr ≥108°F today · 19 d/yr by 30 yrs out
- Wind 9/10 Extreme 99% chance of damaging wind over 30 yrs
- Air quality 3/10 Moderate 3 unhealthy d/yr today · 3 by 30 yrs out
Nearby sold comps map
Loading sold comps map…
Walkable amenities ~0.75 mi
Loading nearby amenities…
Taxation est. · year 1
- Rental income
- $33,900
- − Mortgage interest
- −$18,567
- − Property taxes
- −$4,972
- − Insurance
- −$1,657
- − Repairs & maintenance
- −$2,712
- − Management
- −$2,712
- − HOA
- −$1,200
- − Depreciation
- −$9,643
- Taxable loss
- −$7,564
- Est. tax savings @ 24.0%
- +$1,815
- After-tax cash flow
- $-93/yr
For passive investors: Depreciation is non-cash, so a rental often shows a tax loss while cash-flowing — sheltering income. Rental losses are passive: they offset passive income freely, and up to $25,000/yr can offset ordinary (W-2) income if you actively participate and your MAGI is under $100k (phasing out to $0 by $150k); unused losses carry forward. On sale, claimed depreciation is recaptured at up to 25%, and gains may owe capital-gains tax (a 1031 exchange can defer both). Figures are a year-1 estimate at your 24.0% rate — not tax advice; consult a CPA.
Schools (NCES district)
- District
- Duval
- NCES district ID
- 1200480
- Math proficiency
- 46% ▼ -11.00%
- Reading proficiency
- 45% ▼ -4.00%
- Median HH income
- $48,987
- Composite
- 38.97/100
- National rank
- #4076
- State rank
- #48 of 73 in FL
Livability — Jacksonville
- Score
- 83/100
- State rank
- #50
- US rank
- #911
Category grades
Schools grade is shown separately in the Schools card above.
Census & demographics
- Census place
- Jacksonville, FL
- County
- Duval County · 1,015,274 people
- City population
- 979,034
- Metro
- Jacksonville, FL
- Population (ZIP)
- 9,678
- Household income
- $87,331
- Rent vs Own
- Severe rent burden
- 62.0
Population outlook (Duval County) Hauer SSP2
- Today (2025)
- 1,013,010 people
- By 2030
- 1,059,228 · +4.6%
- By 2040
- 1,141,439 · +12.7%
- By 2050
- 1,205,258 · +19.0%
- By 2075
- 1,324,282 · +30.7%
- By 2100
- 1,319,620 · +30.3%
Race, ethnicity, and origin ACS 2023
- Neighborhood character
- Predominantly White (76%)
- Race & ethnicity
- White 76% Black 16% Hispanic / Latino 6% Two or more races 4%
- Hispanic origin (detail)
- Mexican 1% Puerto Rican 2% Salvadoran 1%
- Common ancestry
- Serbian 2% Lithuanian 1% Slovak 1%
- Foreign-born
- 4% · Canada, Dominican Republic
- Languages at home
- 95% English-only · Spanish 4%
Political lean MEDSL · Duval
- 2024 margin
- Toss-up / Even · D 48.7% · R 50.1% · Other 1.2%
- 2008→2024 swing
- +0.4pp no change · 2008: -1.9pp · 2024: -1.5pp
- All cycles
- 2024: R+1.5 2020: D+3.8 2016: R+1.5 2012: R+3.6 2008: R+1.9
Not yet ingested
- Civics
- —
Market trends
- HPI YoY
- ▲ 0.45%
- Current HPI
- 288.4613
- Rent YoY
- —
- Metro
- Jacksonville, FL
- State GDP YoY
- ▲ 3.28%
- F500 in state
- 36
Industry mix (Fortune 500 HQ in FL)
| Industry | F500 HQs | Revenue |
|---|---|---|
| Industrial Technology | 2 | $29B |
|
||
| Insurance | 2 | $17B |
|
||
| Retail | 1 | $60B |
|
||
| Technology Distribution | 1 | $58B |
|
||
| Homebuilding | 1 | $35B |
|
||
| Technology Manufacturing | 1 | $35B |
|
||
Cash-flow waterfall
monthlySold comps — $/sqft
last 12 mo · ≤1 miLoading sold comps…