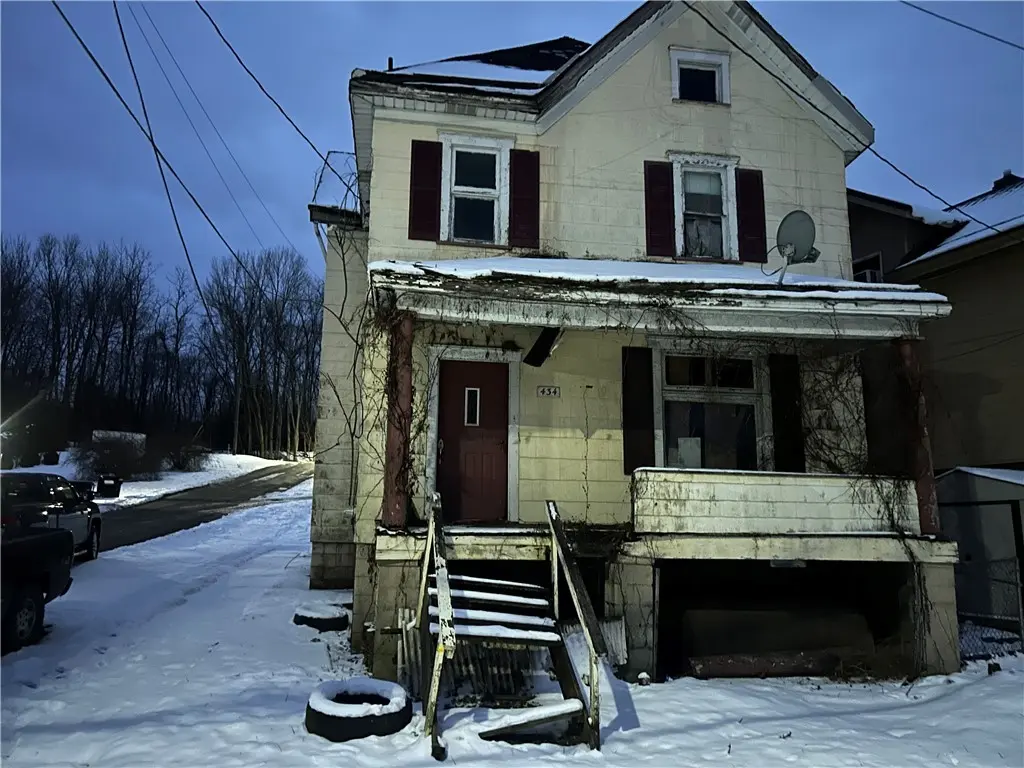
434 F A Cassin Jr Ave · Newell, PA
Flood risk 1/10 · Minimal
- FEMA flood zone
- X (unshaded)
- Chance of flooding over 30 yrs
- 0.0%
- Est. flood insurance / yr
- $473 – $860
Fire risk 1/10 · Minimal
- Est. fire insurance / yr
- $511 – $949
Heat risk 4/10 · Minor
- Hot days now (above 99°F)
- 7 days/yr
- Hot days in 30 yrs
- 19 days/yr
Wind risk 2/10 · Minimal
- Chance of severe wind over 30 yrs
- —
Air-quality risk 2/10 · Minimal
- Unhealthy air days now
- 1 days/yr
- Unhealthy air days in 30 yrs
- 2 days/yr
Risk factors via First Street. Map © Google.
Why this score? — see what drove the B+ grade
The composite is a weighted blend of 9 inputs, each scored 0–100. Each bar is that input's sub-score; the figure is the points it added to the 100-point composite (weight × sub-score).
- Cash flow +30.0/30.0
- 1% rule +10.0/10.0
- DSCR +10.0/10.0
- ARV discount +7.5/15.0
- Appreciation +7.0/10.0
- Schools +3.3/10.0
- Livability +3.2/5.0
- Rent growth +2.5/5.0
- Condition / age +2.5/5.0
$30,000
🖨 Deal sheet 📄 Offer letter ✓ Due diligence
Listing remarks MLS
According to the seller, property will need torn-down. Demolition permit in hand.
Key facts
- 4,983 sq ft lot
- Built 1900
- Listed 51 days
Property features AI
Finance
- HOA & community: Access to public transportation
Exterior
- Parking: On-street parking
- Utilities: Public water service; Public sewer service; Electric service
- Home design: 2-story frame residence; Asphalt roof; Resale property
- Construction: Frame construction; Asphalt roof
- Exterior features: On-street parking; Public water; Public sewer
Interior
- Flooring: Hardwood
- Bathrooms: 1 full bathroom; 1 half bathroom
- Heating & cooling: Gas heating; Electric and gas cooling available
- Interior features: Hardwood floors; Basement with walk-out access
Neighborhood map
What this means for you Summary
Snapshot
- This is a 2-bed/1.5-bath single-family listed at $30k.
Deal economics
- At list price, monthly cash flow is $609 ($7k/yr) — positive.
- The deal already cash-flows at list — no discount required.
- Meets the 1% rule at list price ($1k rent vs $30k).
- Recommended offer: $29k (3.0% below list) — sets the bar for market timing.
Location & tenants
- Location reads 65/100 on livability (#1,104 in PA) — a middle-class / working-renter tenant base. Strengths: cost of living A+, housing A+, employment B+; Watch: crime C-, health & safety D, schools F.
- Frazier SD (rural): math 25% / reading 52% proficiency, ranked #371 of 539 in PA (top 69%) — families likely to look elsewhere, expect single-tenant / working-renter base with shorter leases.
- Market conditions: 1 active listings in the ZIP; 4 comparable units currently listed for rent nearby; rentals lingering (median 44d on market — plan ~5-8 weeks vacancy on turnover, expect pricing pressure); 50% of comp listings sitting > 30 days — soft ceiling on asking rent; 201 units permitted in Fayette County in 2024 (10 in 5+ unit buildings).
Forward outlook
- In year one you build about $1k of equity ($207 loan paydown + $1k appreciation (4.0% local appreciation)).
- Fayette County population projected at -19% by 2050 — secular population decline; favor cash flow + early exit over multi-decade hold.
- At projected returns (4.0% appreciation + 3.0% rent growth), your $8k cash investment doubles in ~1 year — after that, you're playing with house money.
Negotiation context
- It's been on market 51 days — a 3% lower offer ($29k) is reasonable based on typical stale-listing flexibility.
- 4 sale attempts since 2y ago with the ask held roughly flat each time — persistent listings suggest the price (not the market) is what's stuck; bring a comps-based counter.
- Current owner paid $20k; list at $30k implies a 50% gain — meaningful room to come down on a strong offer.
Risks & watch-outs
- Watch-outs: built in 1900 — expect roof / HVAC / electrical / plumbing capex.
Questions for the listing agent
- It's been on market 51 days. Have you received any prior offers? Is the seller open to a 3% concession, seller financing, or rate buy-down credit?
- Built in 1900 — when were the roof, HVAC, electrical panel, plumbing, and water heater last replaced?
- Is there a deadline driving the sale (1031 exchange, divorce, estate, relocation)? That informs how much negotiation room exists.
- Schools are F-rated, which usually means shorter tenancies and higher turnover. Who's the typical renter profile here, and what's been the actual vacancy rate?
- What's the average days-on-market for RENTAL listings here right now (not sales)? A rising rental-DOM trend means longer vacancies and softer asking-rent achievability than the comps imply.
- What's the recent tenant-quality profile in this submarket — average credit score on applications, eviction rate, late-payment / NSF rate, and stable-employment percentage? A property-management company in the area should have these aggregated.
- How much new for-sale + rental construction is in the pipeline within 1–3 miles? Heavy new supply typically softens prices + rents 12–24 months out; constrained supply supports both.
Investment metrics
- 1% rule
- 3.45% ✓
- Cap rate
- 30.66%
- Cash-on-cash
- 87.03%
- DSCR
- 4.87
- GRM
- 2.4
CMA / ARV
- ARV (median comp)
- $103,610
- List price
- $30,000
- Delta
- -71.05%
- Verdict
- UNDERPRICED
- Comps
- 20 within 1.0 mi
Show comp detail 2 sales within ~0.75 mi
| Address | Dist | Beds/Ba | Sqft | Sold | Price | $/sf | Match |
|---|---|---|---|---|---|---|---|
| 227 1st St | 0.54mi | 3/2.0 (+1) | 1,416 (+8%) | 14mo | $104,000 | $73 | 44 |
| 416 Ash St | 0.73mi | 3/2.0 (+1) | 1,250 (-5%) | 14mo | $158,000 | $126 | 39 |
Match score weights: distance 35% · size 25% · config 20% · recency 20%. Top-matched comps best support the ARV.
Projected returns pro-forma
3.97% appreciation · 3.0% rent growth · sell at horizon
- IRR
- 92.0%
- Equity multiple
- 6.24×
- Total profit
- $44,000
- Equity at exit
- $15,156
- IRR
- 91.0%
- Equity multiple
- 12.95×
- Total profit
- $100,421
- Equity at exit
- $24,746
Cash invested: $8,400 (down + closing). Projections, not guarantees.
Landlord ↔ Tenant lean methodology
- Overall (STATE)
- 62 Landlord-Friendly
- State Pennsylvania
- 62 Landlord-Friendly · EVEN
- County
- — inherits STATE
- City
- — inherits STATE
ZIP-level market 15466
- Home prices YoY
- 2.2%
- Active inventory
- 1
- Price-to-rent
- 2.4×
Monthly cashflow live
- Estimated rent
- $1,034 medium interval (Pro) →
- Mortgage (P&I)
- −$157
- Tax est. 1.5%
- −$38 /mo · $450/yr
- Insurance
- −$12
- HOA
- −$0
- Vacancy / Maint / Mgmt
- −$217
- Net cashflow
- $609
Break-even live
UW: 25.0% down · 7.5% · 30yr · 1.5% tax · 5.0% vac · 8.0% maint · 8.0% mgmt
Financing live
Cash to close
- Down payment
- $7,500
- Closing costs
- $900
- Reserves months
- —
- Total cash needed
- —
Loan-product check · same deal, 3 products live
Conventional
25% down · 7.5% · 30yr
- Down + closing
- —
- Monthly P&I
- —
- Monthly cashflow
- —
- DSCR
- —
- Eligible?
- —
Personal DTI + credit; lowest rate.
DSCR
20% down · 8.5% · 30yr
- Down + closing
- —
- Monthly P&I
- —
- Monthly cashflow
- —
- DSCR
- —
- Eligible?
- —
No personal income docs; deal must DSCR.
Hard money
10% down · 12.0% · 12mo
- Down + closing
- —
- Monthly P&I
- —
- Monthly cashflow
- —
- DSCR
- —
- Eligible?
- —
Short-term bridge; refi at stabilization.
Rent comps 4 comps
| Address | Beds | Baths | Sqft | Rent | $/sqft | DOM | Units | Dist |
|---|---|---|---|---|---|---|---|---|
| 115 1st St Unit 1 California, PA | 3.0 | 1.0 | 1200 | $950 | $0.79 | 43d | 1 | 0.50mi |
| 54 Temperance Way Unit 7 California, PA | 3.0 | 2.0 | 1300 | $1,095 | $0.84 | 14d | 1 | 0.52mi |
| 72 Second St Unit 6 California, PA | 3.0 | 2.0 | 1004 | $1,250 | $1.25 | 23d | 1 | 0.54mi |
| 300 Strawberry Way California, PA | 2.0 | 1.0 | 900 | $775 | $0.86 | 43d | 1 | 0.65mi |
Listing history 24 events
-
2026-06-18days on market $30,000 Active 51 DOM
-
2026-06-17days on market $30,000 Active 50 DOM
-
2026-06-16days on market $30,000 Active 49 DOM
-
2026-06-15days on market $30,000 Active 48 DOM
-
2026-06-13days on market $30,000 Active 46 DOM
-
2026-06-12days on market $30,000 Active 45 DOM
-
2026-06-09pricedays on market $30,000 Active 42 DOM
-
2026-06-08days on market $25,000 Active 41 DOM
-
2026-06-08days on market $25,000 Active 40 DOM
-
2026-06-07days on market $25,000 Active 39 DOM
-
2026-06-04days on market $25,000 Active 36 DOM
-
2026-06-02days on market $25,000 Active 35 DOM
-
2026-06-01days on market $25,000 Active 34 DOM
-
2026-05-31days on market $25,000 Active 33 DOM
-
2026-05-13price $25,000 81-char remark
-
2026-04-28$30,000 Active 81-char remark
-
2026-04-08$30,000 Active 81-char remark
Show marketing remark (81 chars)
According to the seller, property will need torn-down. Demolition permit in hand.
-
2026-03-31price $35,000
Show marketing remark (81 chars)
According to the seller, property will need torn-down. Demolition permit in hand.
-
2026-02-12price $40,000
Show marketing remark (81 chars)
According to the seller, property will need torn-down. Demolition permit in hand.
-
2026-01-07price $50,000
Show marketing remark (81 chars)
According to the seller, property will need torn-down. Demolition permit in hand.
-
2025-12-19$55,000 Active
Show marketing remark (81 chars)
According to the seller, property will need torn-down. Demolition permit in hand.
-
2024-11-12price $15,000
-
2024-09-23$20,000 Active
-
2002-04-30soldstatus $20,000
ⓘ Source: listings_history table (triggers on properties + properties_extension) + one-shot
backfill from property_details.listing_events for pre-trigger history.
Climate risk First Street
- Flood 1/10 Low FEMA zone X (unshaded) · 0% chance over 30 yrs
- Wildfire 1/10 Low
- Heat 4/10 Moderate 7 d/yr ≥99°F today · 19 d/yr by 30 yrs out
- Wind 2/10 Low
- Air quality 2/10 Low 1 unhealthy d/yr today · 2 by 30 yrs out
Nearby sold comps map
Loading sold comps map…
Walkable amenities ~0.75 mi
Loading nearby amenities…
Taxation est. · year 1
- Rental income
- $12,404
- − Mortgage interest
- −$1,680
- − Property taxes
- −$450
- − Insurance
- −$150
- − Repairs & maintenance
- −$992
- − Management
- −$992
- − Depreciation
- −$873
- Taxable income
- $7,266
- Est. tax owed @ 24.0%
- −$1,744
- After-tax cash flow
- $5,567/yr
For passive investors: Depreciation is non-cash, so a rental often shows a tax loss while cash-flowing — sheltering income. Rental losses are passive: they offset passive income freely, and up to $25,000/yr can offset ordinary (W-2) income if you actively participate and your MAGI is under $100k (phasing out to $0 by $150k); unused losses carry forward. On sale, claimed depreciation is recaptured at up to 25%, and gains may owe capital-gains tax (a 1031 exchange can defer both). Figures are a year-1 estimate at your 24.0% rate — not tax advice; consult a CPA.
Schools (NCES district)
- District
- Frazier SD
- NCES district ID
- 4210350
- Math proficiency
- 25% ▼ -16.00%
- Reading proficiency
- 52% ▼ -7.00%
- Median HH income
- $46,463
- Composite
- 32.8/100
- National rank
- #5628
- State rank
- #371 of 539 in PA
Livability — Newell
- Score
- 65/100
- State rank
- #1104
- US rank
- #12551
Category grades
Schools grade is shown separately in the Schools card above.
Census & demographics
- Census place
- Newell, PA
- City population
- 437
- Population (ZIP)
- 437
Population outlook (Fayette County) Hauer SSP2
- Today (2025)
- 127,561 people
- By 2030
- 123,206 · -3.4%
- By 2040
- 113,232 · -11.2%
- By 2050
- 103,468 · -18.9%
- By 2075
- 83,185 · -34.8%
- By 2100
- 62,384 · -51.1%
Race, ethnicity, and origin ACS 2023
- Neighborhood character
- Predominantly White (97%)
- Race & ethnicity
- White 97% Hispanic / Latino 2%
- Common ancestry
- Slovak 3% Estonian 2% Iranian 2%
- Foreign-born
- 2% · Canada
- Languages at home
- 93% English-only · Spanish 4% Other Indo-European 2%
Political lean MEDSL · Fayette
- 2024 margin
- Solid R (+37.9) · D 30.8% · R 68.7%
- 2008→2024 swing
- -37.5pp toward R · 2008: -0.4pp · 2024: -37.9pp
- All cycles
- 2024: R+37.9 2020: R+33.5 2016: R+31.0 2012: R+8.3 2008: R+0.4
Not yet ingested
- Civics
- —
Market trends
- HPI YoY
- ▲ 3.97%
- Current HPI
- 184.3297
- Rent YoY
- —
- Metro
- —
- State GDP YoY
- ▲ 1.68%
- F500 in state
- 34
Industry mix (Fortune 500 HQ in PA)
| Industry | F500 HQs | Revenue |
|---|---|---|
| Healthcare | 2 | $309B |
|
||
| Insurance | 2 | $27B |
|
||
| Telecommunications / Media | 1 | $124B |
|
||
| Industrial Distribution | 1 | $22B |
|
||
| Financial Services | 1 | $20B |
|
||
| Chemicals / Materials | 1 | $18B |
|
||
Price history
+50.0% since first listed11 events — show timeline
- 2026-06-09 Price Changed $30,000 West Penn MLS
- 2026-05-13 Price Changed $25,000 West Penn MLS
- 2026-04-28 Listed $30,000 West Penn MLS
- 2026-04-08 Listed $30,000 West Penn MLS
- 2026-03-31 Price Changed $35,000 West Penn MLS
- 2026-02-12 Price Changed $40,000 West Penn MLS
- 2026-01-07 Price Changed $50,000 West Penn MLS
- 2025-12-19 Listed $55,000 West Penn MLS
- 2024-11-12 Price Changed $15,000 West Penn MLS
- 2024-09-23 Listed $20,000 West Penn MLS
- 2002-04-30 Sold (Public Records) $20,000 Public Records
Property tax history
+4.5%/yrLatest (2026): $2,043 · +3.7% YoY. Source: county tax records.
Cash-flow waterfall
monthlySold comps — $/sqft
last 12 mo · ≤1 miLoading sold comps…