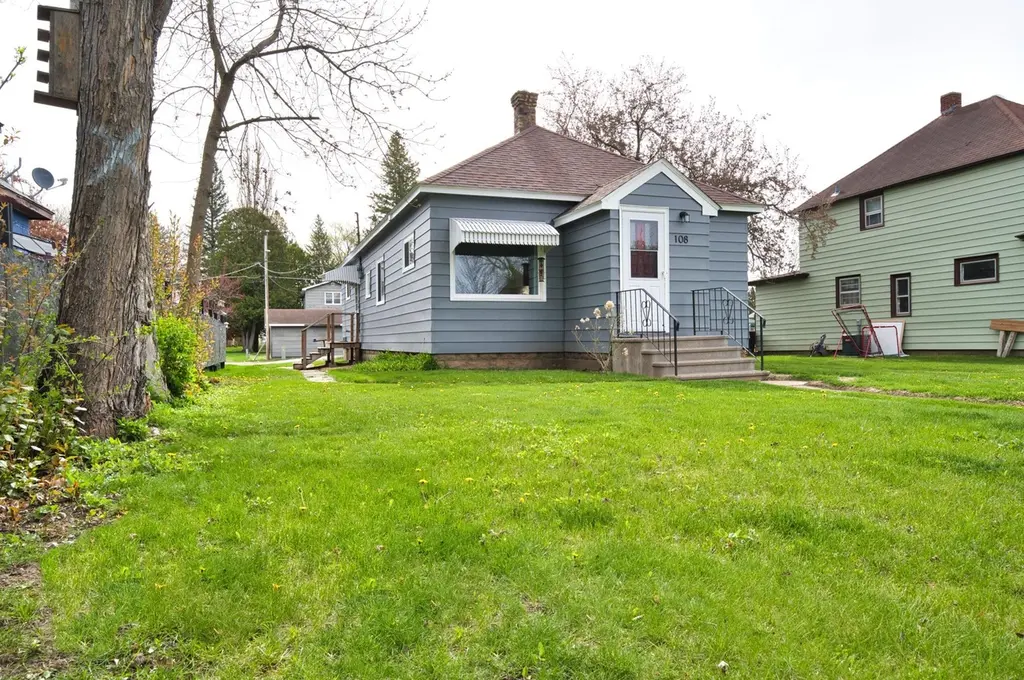
108 Bawden St · Greenway, MN
Flood risk 1/10 · Minimal
- FEMA flood zone
- —
- Chance of flooding over 30 yrs
- 0.0%
- Est. flood insurance / yr
- —
Fire risk 5/10 · Moderate
- Est. fire insurance / yr
- $888 – $1,650
Heat risk 1/10 · Minimal
- Hot days now (above 93°F)
- 7 days/yr
- Hot days in 30 yrs
- 12 days/yr
Wind risk 1/10 · Minimal
- Chance of severe wind over 30 yrs
- —
Air-quality risk 2/10 · Minimal
- Unhealthy air days now
- 0 days/yr
- Unhealthy air days in 30 yrs
- 1 days/yr
Risk factors via First Street. Map © Google.
Why this score? — see what drove the C grade
The composite is a weighted blend of 9 inputs, each scored 0–100. Each bar is that input's sub-score; the figure is the points it added to the 100-point composite (weight × sub-score).
- Cash flow +21.8/30.0
- ARV discount +7.5/15.0
- DSCR +7.0/10.0
- Appreciation +5.2/10.0
- 1% rule +4.8/10.0
- Schools +3.7/10.0
- Rent growth +2.5/5.0
- Livability +2.5/5.0
- Condition / age +2.5/5.0
$139,900
🖨 Deal sheet 📄 Offer letter ✓ Due diligence
Listing remarks
Great two-bedroom one bath rambler with metal siding. Updated bath and kitchen, nice sized bedrooms and possibility for a 3rd bedroom that is currently used as main floor laundry. 24 x 28 two stall detached garage. Newer shingles in 2009 updated electric service box to be installed.
Key facts
- Newer shingles
- Updated bath
- Metal siding
Tags
Property features AI
Exterior
- Parking: Detached or attached 2-car garage (672 sf garage)
- Utilities: City water connected; City sewer connected; Natural gas fuel; 100 amp electric service (Minnesota Power)
- Home design: Residential property, one story; Main entry and living areas on main level; Living room (12.9x21), Dining room (9x11.5), Office (9x13.5)
- Construction: Frame construction; Block foundation; Asphalt roof (8 years old or newer); Built with approx. 1,114 sq ft finished above grade and 1,078 below-grade foundation area
- Exterior features: Light tree coverage; Metal exterior
Interior
- Kitchen: Kitchen on main level (11.6x10); Range, Refrigerator, Freezer
- Bedrooms: Two bedrooms on the main level (10x13; 10x12)
- Bathrooms: One full bathroom on the main floor
- Heating & cooling: Hot water heat; No central air
- Interior features: Main floor primary bedroom; Main floor laundry; Informal dining room; Freezer, Range, Refrigerator
- Laundry & utility: Main level laundry
Neighborhood map
What this means for you Summary
Snapshot
- This is a 2-bed/1.0-bath single-family listed at $140k.
Deal economics
- At list price, monthly cash flow is $218 ($3k/yr) — positive.
- The deal already cash-flows at list — no discount required.
- To meet the 1% rule (rent ≥ 1% of price), the offer needs to be $137k (2.4% below list).
- Recommended offer: $137k (2.4% below list) — sets the bar for 1% rule.
Location & tenants
- Location reads: area grade C — affects rentability + tenant quality, not the cash-flow math above.
- Greenway Public School District (rural): math 40% / reading 47% proficiency, ranked #196 of 301 in MN (top 65%) — families likely to look elsewhere, expect single-tenant / working-renter base with shorter leases.
- Market conditions: 2 active listings in the ZIP; 121 units permitted in Itasca County in 2024 (0 in 5+ unit buildings).
Forward outlook
- In year one you build about $1k of equity ($967 loan paydown + $470 appreciation (0.3% local appreciation)).
- Itasca County population projected to shrink 4% by 2050 — rents likely to lag national; underwrite the cash flow, not the appreciation.
- At projected returns (0.3% appreciation + 3.0% rent growth), your $39k cash investment doubles in ~8 years — after that, you're playing with house money.
Negotiation context
- It's been on market 22 days — a 2% lower offer ($138k) is reasonable based on typical stale-listing flexibility.
- 2 sale attempts since 13y ago with the ask held roughly flat each time — persistent listings suggest the price (not the market) is what's stuck; bring a comps-based counter.
- Current owner paid $55k; list at $140k implies a 154% gain — meaningful room to come down on a strong offer.
Risks & watch-outs
- Watch-outs: built in 1910 — expect roof / HVAC / electrical / plumbing capex.
- Climate carrying-cost: moderate wildfire risk — expect insurance premiums to compound above CPI over the hold.
Questions for the listing agent
- Built in 1910 — when were the roof, HVAC, electrical panel, plumbing, and water heater last replaced?
- Is there a deadline driving the sale (1031 exchange, divorce, estate, relocation)? That informs how much negotiation room exists.
- What's the average days-on-market for RENTAL listings here right now (not sales)? A rising rental-DOM trend means longer vacancies and softer asking-rent achievability than the comps imply.
- What's the recent tenant-quality profile in this submarket — average credit score on applications, eviction rate, late-payment / NSF rate, and stable-employment percentage? A property-management company in the area should have these aggregated.
- How much new for-sale + rental construction is in the pipeline within 1–3 miles? Heavy new supply typically softens prices + rents 12–24 months out; constrained supply supports both.
Investment metrics
- 1% rule
- 0.98% ✗
- Cap rate
- 8.16%
- Cash-on-cash
- 6.67%
- DSCR
- 1.30
- GRM
- 8.5
CMA / ARV
No comps found within radius.
Projected returns pro-forma
0.34% appreciation · 3.0% rent growth · sell at horizon
- IRR
- 6.3%
- Equity multiple
- 1.31×
- Total profit
- $11,951
- Equity at exit
- $42,991
- IRR
- 11.1%
- Equity multiple
- 2.25×
- Total profit
- $48,979
- Equity at exit
- $53,607
Cash invested: $39,172 (down + closing). Projections, not guarantees.
Landlord ↔ Tenant lean methodology
- Overall (STATE)
- 46 Balanced
- State Minnesota
- 46 Balanced · D+2
- County
- — inherits STATE
- City
- — inherits STATE
ZIP-level market 55764
- Home prices YoY
- 0.3%
- Active inventory
- 2
- Price-to-rent
- 8.5×
Monthly cashflow live
- Estimated rent
- $1,365 medium interval (Pro) →
- Mortgage (P&I)
- −$734
- Tax from tax record
- −$69 /mo · $826/yr
- Insurance
- −$58
- HOA
- −$0
- Vacancy / Maint / Mgmt
- −$287
- Net cashflow
- $218
Break-even live
UW: 25.0% down · 7.5% · 30yr · 1.5% tax · 5.0% vac · 8.0% maint · 8.0% mgmt
Financing live
Cash to close
- Down payment
- $34,975
- Closing costs
- $4,197
- Reserves months
- —
- Total cash needed
- —
Loan-product check · same deal, 3 products live
Conventional
25% down · 7.5% · 30yr
- Down + closing
- —
- Monthly P&I
- —
- Monthly cashflow
- —
- DSCR
- —
- Eligible?
- —
Personal DTI + credit; lowest rate.
DSCR
20% down · 8.5% · 30yr
- Down + closing
- —
- Monthly P&I
- —
- Monthly cashflow
- —
- DSCR
- —
- Eligible?
- —
No personal income docs; deal must DSCR.
Hard money
10% down · 12.0% · 12mo
- Down + closing
- —
- Monthly P&I
- —
- Monthly cashflow
- —
- DSCR
- —
- Eligible?
- —
Short-term bridge; refi at stabilization.
Listing history 19 events
-
2026-06-18days on market $139,900 Active 22 DOM
-
2026-06-17days on market $139,900 Active 21 DOM
-
2026-06-16days on market $139,900 Active 20 DOM
-
2026-06-16price $139,900 Active 19 DOM
-
2026-06-15days on market $144,900 Active 19 DOM
-
2026-06-13days on market $144,900 Active 17 DOM
-
2026-06-12days on market $144,900 Active 16 DOM
-
2026-06-09days on market $144,900 Active 13 DOM
-
2026-06-08days on market $144,900 Active 12 DOM
-
2026-06-07days on market $144,900 Active 11 DOM
-
2026-06-07days on market $144,900 Active 10 DOM
-
2026-06-04days on market $144,900 Active 7 DOM
-
2026-06-02days on market $144,900 Active 6 DOM
-
2026-06-01days on market $144,900 Active 5 DOM
-
2026-05-31days on market $144,900 Active 4 DOM
-
2026-05-31days on market $144,900 Active 3 DOM
-
2026-05-27$144,900 Active
-
2013-07-18soldstatus $55,000
-
2013-07-17$58,000
ⓘ Source: listings_history table (triggers on properties + properties_extension) + one-shot
backfill from property_details.listing_events for pre-trigger history.
Tax reassessment forecast MN · Partial reset (capped growth)
- Current annual tax
- $826 · $69/mo
- Projected year-2 tax
- $1,196 · $100/mo
- Expected delta
- +$370/yr (+$31/mo · 44.8%)
ⓘ Screening estimate from a state-policy table — verify with the county assessor before closing.
Climate risk First Street
- Flood 1/10 Low 0% chance over 30 yrs
- Wildfire 5/10 Major
- Heat 1/10 Low 7 d/yr ≥93°F today · 12 d/yr by 30 yrs out
- Wind 1/10 Low
- Air quality 2/10 Low 0 unhealthy d/yr today · 1 by 30 yrs out
Nearby sold comps map
Loading sold comps map…
Walkable amenities ~0.75 mi
Loading nearby amenities…
Taxation est. · year 1
- Rental income
- $16,381
- − Mortgage interest
- −$7,837
- − Property taxes
- −$826
- − Insurance
- −$700
- − Repairs & maintenance
- −$1,310
- − Management
- −$1,310
- − Depreciation
- −$4,070
- Taxable income
- $328
- Est. tax owed @ 24.0%
- −$79
- After-tax cash flow
- $2,533/yr
For passive investors: Depreciation is non-cash, so a rental often shows a tax loss while cash-flowing — sheltering income. Rental losses are passive: they offset passive income freely, and up to $25,000/yr can offset ordinary (W-2) income if you actively participate and your MAGI is under $100k (phasing out to $0 by $150k); unused losses carry forward. On sale, claimed depreciation is recaptured at up to 25%, and gains may owe capital-gains tax (a 1031 exchange can defer both). Figures are a year-1 estimate at your 24.0% rate — not tax advice; consult a CPA.
Schools (NCES district)
- District
- Greenway Public School District
- NCES district ID
- 2709480
- Math proficiency
- 40% ▼ -10.00%
- Reading proficiency
- 47% ▼ -14.00%
- Median HH income
- $46,178
- Composite
- 37.01/100
- National rank
- #4520
- State rank
- #196 of 301 in MN
Livability — Greenway
No livability data for this city. (Only ~50 U.S. cities are tracked.)
Census & demographics
- Census place
- Marble, MN
- Population (ZIP)
- 504
Population outlook (Itasca County) Hauer SSP2
- Today (2025)
- 45,885 people
- By 2030
- 45,890 · +0.0%
- By 2040
- 45,171 · -1.6%
- By 2050
- 43,946 · -4.2%
- By 2075
- 40,950 · -10.8%
- By 2100
- 34,909 · -23.9%
Race, ethnicity, and origin ACS 2023
- Neighborhood character
- Predominantly White (89%)
- Race & ethnicity
- White 89% Two or more races 3% Asian 3% Black 2% Native American 2%
- Common ancestry
- Portuguese 7% Italian 3% Scottish 2%
- Languages at home
- 99% English-only · German/W. Germanic 1%
Political lean MEDSL · Itasca
- 2024 margin
- Strong R (+20.2) · D 39.1% · R 59.3% · Other 1.6%
- 2008→2024 swing
- -33.1pp toward R · 2008: 12.9pp · 2024: -20.2pp
- All cycles
- 2024: R+20.2 2020: R+16.8 2016: R+16.5 2012: D+9.9 2008: D+12.9
Not yet ingested
- Civics
- —
Market trends
- HPI YoY
- ▲ 0.34%
- Current HPI
- 114.6301
- Rent YoY
- —
- Metro
- —
- State GDP YoY
- ▲ 2.41%
- F500 in state
- 34
Industry mix (Fortune 500 HQ in MN)
| Industry | F500 HQs | Revenue |
|---|---|---|
| Healthcare | 2 | $407B |
|
||
| Retail | 2 | $150B |
|
||
| Consumer Goods | 2 | $32B |
|
||
| Industrial Machinery | 2 | $6B |
|
||
| Agriculture | 1 | $40B |
|
||
| Healthcare / Medical Devices | 1 | $32B |
|
||
Price history
+149.8% since first listed3 events — show timeline
- 2026-05-27 Listed $144,900 NORTHSTARMLS as Distributed by MLS Grid
- 2013-07-18 Sold (MLS) $55,000 NORTHSTARMLS as Distributed by MLS Grid
- 2013-07-17 Listed $58,000 NORTHSTARMLS as Distributed by MLS Grid
Property tax history
+6.9%/yrLatest (2026): $826 · +26.3% YoY. Source: county tax records.
Cash-flow waterfall
monthlySold comps — $/sqft
last 12 mo · ≤1 miLoading sold comps…