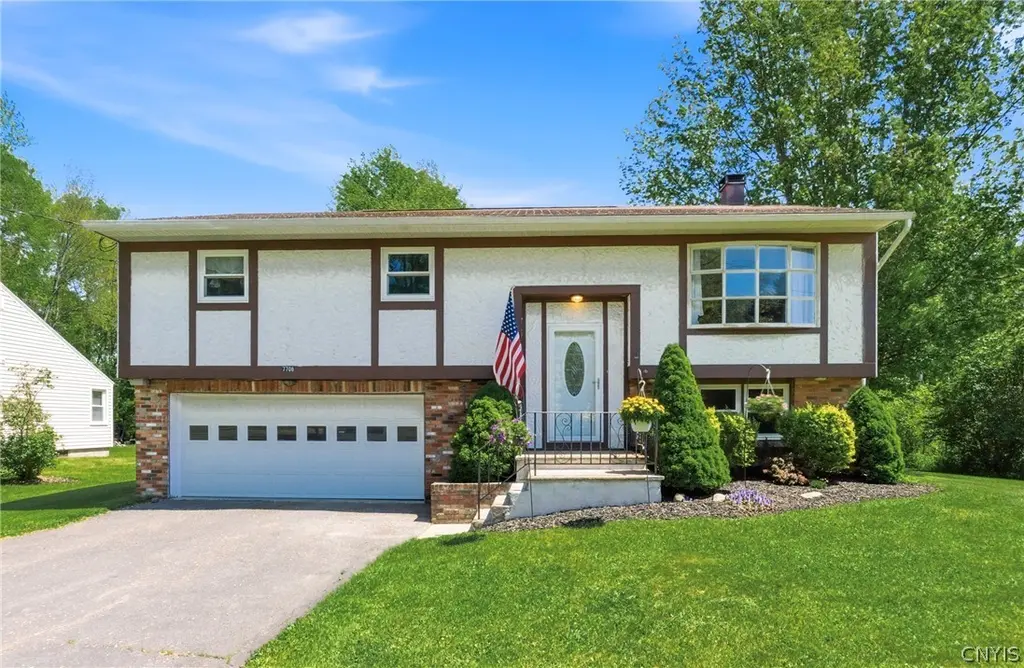
7708 Gifford Rd · Rome, NY
Flood risk 1/10 · Minimal
- FEMA flood zone
- X (unshaded)
- Chance of flooding over 30 yrs
- 0.0%
- Est. flood insurance / yr
- $473 – $860
Fire risk 4/10 · Minor
- Est. fire insurance / yr
- $691 – $1,283
Heat risk 2/10 · Minimal
- Hot days now (above 94°F)
- 7 days/yr
- Hot days in 30 yrs
- 16 days/yr
Wind risk 1/10 · Minimal
- Chance of severe wind over 30 yrs
- 0.0%
Air-quality risk 2/10 · Minimal
- Unhealthy air days now
- 0 days/yr
- Unhealthy air days in 30 yrs
- 1 days/yr
Risk factors via First Street. Map © Google.
Why this score? — see what drove the C grade
The composite is a weighted blend of 9 inputs, each scored 0–100. Each bar is that input's sub-score; the figure is the points it added to the 100-point composite (weight × sub-score).
- Cash flow +19.5/30.0
- ARV discount +14.5/15.0
- DSCR +6.2/10.0
- 1% rule +4.8/10.0
- Schools +3.5/10.0
- Livability +3.2/5.0
- Rent growth +2.5/5.0
- Condition / age +2.5/5.0
- Appreciation +0.0/10.0
$279,900
🖨 Deal sheet 📄 Offer letter ✓ Due diligence
Listing remarks MLS
READY FOR YOU TO MOVE IN & ENJOY; BEAUTIFUL UPDATED OAK KITCHEN WITH PLENTY OF SPACE; UPDATED BATHS; FRESHLY PAINTED INTERIOR; NEW FLOORING; NEW HOTWATER HEAT BOILER SYSTEM; SPACIOUS FAMILY ROOM WITH WOODSTOVE; BEAUTIFUL DEEP LOT; DECK OFF DINING ROOM; A REALLY REALLY CLEAN HOME
Key facts
- Wood stove
- Covered patio
- Garden window
Tags
Property features AI
Exterior
- Parking: Attached garage with garage door opener and electricity (2-car)
- Utilities: Electricity connected (circuit breakers); Public water connected; Sewer connected; Cable available; High-speed internet available
- Home design: 2 stories; Resale property; Walk-out finished basement
- Construction: Brick and stucco exterior; Asphalt shingle roof; Copper plumbing; Poured foundation; Built (existing)
- Exterior features: Deck; Blacktop driveway; Shed(s)/storage
Interior
- Kitchen: Electric oven; Electric range; Dishwasher; Microwave; Refrigerator; Disposal; Pantry; Solid surface counters; Eat-in kitchen
- Bedrooms: 3 main-level bedrooms
- Flooring: Hardwood; Carpet; Tile; Varied flooring
- Bathrooms: 2 full bathrooms; 1 half bathroom; 2 main-level bathrooms
- Heating & cooling: Oil heating; Baseboard heating; Hot water heating; Window cooling units
- Interior features: Ceiling fan(s); Entrance foyer; Eat-in kitchen; Separate/formal living room; Pantry; Sliding glass door(s); Solid surface counters; Primary bedroom with bath
- Laundry & utility: Washer; Dryer; Laundry located in basement; Oil water heater
Neighborhood map
What this means for you Summary
Snapshot
- This is a 3-bed/2.0-bath single-family listed at $280k.
Deal economics
- At list price, monthly cash flow is $319 ($4k/yr) — positive.
- The deal already cash-flows at list — no discount required.
- To meet the 1% rule (rent ≥ 1% of price), the offer needs to be $275k (1.8% below list).
- Recommended offer: $275k (1.8% below list) — sets the bar for 1% rule.
- Cap rate 7.7% vs local median 5.6% in Rome — top-decile yield for the area; either an underpriced asset or a hidden risk that comps aren't pricing in. Stress-test before assuming the spread holds.
Location & tenants
- Location reads 64/100 on livability (#722 in NY) — a middle-class / working-renter tenant base. Strengths: cost of living A+, housing A+; Watch: health & safety C-, schools F, amenities F.
- Rome City School District (town): math 35% / reading 46% proficiency, ranked #516 of 590 in NY (top 88%) — families likely to look elsewhere, expect single-tenant / working-renter base with shorter leases.
- Market conditions: 272 active listings in the ZIP; 1 comparable units currently listed for rent nearby; 204 units permitted in Oneida County in 2024 (68 in 5+ unit buildings).
Forward outlook
- Local home prices are declining (-3.0%/yr); year-one equity from $2k of loan paydown is wiped out by about $8k of value loss. Plan a longer hold.
- Oneida County population projected at -12% by 2050 — secular population decline; favor cash flow + early exit over multi-decade hold.
Negotiation context
- It's been on market 20 days — a 2% lower offer ($276k) is reasonable based on typical stale-listing flexibility.
- 2 sale attempts since 11y ago with the ask held roughly flat each time — persistent listings suggest the price (not the market) is what's stuck; bring a comps-based counter.
- Current owner paid $110k; list at $280k implies a 154% gain — meaningful room to come down on a strong offer.
Questions for the listing agent
- Built in 1975 — when were the roof, HVAC, electrical panel, plumbing, and water heater last replaced?
- Is there a deadline driving the sale (1031 exchange, divorce, estate, relocation)? That informs how much negotiation room exists.
- Schools are F-rated, which usually means shorter tenancies and higher turnover. Who's the typical renter profile here, and what's been the actual vacancy rate?
- What's the average days-on-market for RENTAL listings here right now (not sales)? A rising rental-DOM trend means longer vacancies and softer asking-rent achievability than the comps imply.
- What's the recent tenant-quality profile in this submarket — average credit score on applications, eviction rate, late-payment / NSF rate, and stable-employment percentage? A property-management company in the area should have these aggregated.
- How much new for-sale + rental construction is in the pipeline within 1–3 miles? Heavy new supply typically softens prices + rents 12–24 months out; constrained supply supports both.
Investment metrics
- 1% rule
- 0.98% ✗
- Cap rate
- 7.66%
- Cash-on-cash
- 4.89%
- DSCR
- 1.22
- GRM
- 8.5
CMA / ARV
- ARV (on-the-fly)
- $331,398
- Comps found
- 3
Show comp detail 3 sales within ~0.75 mi
| Address | Dist | Beds/Ba | Sqft | Sold | Price | $/sf | Match |
|---|---|---|---|---|---|---|---|
| 7732 Gifford Rd | 0.12mi | 4/2.5 (+1) | 2,014 (+4%) | 10mo | $345,000 | $171 | 73 |
| 7780 Gifford Rd | 0.34mi | 3/3.0 | 2,020 (+4%) | 10mo | $335,000 | $166 | 64 |
| 7666 Thomas Cir | 0.56mi | 3/2.5 | 1,674 (-14%) | 8mo | $379,900 | $227 | 42 |
Match score weights: distance 35% · size 25% · config 20% · recency 20%. Top-matched comps best support the ARV.
Projected returns pro-forma
-3.0% appreciation · 3.0% rent growth · sell at horizon
- IRR
- -8.7%
- Equity multiple
- 0.68×
- Total profit
- $-25,015
- Equity at exit
- $41,734
- IRR
- 0.8%
- Equity multiple
- 1.06×
- Total profit
- $4,386
- Equity at exit
- $24,201
Cash invested: $78,372 (down + closing). Projections, not guarantees.
Landlord ↔ Tenant lean methodology
- Overall (STATE)
- 15 Strongly Tenant-Friendly
- State New York
- 15 Strongly Tenant-Friendly · D+10
- County
- — inherits STATE
- City
- — inherits STATE
ZIP-level market 13440
- Home prices YoY
- -8.0%
- Active inventory
- 272
- Price-to-rent
- 8.5×
Monthly cashflow live
- Estimated rent
- $2,750 medium interval (Pro) →
- Mortgage (P&I)
- −$1,468
- Tax from tax record
- −$269 /mo · $3,223/yr
- Insurance
- −$117
- HOA
- −$0
- Vacancy / Maint / Mgmt
- −$578
- Net cashflow
- $319
Break-even live
UW: 25.0% down · 7.5% · 30yr · 1.5% tax · 5.0% vac · 8.0% maint · 8.0% mgmt
Financing live
Cash to close
- Down payment
- $69,975
- Closing costs
- $8,397
- Reserves months
- —
- Total cash needed
- —
Loan-product check · same deal, 3 products live
Conventional
25% down · 7.5% · 30yr
- Down + closing
- —
- Monthly P&I
- —
- Monthly cashflow
- —
- DSCR
- —
- Eligible?
- —
Personal DTI + credit; lowest rate.
DSCR
20% down · 8.5% · 30yr
- Down + closing
- —
- Monthly P&I
- —
- Monthly cashflow
- —
- DSCR
- —
- Eligible?
- —
No personal income docs; deal must DSCR.
Hard money
10% down · 12.0% · 12mo
- Down + closing
- —
- Monthly P&I
- —
- Monthly cashflow
- —
- DSCR
- —
- Eligible?
- —
Short-term bridge; refi at stabilization.
Rent comps 1 comps
| Address | Beds | Baths | Sqft | Rent | $/sqft | DOM | Units | Dist |
|---|---|---|---|---|---|---|---|---|
| 251 Liam Ln Unit 251 Rome, NY | 3.0 | 2.0 | 1577 | $2,750 | $1.74 | 43d | 1 | 0.88mi |
Listing history 18 events
-
2026-06-18days on market $279,900 Active 20 DOM
-
2026-06-17days on market $279,900 Active 19 DOM
-
2026-06-16days on market $279,900 Active 18 DOM
-
2026-06-15days on market $279,900 Active 17 DOM
-
2026-06-13days on market $279,900 Active 15 DOM
-
2026-06-12days on market $279,900 Active 14 DOM
-
2026-06-09days on market $279,900 Active 11 DOM
-
2026-06-08days on market $279,900 Active 10 DOM
-
2026-06-07days on market $279,900 Active 9 DOM
-
2026-06-07days on market $279,900 Active 8 DOM
-
2026-06-04days on market $279,900 Active 5 DOM
-
2026-06-02days on market $279,900 Active 4 DOM
-
2026-06-01days on market $279,900 Active 3 DOM
-
2026-05-31days on market $279,900 Active 2 DOM
-
2026-05-29$279,900 Active
-
2016-05-04soldstatus $110,000 285-char remark
Show marketing remark (285 chars)
READY FOR YOU TO MOVE IN & ENJOY; BEAUTIFUL UPDATED OAK KITCHEN WITH PLENTY OF SPACE; UPDATED BATHS; FRESHLY PAINTED INTERIOR; NEW FLOORING; NEW HOTWATER HEAT BOILER SYSTEM; SPACIOUS FAMILY ROOM WITH WOODSTOVE; BEAUTIFUL DEEP LOT; DECK OFF DINING ROOM; A REALLY REALLY CLEAN HOME
-
2016-05-03soldstatus $110,000
-
2015-06-02$114,900 285-char remark
Show marketing remark (285 chars)
READY FOR YOU TO MOVE IN & ENJOY; BEAUTIFUL UPDATED OAK KITCHEN WITH PLENTY OF SPACE; UPDATED BATHS; FRESHLY PAINTED INTERIOR; NEW FLOORING; NEW HOTWATER HEAT BOILER SYSTEM; SPACIOUS FAMILY ROOM WITH WOODSTOVE; BEAUTIFUL DEEP LOT; DECK OFF DINING ROOM; A REALLY REALLY CLEAN HOME
ⓘ Source: listings_history table (triggers on properties + properties_extension) + one-shot
backfill from property_details.listing_events for pre-trigger history.
Tax reassessment forecast NY · Partial reset (capped growth)
- Current annual tax
- $3,223 · $269/mo
- Projected year-2 tax
- $3,976 · $331/mo
- Expected delta
- +$754/yr (+$63/mo · 23.4%)
ⓘ Screening estimate from a state-policy table — verify with the county assessor before closing.
Climate risk First Street
- Flood 1/10 Low FEMA zone X (unshaded) · 0% chance over 30 yrs
- Wildfire 4/10 Moderate
- Heat 2/10 Low 7 d/yr ≥94°F today · 16 d/yr by 30 yrs out
- Wind 1/10 Low 0% chance of damaging wind over 30 yrs
- Air quality 2/10 Low 0 unhealthy d/yr today · 1 by 30 yrs out
Nearby sold comps map
Loading sold comps map…
Walkable amenities ~0.75 mi
Loading nearby amenities…
Taxation est. · year 1
- Rental income
- $33,000
- − Mortgage interest
- −$15,679
- − Property taxes
- −$3,223
- − Insurance
- −$1,400
- − Repairs & maintenance
- −$2,640
- − Management
- −$2,640
- − Depreciation
- −$8,143
- Taxable loss
- −$723
- Est. tax savings @ 24.0%
- +$174
- After-tax cash flow
- $4,008/yr
For passive investors: Depreciation is non-cash, so a rental often shows a tax loss while cash-flowing — sheltering income. Rental losses are passive: they offset passive income freely, and up to $25,000/yr can offset ordinary (W-2) income if you actively participate and your MAGI is under $100k (phasing out to $0 by $150k); unused losses carry forward. On sale, claimed depreciation is recaptured at up to 25%, and gains may owe capital-gains tax (a 1031 exchange can defer both). Figures are a year-1 estimate at your 24.0% rate — not tax advice; consult a CPA.
Schools (NCES district)
- District
- Rome City School District
- NCES district ID
- 3624900
- Math proficiency
- 35% ▼ -4.00%
- Reading proficiency
- 46% ▲ 10.00%
- Median HH income
- $46,406
- Composite
- 34.52/100
- National rank
- #5178
- State rank
- #516 of 590 in NY
Livability — Rome
- Score
- 64/100
- State rank
- #722
- US rank
- #13676
Category grades
Schools grade is shown separately in the Schools card above.
Census & demographics
- Census place
- Rome, NY
- City population
- 41,418
- Population (ZIP)
- 41,273
Population outlook (Oneida County) Hauer SSP2
- Today (2025)
- 225,223 people
- By 2030
- 220,384 · -2.1%
- By 2040
- 209,071 · -7.2%
- By 2050
- 197,920 · -12.1%
- By 2075
- 175,541 · -22.1%
- By 2100
- 148,491 · -34.1%
Race, ethnicity, and origin ACS 2023
- Neighborhood character
- Predominantly White (82%)
- Race & ethnicity
- White 82% Hispanic / Latino 7% Two or more races 6% Black 4% Asian 1%
- Hispanic origin (detail)
- Mexican 1% Puerto Rican 4%
- Common ancestry
- Romanian 9% Lithuanian 4% Slovak 1%
- Foreign-born
- 3% · Canada, China
- Languages at home
- 94% English-only · Spanish 3% Other Indo-European 1%
Political lean MEDSL · Oneida
- 2024 margin
- Strong R (+21.3) · D 39.4% · R 60.6%
- 2008→2024 swing
- -15.2pp toward R · 2008: -6.1pp · 2024: -21.3pp
- All cycles
- 2024: R+21.3 2020: R+15.5 2016: R+21.1 2012: R+5.3 2008: R+6.1
Not yet ingested
- Civics
- —
Market trends
- HPI YoY
- ▼ -29.58%
- Current HPI
- 339.3589
- Rent YoY
- —
- Metro
- —
- State GDP YoY
- ▲ 2.60%
- F500 in state
- 92
Industry mix (Fortune 500 HQ in NY)
| Industry | F500 HQs | Revenue |
|---|---|---|
| Financial Services | 10 | $950B |
|
||
| Consumer Goods | 9 | $162B |
|
||
| Insurance | 4 | $225B |
|
||
| Telecommunications | 2 | $144B |
|
||
| Pharmaceuticals | 2 | $112B |
|
||
| Media / Entertainment | 2 | $69B |
|
||
Price history
+143.6% since first listed4 events — show timeline
- 2026-05-29 Listed $279,900 CNYIS
- 2016-05-04 Sold (MLS) $110,000 CNYIS
- 2016-05-03 Sold (Public Records) $110,000 Public Records
- 2015-06-02 Listed $114,900 CNYIS
Property tax history
+1.7%/yrLatest (2025): $3,223 · +0.3% YoY. Source: county tax records.
Cash-flow waterfall
monthlySold comps — $/sqft
last 12 mo · ≤1 miLoading sold comps…