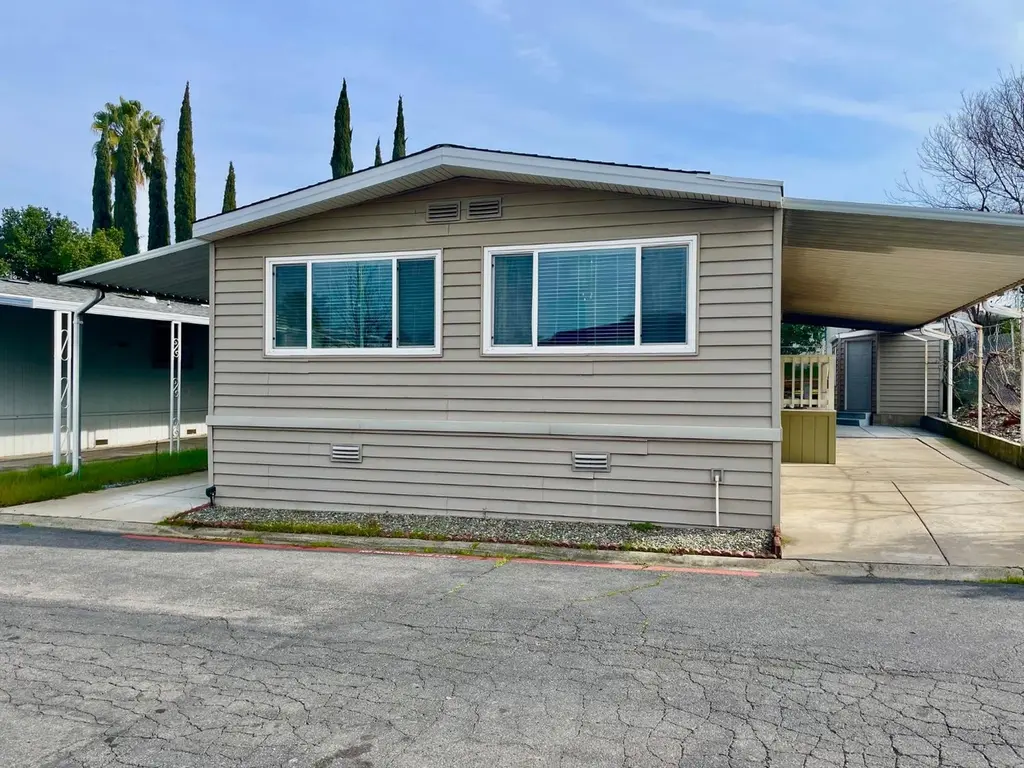
6206 Plymouth Rock Ln #110 · Citrus Heights, CA
Flood risk 5/10 · Moderate
- FEMA flood zone
- X (unshaded)
- Chance of flooding over 30 yrs
- 0.32%
- Est. flood insurance / yr
- $507 – $1,088
Fire risk 1/10 · Minimal
- Est. fire insurance / yr
- $659 – $1,223
Heat risk 7/10 · Major
- Hot days now (above 102°F)
- 7 days/yr
- Hot days in 30 yrs
- 16 days/yr
Wind risk 1/10 · Minimal
- Chance of severe wind over 30 yrs
- —
Air-quality risk 10/10 · Severe
- Unhealthy air days now
- 34 days/yr
- Unhealthy air days in 30 yrs
- 36 days/yr
Risk factors via First Street. Map © Google.
Why this score? — see what drove the C grade
The composite is a weighted blend of 9 inputs, each scored 0–100. Each bar is that input's sub-score; the figure is the points it added to the 100-point composite (weight × sub-score).
- Cash flow +24.1/30.0
- DSCR +7.8/10.0
- 1% rule +6.3/10.0
- ARV discount +4.8/15.0
- Schools +4.4/10.0
- Rent growth +3.0/5.0
- Livability +3.0/5.0
- Condition / age +2.5/5.0
- Appreciation +0.0/10.0
$169,000
🖨 Deal sheet (PDF) 📄 Offer letter ✓ Due diligence
Listing remarks
Welcome to Beautiful Remodeled 3-bed, 2-bath double wide Manufactured home in the quiet and welcoming Creekside Estates community in Citrus Heights. This home features a bright and spacious layout, a modern kitchen, and a private outdoor area perfect for relaxation. All appliances (refrigerator, washer/dryer) are including. Enjoy community amenities like a clubhouse, a sparkling swimming pool, and well-maintained green spaces. Creekside Estates offers a peaceful lifestyle with easy access to nearby shopping, dining, and entertainment options. Situated in a prime location, the community is close to Rusch Botanical Gardens, a beautiful 2-acre park perfect for nature lovers. Creekside Estates
Key facts
- Remodeled
- Clubhouse
- Community amenities
Tags
Neighborhood map
What this means for you Summary
Snapshot
- This is a 3-bed/2.0-bath manufactured listed at $169k.
Deal economics
- At list price, monthly cash flow is $335 ($4k/yr) — positive.
- The deal already cash-flows at list — no discount required.
- Meets the 1% rule at list price ($2k rent vs $169k).
- Recommended offer: $154k (9.0% below list) — sets the bar for market timing.
- Cap rate 8.7% vs local median 3.4% in Citrus Heights — top-decile yield for the area; either an underpriced asset or a hidden risk that comps aren't pricing in. Stress-test before assuming the spread holds.
Location & tenants
- Location reads 60/100 on livability (#614 in CA) — a middle-class / working-renter tenant base. Strengths: housing A+; Watch: crime D-, amenities F, commute F.
- San Juan Unified (suburban): math 40% / reading 62% proficiency, ranked #138 of 517 in CA (top 27%) — acceptable for families but not a draw, mixed tenant base, ~2y average lease.
- Zoned schools: Orangevale Open K-8 (572 students, 22% FRL); Sylvan Middle (647 students, 71% FRL); El Camino Fundamental High (math 34% / reading 62%, grade D, #378 of 1,170 statewide, top 32%, 1,246 students, 50% FRL) — zoned schools at 48% FRL track the district average.
- Market conditions: Rents rising (+1.9%/yr); 219 active listings in the ZIP; 25 comparable units currently listed for rent nearby; rentals at typical pace (median 26d on market — plan ~3-4 weeks tenant-placement turnaround); solid renter incomes; 6,825 units permitted in Sacramento County in 2024 (1,752 in 5+ unit buildings).
Forward outlook
- Local home prices are declining (-3.0%/yr); year-one equity from $1k of loan paydown is wiped out by about $5k of value loss. Plan a longer hold.
- Sacramento County population projected at +17% by 2050 — long-run rental-demand tailwind backs the buy-and-hold thesis.
Negotiation context
- It's been on market 113 days — a 9% lower offer ($154k) is reasonable based on typical stale-listing flexibility.
Risks & watch-outs
- Climate carrying-cost: moderate flood risk; extreme-heat days projected 7→16/yr by 2055 (HVAC capex compounding) — expect insurance premiums to compound above CPI over the hold.
Questions for the listing agent
- It's been on market 113 days. Have you received any prior offers? Is the seller open to a 9% concession, seller financing, or rate buy-down credit?
- Built in 1976 — when were the roof, HVAC, electrical panel, plumbing, and water heater last replaced?
- Why hasn't it sold? Are there any deal-killer items the seller is aware of (foundation, flood, title, zoning, code violations)?
- Is there a deadline driving the sale (1031 exchange, divorce, estate, relocation)? That informs how much negotiation room exists.
- Schools are D-rated, which usually means shorter tenancies and higher turnover. Who's the typical renter profile here, and what's been the actual vacancy rate?
- Crime grade is D in this area — have there been break-ins, vandalism, or insurance claims at this property in the last 3 years? What carrier currently insures it and at what premium?
- What's the average days-on-market for RENTAL listings here right now (not sales)? A rising rental-DOM trend means longer vacancies and softer asking-rent achievability than the comps imply.
- What's the recent tenant-quality profile in this submarket — average credit score on applications, eviction rate, late-payment / NSF rate, and stable-employment percentage? A property-management company in the area should have these aggregated.
- How much new for-sale + rental construction is in the pipeline within 1–3 miles? Heavy new supply typically softens prices + rents 12–24 months out; constrained supply supports both.
Investment metrics
- 1% rule
- 1.13% ✓
- Cap rate
- 8.67%
- Cash-on-cash
- 8.49%
- DSCR
- 1.38
- GRM
- 7.4
CMA / ARV
- ARV (median comp)
- $159,500
- List price
- $169,000
- Delta
- 5.96%
- Verdict
- FAIR
- Comps
- 20 within 1.0 mi
Show comp detail 12 sales within ~0.75 mi
| Address | Dist | Beds/Ba | Sqft | Sold | Price | $/sf | Match |
|---|---|---|---|---|---|---|---|
| 6206 Plymouth Rock Ln #110 | 0.00mi | 3/2.0 | 1,536 (0%) | 1mo | $159,000 | $104 | 99 |
| 6203 Freedom Ln | 0.08mi | 3/2.0 | 1,680 (+9%) | 3mo | $160,000 | $95 | 78 |
| 6637 Grosse Point Ct | 0.61mi | 3/2.0 | 1,536 (0%) | 1mo | $95,000 | $62 | 71 |
| 6187 Oak Lks | 0.51mi | 2/2.0 (-1) | 1,536 (0%) | 12mo | $225,000 | $146 | 61 |
| 6641 Grosse Point Ct | 0.62mi | 2/2.0 (-1) | 1,464 (-5%) | 3mo | $175,000 | $120 | 56 |
| 6116 Mame Ct | 0.61mi | 2/2.0 (-1) | 1,440 (-6%) | 3mo | $179,000 | $124 | 54 |
| 6624 Grosse Point Ct | 0.59mi | 2/2.0 (-1) | 1,608 (+5%) | 11mo | $229,000 | $142 | 51 |
| 6105 Meiggs Ct #1015 | 0.63mi | 2/2.0 (-1) | 1,645 (+7%) | 4mo | $160,000 | $97 | 50 |
| 6222 Redcliff Dr #47 | 0.35mi | 2/2.0 (-1) | 1,344 (-12%) | 9mo | $54,900 | $41 | 50 |
| 6116 Mame Ct #905 | 0.61mi | 2/2.0 (-1) | 1,440 (-6%) | 8mo | $100,000 | $69 | 49 |
| 6717 Kate Ln | 0.68mi | 2/2.0 (-1) | 1,440 (-6%) | 11mo | $240,000 | $167 | 43 |
| 6132 Mame Ct | 0.60mi | 2/2.0 (-1) | 1,344 (-12%) | 10mo | $165,000 | $123 | 38 |
Match score weights: distance 35% · size 25% · config 20% · recency 20%. Top-matched comps best support the ARV.
Projected returns pro-forma
-3.0% appreciation · 1.9% rent growth · sell at horizon
- IRR
- -4.6%
- Equity multiple
- 0.83×
- Total profit
- $-8,115
- Equity at exit
- $25,198
- IRR
- 3.7%
- Equity multiple
- 1.26×
- Total profit
- $12,151
- Equity at exit
- $14,612
Cash invested: $47,320 (down + closing). Projections, not guarantees.
Landlord ↔ Tenant lean methodology
- Overall (STATE)
- 18 Strongly Tenant-Friendly
- State California
- 18 Strongly Tenant-Friendly · D+13
- County
- — inherits STATE
- City
- — inherits STATE
ZIP-level market 95621
- Rents YoY
- 1.9%
- Active inventory
- 219
- Price-to-rent
- 7.4×
Monthly cashflow live
- Estimated rent
- $1,902 high interval (Pro) →
- Mortgage (P&I)
- −$886
- Tax est. 1.5%
- −$211 /mo · $2,535/yr
- Insurance
- −$70
- HOA
- −$0
- Lot rent leased land?
- −$0
- Vacancy / Maint / Mgmt
- −$399
- Net cashflow
- $335
Break-even live
Sensitivity live
| Price | -10% $452 | -5% $393 | +0% $335 | +5% $276 | +10% $218 |
|---|---|---|---|---|---|
| Rent | -10% $185 | -5% $260 | +0% $335 | +5% $410 | +10% $485 |
| Rate | -1.0pp $420 | -0.5pp $378 | base $335 | +0.5pp $291 | +1.0pp $246 |
UW: 25.0% down · 7.5% · 30yr · 1.5% tax · 5.0% vac · 8.0% maint · 8.0% mgmt
Financing live
Cash to close
- Down payment
- $42,250
- Closing costs
- $5,070
- Reserves months
- —
- Total cash needed
- —
Loan-product check · same deal, 3 products live
Conventional
25% down · 7.5% · 30yr
- Down + closing
- —
- Monthly P&I
- —
- Monthly cashflow
- —
- DSCR
- —
- Eligible?
- —
Personal DTI + credit; lowest rate.
DSCR
20% down · 8.5% · 30yr
- Down + closing
- —
- Monthly P&I
- —
- Monthly cashflow
- —
- DSCR
- —
- Eligible?
- —
No personal income docs; deal must DSCR.
Hard money
10% down · 12.0% · 12mo
- Down + closing
- —
- Monthly P&I
- —
- Monthly cashflow
- —
- DSCR
- —
- Eligible?
- —
Short-term bridge; refi at stabilization.
Rent comps 25 comps
| Address | Beds | Baths | Sqft | Rent | $/sqft | DOM | Units | Dist |
|---|---|---|---|---|---|---|---|---|
| 6104 Rockport Ln Citrus Heights, CA | 3.0 | 2.5 | 1150 | $2,295 | $2.00 | 24d | 1 | 0.31mi |
| 6219 Oak Valley Ln Citrus Heights, CA | 3.0 | 3.0 | 1304 | $2,295 | $1.76 | 20d | 1 | 0.33mi |
| 6219 Oak Valley Ln Citrus Heights, CA | 3.0 | 2.5 | 1304 | $2,295 | $1.76 | 46d | 1 | 0.33mi |
| 6203 Ackland Ct Citrus Heights, CA | 3.0 | 1.5 | 1322 | $2,500 | $1.89 | 26d | 1 | 0.39mi |
| 6333 Aslin Way Carmichael, CA | 4.0 | 2.0 | 1257 | $2,750 | $2.19 | 46d | 1 | 0.74mi |
| 6000 Coyle Ave Carmichael, CA | 4.0 | 2.0 | 1120 | $2,295 | $2.05 | 26d | 1 | 0.77mi |
| 6025 Dewey Dr Citrus Heights, CA | 3.0 | 2.0 | 1847 | $2,500 | $1.35 | 26d | 1 | 0.80mi |
| 6558 Meadowcreek Way Citrus Heights, CA | 3.0 | 2.0 | 1304 | $2,500 | $1.92 | 46d | 1 | 0.81mi |
| 6687 Greenback Ln Citrus Heights, CA | 3.0 | 2.0 | 1323 | $2,495 | $1.89 | 20d | 1 | 0.88mi |
| 5233 Calistoga Way Sacramento, CA | 3.0 | 2.0 | 1200 | $2,495 | $2.08 | 0d | 1 | 0.94mi |
| 6034 Centurion Cir Citrus Heights, CA | 4.0 | 2.0 | 1726 | $3,100 | $1.80 | 46d | 1 | 0.95mi |
| 6319 Misty Wood Way Citrus Heights, CA | 3.0 | 2.0 | 1454 | $2,500 | $1.72 | 46d | 1 | 1.08mi |
| 5308 Winfield Way #2 Sacramento, CA | 3.0 | 1.5 | 1105 | $2,100 | $1.90 | 46d | 1 | 1.14mi |
| 5300 Winfield Way #2 Sacramento, CA | 3.0 | 1.5 | 1105 | $2,100 | $1.90 | 26d | 1 | 1.16mi |
| 6805 Castillo Ct Citrus Heights, CA | 4.0 | 3.0 | 1948 | $2,795 | $1.43 | 26d | 1 | 1.17mi |
| 6913 Gold Run Ave Sacramento, CA | 4.0 | 2.0 | 1474 | $2,800 | $1.90 | 22d | 1 | 1.23mi |
| 6940 Trailride Way Citrus Heights, CA | 3.0 | 2.0 | 1527 | $2,695 | $1.76 | 46d | 1 | 1.23mi |
| 6948 Trailride Way Citrus Heights, CA | 4.0 | 3.0 | 1980 | $2,850 | $1.44 | 20d | 1 | 1.24mi |
| 5100 Atlanta Way Sacramento, CA | 3.0 | 2.0 | 1400 | $2,295 | $1.64 | 0d | 1 | 1.26mi |
| 6948 Sunburst Way Citrus Heights, CA | 4.0 | 2.5 | 1673 | $3,000 | $1.79 | 46d | 1 | 1.26mi |
| 6600 Hillsdale Blvd Sacramento, CA | 3.0 | 3.0 | 1686 | $2,600 | $1.54 | 18d | 1 | 1.32mi |
| 7024 San Altos Cir Citrus Heights, CA | 2.0 | 2.0 | 1120 | $2,800 | $2.50 | 46d | 1 | 1.32mi |
| 6200 Osullivan Ln Sacramento, CA | 2.0 | 2.0 | 1316 | $1,775 | $1.35 | 10d | 1 | 1.36mi |
| 6820 Lincoln Oaks Dr Fair Oaks, CA | 3.0 | 2.0 | 1544 | $3,150 | $2.04 | 14d | 1 | 1.39mi |
| 7120 Van Maren Ln Citrus Heights, CA | 3.0 | 2.0 | 1292 | $2,495 | $1.93 | 20d | 1 | 1.45mi |
Climate risk First Street
- Flood 5/10 Major FEMA zone X (unshaded) · 32% chance over 30 yrs
- Wildfire 1/10 Low
- Heat 7/10 Severe 7 d/yr ≥102°F today · 16 d/yr by 30 yrs out
- Wind 1/10 Low
- Air quality 10/10 Extreme 34 unhealthy d/yr today · 36 by 30 yrs out
Nearby sold comps map
Loading sold comps map…
Walkable amenities ~0.75 mi
Loading nearby amenities…
Taxation est. · year 1
- Rental income
- $22,826
- − Mortgage interest
- −$9,467
- − Property taxes
- −$2,535
- − Insurance
- −$845
- − Repairs & maintenance
- −$1,826
- − Management
- −$1,826
- − Depreciation
- −$4,916
- Taxable income
- $1,411
- Est. tax owed @ 24.0%
- −$339
- After-tax cash flow
- $3,679/yr
For passive investors: Depreciation is non-cash, so a rental often shows a tax loss while cash-flowing — sheltering income. Rental losses are passive: they offset passive income freely, and up to $25,000/yr can offset ordinary (W-2) income if you actively participate and your MAGI is under $100k (phasing out to $0 by $150k); unused losses carry forward. On sale, claimed depreciation is recaptured at up to 25%, and gains may owe capital-gains tax (a 1031 exchange can defer both). Figures are a year-1 estimate at your 24.0% rate — not tax advice; consult a CPA.
Schools (NCES district)
- District
- San Juan Unified
- NCES district ID
- 0634620
- Math proficiency
- 40% ▲ 3.00%
- Reading proficiency
- 62% ▲ 16.00%
- Median HH income
- $55,655
- Composite
- 44.07/100
- National rank
- #2878
- State rank
- #138 of 517 in CA
Livability — Citrus Heights
- Score
- 60/100
- State rank
- #614
- US rank
- #19580
Category grades
Schools grade is shown separately in the Schools card above.
Census & demographics
- Census place
- Citrus Heights, CA
- County
- Sacramento County · 1,539,646 people
- City population
- 89,370
- Metro
- Sacramento-Roseville-Folsom, CA
- Population (ZIP)
- 42,442
- Household income
- $80,901
- Rent vs Own
- Severe rent burden
- 1854.0
Population outlook (Sacramento County) Hauer SSP2
- Today (2025)
- 1,660,763 people
- By 2030
- 1,732,990 · +4.3%
- By 2040
- 1,855,755 · +11.7%
- By 2050
- 1,941,335 · +16.9%
- By 2075
- 2,046,162 · +23.2%
- By 2100
- 1,961,444 · +18.1%
Race, ethnicity, and origin ACS 2023
- Neighborhood character
- Predominantly White (66%)
- Race & ethnicity
- White 66% Hispanic / Latino 19% Two or more races 11% Asian 6% Black 2%
- Hispanic origin (detail)
- Mexican 16%
- Common ancestry
- Subsaharan African 3% Lithuanian 3% Scotch-Irish 2%
- Foreign-born
- 15% · Canada, Vietnam
- Languages at home
- 78% English-only · Spanish 10% Russian/Polish/Slavic 6% Other Indo-European 3%
Political lean MEDSL · Sacramento
- 2024 margin
- D (+19.7) · D 58.1% · R 38.4% · Other 3.5%
- 2008→2024 swing
- +0.7pp no change · 2008: 19.0pp · 2024: 19.7pp
- All cycles
- 2024: D+19.7 2020: D+25.3 2016: D+23.7 2012: D+16.3 2008: D+19.0
Not yet ingested
- Civics
- —
Market trends
- HPI YoY
- ▼ -408.14%
- Current HPI
- 351.9333
- Rent YoY
- ▲ 1.90%
- Metro
- Sacramento-Roseville-Folsom, CA
- State GDP YoY
- ▲ 3.21%
- F500 in state
- 116
Industry mix (Fortune 500 HQ in CA)
| Industry | F500 HQs | Revenue |
|---|---|---|
| Technology | 27 | $1,492B |
|
||
| Financial Services | 3 | $174B |
|
||
| Retail | 3 | $44B |
|
||
| Insurance | 3 | $26B |
|
||
| Media / Entertainment | 2 | $115B |
|
||
| Pharmaceuticals / Biotech | 2 | $62B |
|
||
Property tax history
+1.0%/yrLatest (2025): $227 · -2.6% YoY. Source: county tax records.
Cash-flow waterfall
monthlySold comps — $/sqft
last 12 mo · ≤1 miLoading sold comps…