 6-Plex
433 Dekalb Ave · New York, NY
Flood risk No data
- FEMA flood zone
- —
- Chance of flooding over 30 yrs
- —
- Est. flood insurance / yr
- —
Fire risk No data
- Est. fire insurance / yr
- —
Heat risk No data
- Hot days now (above threshold)
- —
- Hot days in 30 yrs
- —
Wind risk No data
- Chance of severe wind over 30 yrs
- —
Air-quality risk No data
- Unhealthy air days now
- —
- Unhealthy air days in 30 yrs
- —
Risk factors via First Street. Map © Google.
Why this score? — see what drove the D+ grade
The composite is a weighted blend of 9 inputs, each scored 0–100. Each bar is that input's sub-score; the figure is the points it added to the 100-point composite (weight × sub-score).
- Appreciation +10.0/10.0
- Cash flow +9.8/30.0
- ARV discount +7.5/15.0
- Schools +5.0/10.0
- Rent growth +4.7/5.0
- Livability +3.8/5.0
- DSCR +2.8/10.0
- Condition / age +2.5/5.0
- 1% rule +1.8/10.0
$5,700,000
🖨 Deal sheet (PDF) 📄 Offer letter ✓ Due diligence
Multi-family units
County records classify this as Multi-Family (5+ Unit). Listing-text estimate: 6 units. confirmed
5+ unit building — per-unit beds/baths from public records are typically unavailable; the breakdown below (if shown) is an estimate from the listing text.
Listing remarks
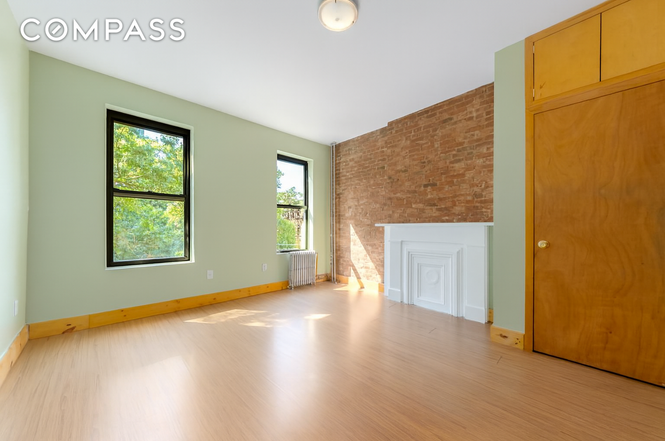
Welcome to 433 DeKalb Avenue, a boutique four-story, eight-unit free-market rental building ideally located on the border of Clinton Hill and Bedford-Stuyvesant. Perfect for a 1031 exchange or long-term hold, this asset offers investors stable income with upside potential. The building is fully occupied, generating consistent cash flow from day one, with additional room for rent growth as leases turn over. There is an assumable Freddie Mac loan in place at a 4% interest rate (17 years remaining) for $3.5M- sweetening the investment opportunity. There is also an additional 3780 sqft of FAR. Units feature efficient layouts, hardwood floors, modern kitchens and baths, and oversized windows&mda
Key facts
- 3780 sqft of far
- Efficient layouts
- Modern kitchens
Tags
Property features AI
Finance
- Other: Multi-unit property with 8 total units and 24 total rooms
- HOA & community: HOA/association fees billed monthly
Exterior
- Home design: 4-story building; Entry level on level 1
- Construction: Lot dimensions approximately 27 x 100
- Exterior features: Private outdoor space (over 60 sqft)
Interior
- Flooring: Hardwood
- Bathrooms: 6 full bathrooms
- Interior features: Unfurnished; Hardwood flooring
- Laundry & utility: Laundry details available in remarks
Neighborhood map
What this means for you Summary
Snapshot
- This is a 6 × 3-bed/1.0-bath units multifamily listed at $5.70M.
Deal economics
- At list price, monthly cash flow is $-4k ($-44k/yr) — negative. Per door: $-616/mo.
- To cash-flow at today's rent, offer at most $5.05M (11.5% below list).
- To meet the 1% rule (rent ≥ 1% of price), the offer needs to be $3.88M (31.9% below list).
- Recommended offer: $3.88M (31.9% below list) — sets the bar for 1% rule.
- Cap rate 5.5% vs local median 2.6% in New York — top-decile yield for the area; either an underpriced asset or a hidden risk that comps aren't pricing in. Stress-test before assuming the spread holds.
Location & tenants
- Location reads 75/100 on livability (#268 in NY, #4,188 nationally) — a middle-class / working-renter tenant base. Strengths: amenities A+, commute A+, health & safety A; Watch: crime F, cost of living F.
- Zoned schools: Elm Tree Elementary School (math 27% / reading 52%, grade F, #1,444 of 2,108 statewide, top 71%, 806 students, 94% FRL); Is 318 Eugenio Maria De Hostos (math 54% / reading 74%, grade A-, #121 of 729 statewide, top 17%, 1,069 students, 64% FRL); Midwood High School (math 94% / reading 96%, grade A+, #83 of 1,100 statewide, top 8%, 4,062 students, 73% FRL).
- Market conditions: Rents rising fast (+8.6%/yr); 89 active listings in the ZIP; solid renter incomes; 10,063 units permitted in Kings County in 2024 (9,789 in 5+ unit buildings).
- At $38,803/mo this rent would consume 496% of the median local household income ($94k/yr) (locally 3544% of renters already pay >50% of income on rent) — very limited rent-growth headroom before tenants either downsize or default.
Forward outlook
- In year one you build about $609k of equity ($39k loan paydown + $570k appreciation (10.0% local appreciation)).
- Kings County population projected at +13% by 2050 — modest demand growth; plan on rents tracking national, not racing it.
- By year 2, paydown + projected appreciation supports a ~$980k cash-out refi (75% LTV) — recoverable capital for the next deal without selling this one.
Negotiation context
- It's been on market 250 days — a 12% lower offer ($5.02M) is reasonable based on typical stale-listing flexibility.
- 5 sale attempts since 3y ago; this cycle's ask has dropped $300k (5%) from the opening price — seller is motivated, your offer sets the floor, not the list.
- Current owner paid $1.45M; list at $5.70M implies a 293% gain — meaningful room to come down on a strong offer.
Risks & watch-outs
- Watch-outs: built in 1905 — expect roof / HVAC / electrical / plumbing capex.
Questions for the listing agent
- What do current leases actually rent for vs. the listed asking? Can we see a recent rent roll and the last 12 months of T-12 income?
- It's been on market 250 days. Have you received any prior offers? Is the seller open to a 32% concession, seller financing, or rate buy-down credit?
- Can we see the unit-by-unit rent roll, current vacancy, and any below-market leases? What's the average tenancy length?
- What capital expenditures (roof, boiler, parking lot, exteriors) have been made in the last 5 years, and what's planned in the next 2?
- Built in 1905 — when were the roof, HVAC, electrical panel, plumbing, and water heater last replaced?
- Why hasn't it sold? Are there any deal-killer items the seller is aware of (foundation, flood, title, zoning, code violations)?
- Is there a deadline driving the sale (1031 exchange, divorce, estate, relocation)? That informs how much negotiation room exists.
- Schools are B-rated — typically a magnet for longer-tenancy family renters. What's the average tenant stay here, and is there a school-zone premium baked into asking?
- Crime grade is F in this area — have there been break-ins, vandalism, or insurance claims at this property in the last 3 years? What carrier currently insures it and at what premium?
- The area grade is low — what's the realistic commute time and amenity access for the typical tenant pool here? Any planned neighborhood developments (good or bad) we should know about?
- What's the average days-on-market for RENTAL listings here right now (not sales)? A rising rental-DOM trend means longer vacancies and softer asking-rent achievability than the comps imply.
- What's the recent tenant-quality profile in this submarket — average credit score on applications, eviction rate, late-payment / NSF rate, and stable-employment percentage? A property-management company in the area should have these aggregated.
- How much new apartment / multifamily construction is in the pipeline within 1–3 miles? Heavy new supply (>2% of stock underway) typically softens rents 12–24 months out; light construction supports rent growth.
Investment metrics
- 1% rule
- 0.68% ✗
- Cap rate
- 5.51%
- Cash-on-cash
- -2.78%
- DSCR
- 0.88
- GRM
- 12.2
CMA / ARV
No comps found within radius.
Projected returns pro-forma
10.0% appreciation · 8.0% rent growth · sell at horizon
- IRR
- 23.6%
- Equity multiple
- 2.92×
- Total profit
- $3,071,511
- Equity at exit
- $5,135,012
- IRR
- 22.1%
- Equity multiple
- 7.10×
- Total profit
- $9,733,244
- Equity at exit
- $11,073,846
Cash invested: $1,596,000 (down + closing). Projections, not guarantees.
Landlord ↔ Tenant lean methodology
- Overall (CITY)
- 0 Strongly Tenant-Friendly
- State New York
- 15 Strongly Tenant-Friendly · D+10
- County
- — inherits STATE
- City New York
- 0 Strongly Tenant-Friendly · D+34
ZIP-level market 11205
- Home prices YoY
- 2.1%
- Rents YoY
- 8.6%
- Active inventory
- 89
- Price-to-rent
- 73.4×
Monthly cashflow live
- Estimated rent
- $38,803 high interval (Pro) →
- Mortgage (P&I)
- −$29,891
- Tax from tax record
- −$2,084 /mo · $25,010/yr
- Insurance
- −$2,375
- HOA
- −$0
- Vacancy / Maint / Mgmt
- −$8,149
- Net cashflow
- $-3,696
Break-even live
Sensitivity live
| Price | -10% $-470 | -5% $-2,083 | +0% $-3,696 | +5% $-5,310 | +10% $-6,923 |
|---|---|---|---|---|---|
| Rent | -10% $-6,762 | -5% $-5,229 | +0% $-3,696 | +5% $-2,163 | +10% $-631 |
| Rate | -1.0pp $-826 | -0.5pp $-2,246 | base $-3,696 | +0.5pp $-5,173 | +1.0pp $-6,676 |
6-unit breakdown (identical units grouped — click to expand)
| Units | Beds | Baths | Est. rent |
|---|---|---|---|
| 6× units | 3 | 1 | $38,802 |
| #1 | 3 | 1 | $6,467 |
| #2 | 3 | 1 | $6,467 |
| #3 | 3 | 1 | $6,467 |
| #4 | 3 | 1 | $6,467 |
| #5 | 3 | 1 | $6,467 |
| #6 | 3 | 1 | $6,467 |
| Total (6 units) | $38,803 | ||
UW: 25.0% down · 7.5% · 30yr · 1.5% tax · 5.0% vac · 8.0% maint · 8.0% mgmt
Financing live
Cash to close
- Down payment
- $1,425,000
- Closing costs
- $171,000
- Reserves months
- —
- Total cash needed
- —
Loan-product check · same deal, 3 products live
Conventional
25% down · 7.5% · 30yr
- Down + closing
- —
- Monthly P&I
- —
- Monthly cashflow
- —
- DSCR
- —
- Eligible?
- —
Personal DTI + credit; lowest rate.
DSCR
20% down · 8.5% · 30yr
- Down + closing
- —
- Monthly P&I
- —
- Monthly cashflow
- —
- DSCR
- —
- Eligible?
- —
No personal income docs; deal must DSCR.
Hard money
10% down · 12.0% · 12mo
- Down + closing
- —
- Monthly P&I
- —
- Monthly cashflow
- —
- DSCR
- —
- Eligible?
- —
Short-term bridge; refi at stabilization.
Listing history 21 events
-
2026-06-21days on market $5,700,000 Active 250 DOM
-
2026-06-18days on market $5,700,000 Active 247 DOM
-
2026-06-17days on market $5,700,000 Active 246 DOM
-
2026-06-15days on market $5,700,000 Active 244 DOM
-
2026-06-13days on market $5,700,000 Active 242 DOM
-
2026-06-10days on market $5,700,000 Active 238 DOM
-
2026-06-08days on market $5,700,000 Active 237 DOM
-
2026-06-03days on market $5,700,000 Active 232 DOM
-
2026-06-01days on market $5,700,000 Active 230 DOM
-
2026-05-31days on market $5,700,000 Active 229 DOM
-
2026-01-07price $5,700,000
-
2025-10-14$6,000,000 Active
-
2024-11-16historical $3,500
-
2024-11-08$3,500
-
2024-11-08historical $3,799
-
2024-08-04$4,000
-
2023-10-16historical $3,600
-
2023-09-22$3,600
-
2023-09-18historical $3,600
-
2023-09-15$3,600
-
2008-06-02soldstatus $1,450,000
ⓘ Source: listings_history table (triggers on properties + properties_extension) + one-shot
backfill from property_details.listing_events for pre-trigger history.
Tax reassessment forecast NY · Partial reset (capped growth)
- Current annual tax
- $25,010 · $2,084/mo
- Projected year-2 tax
- $60,670 · $5,056/mo
- Expected delta
- +$35,660/yr (+$2,972/mo · 142.6%)
ⓘ Screening estimate from a state-policy table — verify with the county assessor before closing.
Nearby sold comps map
Loading sold comps map…
Walkable amenities ~0.75 mi
Loading nearby amenities…
Taxation est. · year 1
- Rental income
- $465,636
- − Mortgage interest
- −$319,289
- − Property taxes
- −$25,010
- − Insurance
- −$28,500
- − Repairs & maintenance
- −$37,251
- − Management
- −$37,251
- − Depreciation
- −$165,818
- Taxable loss
- −$147,482
- Est. tax savings @ 24.0%
- +$35,396
- After-tax cash flow
- $-8,959/yr
For passive investors: Depreciation is non-cash, so a rental often shows a tax loss while cash-flowing — sheltering income. Rental losses are passive: they offset passive income freely, and up to $25,000/yr can offset ordinary (W-2) income if you actively participate and your MAGI is under $100k (phasing out to $0 by $150k); unused losses carry forward. On sale, claimed depreciation is recaptured at up to 25%, and gains may owe capital-gains tax (a 1031 exchange can defer both). Figures are a year-1 estimate at your 24.0% rate — not tax advice; consult a CPA.
Schools (NCES district)
No district data.
Livability — New York
- Score
- 75/100
- State rank
- #268
- US rank
- #4188
Category grades
Schools grade is shown separately in the Schools card above.
Census & demographics
- Census place
- New York, NY
- County
- Kings County · 2,614,986 people
- City population
- 7,731,280
- Metro
- New York-Newark-Jersey City, NY-NJ-PA
- Population (ZIP)
- 51,676
- Household income
- $93,887
- Rent vs Own
- Severe rent burden
- 3544.0
Population outlook (Kings County) Hauer SSP2
- Today (2025)
- 2,847,441 people
- By 2030
- 2,937,006 · +3.1%
- By 2040
- 3,095,491 · +8.7%
- By 2050
- 3,228,968 · +13.4%
- By 2075
- 3,321,723 · +16.7%
- By 2100
- 3,111,387 · +9.3%
Race, ethnicity, and origin ACS 2023
- Neighborhood character
- Diverse neighborhood (Simpson 0.66)
- Race & ethnicity
- White 52% Black 20% Hispanic / Latino 15% Two or more races 10% Asian 7%
- Hispanic origin (detail)
- Mexican 3% Puerto Rican 5% Dominican 3%
- Common ancestry
- Italian 4% Scandinavian 3% Romanian 2%
- Foreign-born
- 16% · Canada, China, South Korea
- Languages at home
- 57% English-only · German/W. Germanic 21% Spanish 11% Chinese 4%
Political lean MEDSL · Kings
- 2024 margin
- Solid D (+44.0) · D 72.0% · R 28.0%
- 2008→2024 swing
- -15.5pp toward R · 2008: 59.4pp · 2024: 44.0pp
- All cycles
- 2024: D+44.0 2020: D+54.8 2016: D+61.8 2012: D+63.9 2008: D+59.4
Not yet ingested
- Civics
- —
Market trends
- HPI YoY
- ▲ 12.40%
- Current HPI
- 605.3512
- Rent YoY
- ▲ 8.61%
- Metro
- New York-Newark-Jersey City, NY-NJ-PA
- State GDP YoY
- ▲ 2.60%
- F500 in state
- 92
Industry mix (Fortune 500 HQ in NY)
| Industry | F500 HQs | Revenue |
|---|---|---|
| Financial Services | 10 | $950B |
|
||
| Consumer Goods | 9 | $162B |
|
||
| Insurance | 4 | $225B |
|
||
| Telecommunications | 2 | $144B |
|
||
| Pharmaceuticals | 2 | $112B |
|
||
| Media / Entertainment | 2 | $69B |
|
||
Price history
+293.1% since first listed11 events — show timeline
- 2026-01-07 Price Changed $5,700,000 RLS at REBNY
- 2025-10-14 Listed $6,000,000 RLS at REBNY
- 2024-11-16 Rental Removed $3,500 LISTANZA
- 2024-11-08 Listed for Rent $3,500 LISTANZA
- 2024-11-08 Rental Removed $3,799 LISTANZA
- 2024-08-04 Listed for Rent $4,000 LISTANZA
- 2023-10-16 Rental Removed $3,600 LISTANZA
- 2023-09-22 Listed for Rent $3,600 LISTANZA
- 2023-09-18 Rental Removed $3,600 LISTANZA
- 2023-09-15 Listed for Rent $3,600 LISTANZA
- 2008-06-02 Sold (Public Records) $1,450,000 Public Records
Property tax history
+4.7%/yrLatest (2025): $25,010 · +6.9% YoY. Source: county tax records.
Cash-flow waterfall
monthlySold comps — $/sqft
last 12 mo · ≤1 miLoading sold comps…