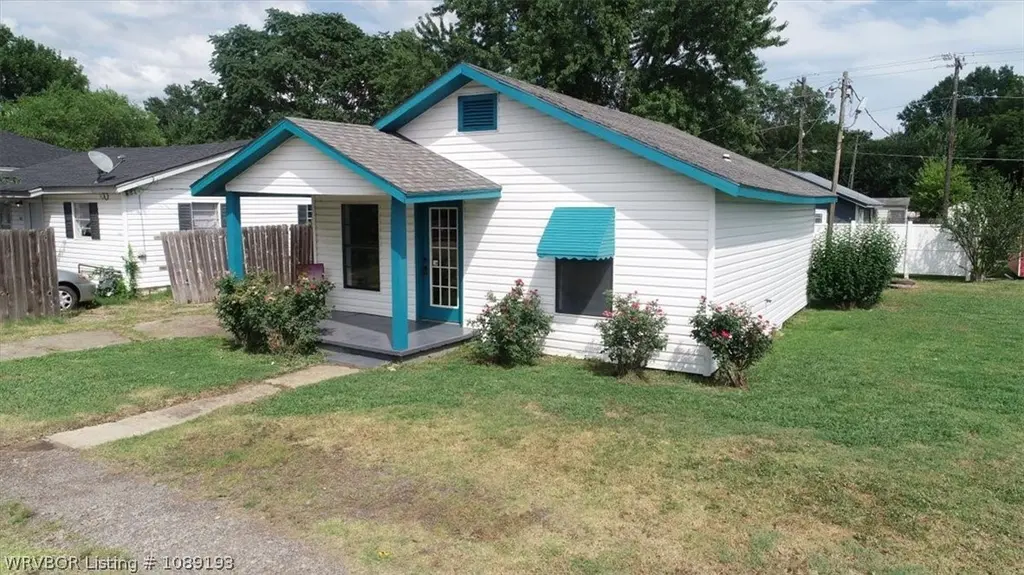
308 Peters St · Poteau, OK
Flood risk 1/10 · Minimal
- FEMA flood zone
- X (unshaded)
- Chance of flooding over 30 yrs
- 0.0%
- Est. flood insurance / yr
- $507 – $1,088
Fire risk 4/10 · Minor
- Est. fire insurance / yr
- $2,463 – $4,575
Heat risk 7/10 · Major
- Hot days now (above 114°F)
- 7 days/yr
- Hot days in 30 yrs
- 21 days/yr
Wind risk 2/10 · Minimal
- Chance of severe wind over 30 yrs
- 3.0%
Air-quality risk 2/10 · Minimal
- Unhealthy air days now
- 2 days/yr
- Unhealthy air days in 30 yrs
- 2 days/yr
Risk factors via First Street. Map © Google.
Why this score? — see what drove the A- grade
The composite is a weighted blend of 9 inputs, each scored 0–100. Each bar is that input's sub-score; the figure is the points it added to the 100-point composite (weight × sub-score).
- Cash flow +30.0/30.0
- ARV discount +15.0/15.0
- 1% rule +10.0/10.0
- DSCR +10.0/10.0
- Appreciation +7.1/10.0
- Livability +2.9/5.0
- Rent growth +2.5/5.0
- Schools +2.5/10.0
- Condition / age +2.5/5.0
$69,921
🖨 Deal sheet 📄 Offer letter ✓ Due diligence
Listing remarks
Take a look at this Commercial property in the heart of Poteau! Currently it was being used as a Pet Grooming Salon but it offers endless opportunities for your business including a Hair Salon, Nail Salon, or Barber Shop! Call today to schedule your tour!
Key facts
- 4,217 sq ft lot
- Built 1945
- Listed 28 days
Property features AI
Exterior
- Parking: Concrete parking
- Security: Smoke detectors
- Utilities: Public water; Sewer available; Electricity available; Natural gas available; Cable available; Phone available
- Home design: Single-family residence; One story
- Construction: Vinyl siding; Asphalt shingle roof
- Exterior features: Covered patio/porch; Partial fencing; Cleared, level city lot; Publicly maintained road access; Sidewalks in the community
Interior
- Flooring: Vinyl
- Bathrooms: One half bathroom
- Heating & cooling: Central heating; Central air conditioning
- Interior features: Electric water heater; Vinyl flooring
- Laundry & utility: Washer hookup; Electric dryer hookup
Neighborhood map
What this means for you Summary
Snapshot
- This is a 1-bed/1.0-bath single-family listed at $70k.
Deal economics
- At list price, monthly cash flow is $417 ($5k/yr) — positive.
- The deal already cash-flows at list — no discount required.
- Meets the 1% rule at list price ($1k rent vs $70k).
- Recommended offer: $69k (1.5% below list) — sets the bar for market timing.
- Cap rate 13.4% vs local median 3.8% in Poteau — top-decile yield for the area; either an underpriced asset or a hidden risk that comps aren't pricing in. Stress-test before assuming the spread holds.
Location & tenants
- Location reads 57/100 on livability (#485 in OK) — a working-class tenant base; expect higher turnover. Strengths: cost of living A+, housing A+; Watch: crime D+, amenities F, commute F.
- Poteau (town): math 30% / reading 29% proficiency, ranked #68 of 270 in OK (top 25%) — low school quality limits family demand, transient renter base, plan for 1-2y turnover.
- Zoned schools: Poteau Upper Es (math 45% / reading 36%, grade F, #98 of 845 statewide, top 12%, 471 students, 0% FRL); Poteau Hs (math 22% / reading 32%, grade F, #125 of 447 statewide, top 31%, 636 students, 0% FRL) — zoned schools average 0% FRL vs 54% district-wide (54 pts lower); this property's tenant base skews higher-income than the district average.
- Market conditions: 137 active listings in the ZIP; 73 units permitted in Le Flore County in 2024 (0 in 5+ unit buildings).
Forward outlook
- In year one you build about $3k of equity ($484 loan paydown + $3k appreciation (4.2% local appreciation)).
- Le Flore County population projected at -13% by 2050 — secular population decline; favor cash flow + early exit over multi-decade hold.
- At projected returns (4.2% appreciation + 3.0% rent growth), your $20k cash investment doubles in ~3 years — after that, you're playing with house money.
- By year 10, paydown + projected appreciation supports a ~$34k cash-out refi (75% LTV) — recoverable capital for the next deal without selling this one.
Negotiation context
- It's been on market 29 days — a 2% lower offer ($69k) is reasonable based on typical stale-listing flexibility.
- 2 sale attempts since 2y ago with the ask held roughly flat each time — persistent listings suggest the price (not the market) is what's stuck; bring a comps-based counter.
Risks & watch-outs
- Watch-outs: built in 1945 — expect roof / HVAC / electrical / plumbing capex.
- Climate carrying-cost: extreme-heat days projected 7→21/yr by 2055 (HVAC capex compounding) — expect insurance premiums to compound above CPI over the hold.
Questions for the listing agent
- Built in 1945 — when were the roof, HVAC, electrical panel, plumbing, and water heater last replaced?
- Is there a deadline driving the sale (1031 exchange, divorce, estate, relocation)? That informs how much negotiation room exists.
- Schools are F-rated, which usually means shorter tenancies and higher turnover. Who's the typical renter profile here, and what's been the actual vacancy rate?
- Crime grade is D in this area — have there been break-ins, vandalism, or insurance claims at this property in the last 3 years? What carrier currently insures it and at what premium?
- What's the average days-on-market for RENTAL listings here right now (not sales)? A rising rental-DOM trend means longer vacancies and softer asking-rent achievability than the comps imply.
- What's the recent tenant-quality profile in this submarket — average credit score on applications, eviction rate, late-payment / NSF rate, and stable-employment percentage? A property-management company in the area should have these aggregated.
- How much new for-sale + rental construction is in the pipeline within 1–3 miles? Heavy new supply typically softens prices + rents 12–24 months out; constrained supply supports both.
Investment metrics
- 1% rule
- 1.53% ✓
- Cap rate
- 13.44%
- Cash-on-cash
- 25.54%
- DSCR
- 2.14
- GRM
- 5.5
CMA / ARV
- ARV (on-the-fly)
- $97,200
- Comps found
- 2
Show comp detail 2 sales within ~0.75 mi
| Address | Dist | Beds/Ba | Sqft | Sold | Price | $/sf | Match |
|---|---|---|---|---|---|---|---|
| 405 Mckenna St | 0.06mi | 2/1.0 (+1) | 732 (+13%) | 11mo | $110,000 | $150 | 62 |
| 603 Grady Ave | 0.42mi | 2/1.0 (+1) | 620 (-4%) | 23mo | $64,000 | $103 | 49 |
Match score weights: distance 35% · size 25% · config 20% · recency 20%. Top-matched comps best support the ARV.
Projected returns pro-forma
4.22% appreciation · 3.0% rent growth · sell at horizon
- IRR
- 33.8%
- Equity multiple
- 3.02×
- Total profit
- $39,571
- Equity at exit
- $36,363
- IRR
- 32.9%
- Equity multiple
- 6.02×
- Total profit
- $98,242
- Equity at exit
- $60,215
Cash invested: $19,578 (down + closing). Projections, not guarantees.
Landlord ↔ Tenant lean methodology
- Overall (STATE)
- 83 Strongly Landlord-Friendly
- State Oklahoma
- 83 Strongly Landlord-Friendly · R+20
- County
- — inherits STATE
- City
- — inherits STATE
ZIP-level market 74953
- Home prices YoY
- 1.7%
- Active inventory
- 137
- Price-to-rent
- 5.5×
Monthly cashflow live
- Estimated rent
- $1,067 medium interval (Pro) →
- Mortgage (P&I)
- −$367
- Tax from tax record
- −$31 /mo · $367/yr
- Insurance
- −$29
- HOA
- −$0
- Vacancy / Maint / Mgmt
- −$224
- Net cashflow
- $417
Break-even live
UW: 25.0% down · 7.5% · 30yr · 1.5% tax · 5.0% vac · 8.0% maint · 8.0% mgmt
Financing live
Cash to close
- Down payment
- $17,480
- Closing costs
- $2,098
- Reserves months
- —
- Total cash needed
- —
Loan-product check · same deal, 3 products live
Conventional
25% down · 7.5% · 30yr
- Down + closing
- —
- Monthly P&I
- —
- Monthly cashflow
- —
- DSCR
- —
- Eligible?
- —
Personal DTI + credit; lowest rate.
DSCR
20% down · 8.5% · 30yr
- Down + closing
- —
- Monthly P&I
- —
- Monthly cashflow
- —
- DSCR
- —
- Eligible?
- —
No personal income docs; deal must DSCR.
Hard money
10% down · 12.0% · 12mo
- Down + closing
- —
- Monthly P&I
- —
- Monthly cashflow
- —
- DSCR
- —
- Eligible?
- —
Short-term bridge; refi at stabilization.
Listing history 20 events
-
2026-06-18days on market $69,921 Active 29 DOM
-
2026-06-17days on market $69,921 Active 28 DOM
-
2026-06-16days on market $69,921 Active 27 DOM
-
2026-06-15days on market $69,921 Active 26 DOM
-
2026-06-13days on market $69,921 Active 24 DOM
-
2026-06-12days on market $69,921 Active 23 DOM
-
2026-06-09days on market $69,921 Active 20 DOM
-
2026-06-08days on market $69,921 Active 19 DOM
-
2026-06-08days on market $69,921 Active 18 DOM
-
2026-06-07days on market $69,921 Active 17 DOM
-
2026-06-04days on market $69,921 Active 14 DOM
-
2026-06-02days on market $69,921 Active 13 DOM
-
2026-06-01days on market $69,921 Active 12 DOM
-
2026-05-31days on market $69,921 Active 11 DOM
-
2026-05-19$69,921 Active
-
2026-01-07price $77,921
-
2025-07-11price $79,900
-
2025-01-23price $84,901
-
2024-09-17price $89,999
-
2024-08-12$94,900 Active
ⓘ Source: listings_history table (triggers on properties + properties_extension) + one-shot
backfill from property_details.listing_events for pre-trigger history.
Tax reassessment forecast OK · Resets to sale price
- Current annual tax
- $367 · $31/mo
- Projected year-2 tax
- $629 · $52/mo
- Expected delta
- +$262/yr (+$22/mo · 71.5%)
ⓘ Screening estimate from a state-policy table — verify with the county assessor before closing.
Climate risk First Street
- Flood 1/10 Low FEMA zone X (unshaded) · 0% chance over 30 yrs
- Wildfire 4/10 Moderate
- Heat 7/10 Severe 7 d/yr ≥114°F today · 21 d/yr by 30 yrs out
- Wind 2/10 Low 3% chance of damaging wind over 30 yrs
- Air quality 2/10 Low 2 unhealthy d/yr today · 2 by 30 yrs out
Nearby sold comps map
Loading sold comps map…
Walkable amenities ~0.75 mi
Loading nearby amenities…
Taxation est. · year 1
- Rental income
- $12,806
- − Mortgage interest
- −$3,917
- − Property taxes
- −$367
- − Insurance
- −$350
- − Repairs & maintenance
- −$1,024
- − Management
- −$1,024
- − Depreciation
- −$2,034
- Taxable income
- $4,090
- Est. tax owed @ 24.0%
- −$982
- After-tax cash flow
- $4,019/yr
For passive investors: Depreciation is non-cash, so a rental often shows a tax loss while cash-flowing — sheltering income. Rental losses are passive: they offset passive income freely, and up to $25,000/yr can offset ordinary (W-2) income if you actively participate and your MAGI is under $100k (phasing out to $0 by $150k); unused losses carry forward. On sale, claimed depreciation is recaptured at up to 25%, and gains may owe capital-gains tax (a 1031 exchange can defer both). Figures are a year-1 estimate at your 24.0% rate — not tax advice; consult a CPA.
Schools (NCES district)
- District
- Poteau
- NCES district ID
- 4024870
- Math proficiency
- 30% ▼ -4.00%
- Reading proficiency
- 29% ▼ -4.00%
- Median HH income
- $42,165
- Composite
- 25.05/100
- National rank
- #7546
- State rank
- #68 of 270 in OK
Livability — Poteau
- Score
- 57/100
- State rank
- #485
- US rank
- #22172
Category grades
Schools grade is shown separately in the Schools card above.
Census & demographics
- Census place
- Poteau, OK
- Population (ZIP)
- 12,284
Population outlook (Le Flore County) Hauer SSP2
- Today (2025)
- 48,504 people
- By 2030
- 47,474 · -2.1%
- By 2040
- 44,914 · -7.4%
- By 2050
- 42,239 · -12.9%
- By 2075
- 35,071 · -27.7%
- By 2100
- 25,949 · -46.5%
Race, ethnicity, and origin ACS 2023
- Neighborhood character
- Predominantly White (70%)
- Race & ethnicity
- White 70% Hispanic / Latino 12% Native American 10% Two or more races 10% Black 1%
- Hispanic origin (detail)
- Mexican 11%
- Common ancestry
- Slovak 2% Iranian 2% Serbian 1%
- Foreign-born
- 7% · Canada
- Languages at home
- 90% English-only · Spanish 10%
Political lean MEDSL · Le Flore
- 2024 margin
- Solid R (+64.8) · D 17.0% · R 81.8% · Other 1.3%
- 2008→2024 swing
- -26.1pp toward R · 2008: -38.6pp · 2024: -64.8pp
- All cycles
- 2024: R+64.8 2020: R+63.4 2016: R+58.7 2012: R+41.1 2008: R+38.6
Not yet ingested
- Civics
- —
Market trends
- HPI YoY
- ▲ 4.22%
- Current HPI
- 252.3937
- Rent YoY
- —
- Metro
- —
- State GDP YoY
- ▲ 1.55%
- F500 in state
- 6
Industry mix (Fortune 500 HQ in OK)
| Industry | F500 HQs | Revenue |
|---|---|---|
| Energy | 3 | $48B |
|
||
Price history
-26.3% since first listed6 events — show timeline
- 2026-05-19 Listed $69,921 WRVBOR
- 2026-01-07 Price Changed $77,921 WRVBOR
- 2025-07-11 Price Changed $79,900 WRVBOR
- 2025-01-23 Price Changed $84,901 WRVBOR
- 2024-09-17 Price Changed $89,999 WRVBOR
- 2024-08-12 Listed $94,900 WRVBOR
Property tax history
+1.5%/yrLatest (2025): $367 · +4.9% YoY. Source: county tax records.
Cash-flow waterfall
monthlySold comps — $/sqft
last 12 mo · ≤1 miLoading sold comps…