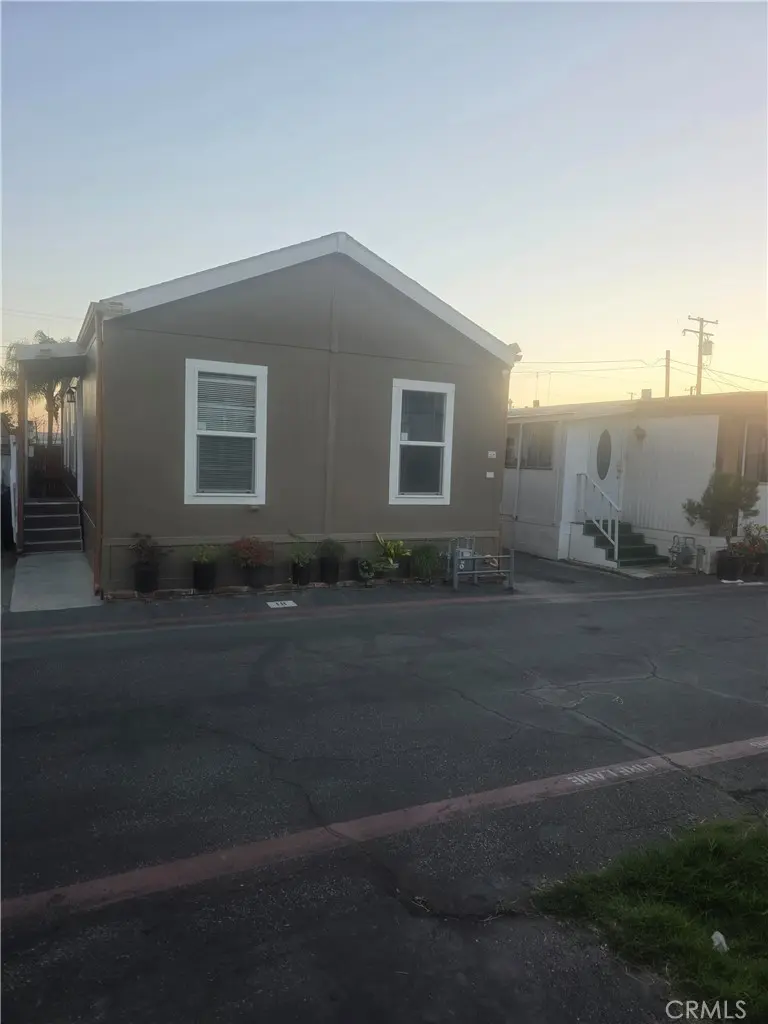
812 N Loren Ave #18 · Azusa, CA
Flood risk 1/10 · Minimal
- FEMA flood zone
- X (unshaded)
- Chance of flooding over 30 yrs
- 0.0%
- Est. flood insurance / yr
- $507 – $1,088
Fire risk 3/10 · Minor
- Est. fire insurance / yr
- $659 – $1,223
Heat risk 7/10 · Major
- Hot days now (above 99°F)
- 7 days/yr
- Hot days in 30 yrs
- 19 days/yr
Wind risk 1/10 · Minimal
- Chance of severe wind over 30 yrs
- —
Air-quality risk 7/10 · Major
- Unhealthy air days now
- 15 days/yr
- Unhealthy air days in 30 yrs
- 17 days/yr
Risk factors via First Street. Map © Google.
Why this score? — see what drove the C+ grade
The composite is a weighted blend of 9 inputs, each scored 0–100. Each bar is that input's sub-score; the figure is the points it added to the 100-point composite (weight × sub-score).
- Cash flow +27.8/30.0
- DSCR +9.8/10.0
- ARV discount +7.5/15.0
- 1% rule +6.5/10.0
- Rent growth +3.8/5.0
- Schools +3.3/10.0
- Livability +3.2/5.0
- Condition / age +2.5/5.0
- Appreciation +0.0/10.0
$239,000
🖨 Deal sheet 📄 Offer letter ✓ Due diligence
Listing remarks MLS
Remodeled 2015 built Manufactured Home located in a family park Close to schools , shopping, restaurants and freeways. Beutiful open spacious living room with high ceilings, Kitchen has Formica counter tops, newer sink with garbage disposal , fixtures and newer appliances, Washer and Dryer included Good size master bedroom plus two other bedrooms also has full hallway bathroom, inside laundry, Newer wood flooring through-out, Camera System. Schedule a showing today and make this dream Manutatured Home your clients a reality.
Key facts
- Built 2015
- Listed 134 days
Neighborhood map
What this means for you Summary
Snapshot
- This is a 3-bed/2.0-bath manufactured listed at $239k.
Deal economics
- At list price, monthly cash flow is $730 ($9k/yr) — positive.
- The deal already cash-flows at list — no discount required.
- Meets the 1% rule at list price ($3k rent vs $239k).
- Recommended offer: $210k (12.0% below list) — sets the bar for market timing.
- Cap rate 10.0% vs local median 2.6% in Azusa — top-decile yield for the area; either an underpriced asset or a hidden risk that comps aren't pricing in. Stress-test before assuming the spread holds.
Location & tenants
- Location reads 65/100 on livability (#367 in CA) — a middle-class / working-renter tenant base. Strengths: commute A+, employment B; Watch: schools D-, amenities D-, cost of living F.
- Azusa Unified (suburban): math 30% / reading 39% proficiency, ranked #874 of 1,400 in CA (top 62%) — families likely to look elsewhere, expect single-tenant / working-renter base with shorter leases; 70% free/reduced lunch — lower-income household profile, screen leases tightly.
- Market conditions: Rents rising fast (+5.4%/yr); 96 active listings in the ZIP; 33 comparable units currently listed for rent nearby; rentals at typical pace (median 19d on market — plan ~3-4 weeks tenant-placement turnaround); solid renter incomes; 19,697 units permitted in Los Angeles County in 2024 (9,426 in 5+ unit buildings).
- This rent runs 36% of the median local income ($93k/yr) — at the standard rent-burdened threshold; future hikes will face affordability resistance.
Forward outlook
- Local home prices are declining (-3.0%/yr); year-one equity from $2k of loan paydown is wiped out by about $7k of value loss. Plan a longer hold.
- Los Angeles County population projected at +9% by 2050 — modest demand growth; plan on rents tracking national, not racing it.
- At projected returns (-3.0% appreciation + 5.4% rent growth), your $67k cash investment doubles in ~8 years — after that, you're playing with house money.
Negotiation context
- It's been on market 135 days — a 12% lower offer ($210k) is reasonable based on typical stale-listing flexibility.
- 3 sale attempts since 9y ago; this cycle's ask has dropped $20k (8%) from the opening price — seller is motivated, your offer sets the floor, not the list.
Risks & watch-outs
- Climate carrying-cost: extreme-heat days projected 7→19/yr by 2055 (HVAC capex compounding) — expect insurance premiums to compound above CPI over the hold.
Questions for the listing agent
- It's been on market 135 days. Have you received any prior offers? Is the seller open to a 12% concession, seller financing, or rate buy-down credit?
- Why hasn't it sold? Are there any deal-killer items the seller is aware of (foundation, flood, title, zoning, code violations)?
- Is there a deadline driving the sale (1031 exchange, divorce, estate, relocation)? That informs how much negotiation room exists.
- Schools are D-rated, which usually means shorter tenancies and higher turnover. Who's the typical renter profile here, and what's been the actual vacancy rate?
- What's the average days-on-market for RENTAL listings here right now (not sales)? A rising rental-DOM trend means longer vacancies and softer asking-rent achievability than the comps imply.
- What's the recent tenant-quality profile in this submarket — average credit score on applications, eviction rate, late-payment / NSF rate, and stable-employment percentage? A property-management company in the area should have these aggregated.
- How much new for-sale + rental construction is in the pipeline within 1–3 miles? Heavy new supply typically softens prices + rents 12–24 months out; constrained supply supports both.
Investment metrics
- 1% rule
- 1.15% ✓
- Cap rate
- 9.96%
- Cash-on-cash
- 13.10%
- DSCR
- 1.58
- GRM
- 7.3
CMA / ARV
- ARV (median comp)
- $141,118
- List price
- $239,000
- Delta
- 69.36%
- Verdict
- OVERPRICED
- Comps
- 3 within 2.0 mi
Projected returns pro-forma
-3.0% appreciation · 5.38% rent growth · sell at horizon
- IRR
- 5.4%
- Equity multiple
- 1.22×
- Total profit
- $14,426
- Equity at exit
- $35,636
- IRR
- 16.7%
- Equity multiple
- 2.51×
- Total profit
- $101,072
- Equity at exit
- $20,664
Cash invested: $66,920 (down + closing). Projections, not guarantees.
Landlord ↔ Tenant lean methodology
- Overall (STATE)
- 18 Strongly Tenant-Friendly
- State California
- 18 Strongly Tenant-Friendly · D+13
- County
- — inherits STATE
- City
- — inherits STATE
ZIP-level market 91702
- Rents YoY
- 5.4%
- Active inventory
- 96
- Price-to-rent
- 7.3×
Monthly cashflow live
- Estimated rent
- $2,743 high interval (Pro) →
- Mortgage (P&I)
- −$1,253
- Tax from tax record
- −$84 /mo · $1,008/yr
- Insurance
- −$100
- HOA
- −$0
- Vacancy / Maint / Mgmt
- −$576
- Net cashflow
- $730
Break-even live
UW: 25.0% down · 7.5% · 30yr · 1.5% tax · 5.0% vac · 8.0% maint · 8.0% mgmt
Financing live
Cash to close
- Down payment
- $59,750
- Closing costs
- $7,170
- Reserves months
- —
- Total cash needed
- —
Loan-product check · same deal, 3 products live
Conventional
25% down · 7.5% · 30yr
- Down + closing
- —
- Monthly P&I
- —
- Monthly cashflow
- —
- DSCR
- —
- Eligible?
- —
Personal DTI + credit; lowest rate.
DSCR
20% down · 8.5% · 30yr
- Down + closing
- —
- Monthly P&I
- —
- Monthly cashflow
- —
- DSCR
- —
- Eligible?
- —
No personal income docs; deal must DSCR.
Hard money
10% down · 12.0% · 12mo
- Down + closing
- —
- Monthly P&I
- —
- Monthly cashflow
- —
- DSCR
- —
- Eligible?
- —
Short-term bridge; refi at stabilization.
Rent comps 33 comps
| Address | Beds | Baths | Sqft | Rent | $/sqft | DOM | Units | Dist |
|---|---|---|---|---|---|---|---|---|
| 929 Sierra Madre Ave Azusa, CA | 2.0 | 1.0 | 836 | $2,250 | $2.69 | 7d | 1 | 0.43mi |
| 1076 W Calle del Sol #2 Azusa, CA | 2.0 | 1.0 | 776 | $2,550 | $3.29 | 24d | 1 | 0.46mi |
| 1189 Sierra Madre Ave Azusa, CA | 2.0 | 1.0 | 836 | $1,900 | $2.27 | 7d | 1 | 0.46mi |
| 642 W 10th St Azusa, CA | 2.0 | 1.0 | 785 | $2,485 | $3.17 | 43d | 1 | 0.49mi |
| 347 N Barbara Ave Azusa, CA | 3.0 | 1.0 | 1110 | $3,300 | $2.97 | 1d | 1 | 0.71mi |
| 610 W Hollyvale St Azusa, CA | 2.0 | 2.0 | 800 | $3,100 | $3.88 | 24d | 1 | 0.87mi |
| 1205 N San Gabriel Ave Unit 8 Azusa, CA | 2.0 | 2.0 | 1030 | $2,250 | $2.18 | 44d | 1 | 0.88mi |
| 525 N San Gabriel Ave Unit 3 Azusa, CA | 2.0 | 1.0 | 877 | $1,995 | $2.27 | 7d | 1 | 0.90mi |
| 644 W 3rd St Azusa, CA | 2.0 | 1.0 | 900 | $2,595 | $2.88 | 24d | 1 | 0.90mi |
| 1215 N San Gabriel Ave #202 Azusa, CA | 2.0 | 2.0 | 817 | $2,295 | $2.81 | 24d | 1 | 0.91mi |
| 850 N Azusa Ave Azusa, CA | 1.0–3.0 | 1.0–2.0 | 984 | $4,010 | $4.08 | 1d | 34 | 0.91mi |
| 626 N Azusa Ave Azusa, CA | 1.0–3.0 | 1.0–2.0 | 1095 | $3,870 | $3.53 | 1d | 6 | 0.94mi |
| 933 N Alameda Ave Unit 6 Azusa, CA | 2.0 | 1.0 | 736 | $2,100 | $2.85 | 43d | 1 | 0.95mi |
| 1240 N San Gabriel Ave Unit 1240-06 Azusa, CA | 2.0 | 1.5 | 975 | $2,500 | $2.56 | 43d | 1 | 0.95mi |
| 1240 N San Gabriel Ave Unit 1260-02 Azusa, CA | 2.0 | 1.5 | 975 | $2,550 | $2.62 | 13d | 1 | 0.96mi |
| 1240 N San Gabriel Ave Azusa, CA | 2.0 | 1.0 | 975 | $2,500 | $2.56 | 18d | 1 | 0.96mi |
| 1240 N San Gabriel Ave Azusa, CA | 2.0 | 1.5 | 975 | $2,500 | $2.56 | 4d | 1 | 0.96mi |
| 1240 N San Gabriel Ave Azusa, CA | 2.0 | 1.0 | 975 | $2,550 | $2.62 | 3d | 1 | 0.96mi |
| 1240 N San Gabriel Ave Azusa, CA | 2.0 | 1.0 | 850 | $2,750 | $3.24 | 43d | 1 | 0.96mi |
| 1240 N San Gabriel Ave Unit 1240-11 Azusa, CA | 2.0 | 1.0 | 850 | $2,100 | $2.47 | 43d | 1 | 0.96mi |
| 1280 N San Gabriel Ave Azusa, CA | 2.0 | 1.0–1.5 | 925 | $2,225 | $2.41 | 7d | 3 | 0.98mi |
| 1311 N Azusa Ave Azusa, CA | 1.0–2.0 | 1.0 | 745 | $2,370 | $3.18 | 43d | 3 | 1.01mi |
| 1381 N San Gabriel Canyon Rd Azusa, CA | 2.0 | 2.0 | 975 | $2,750 | $2.82 | 1d | 1 | 1.05mi |
| 909 W 1st St Azusa, CA | 2.0–4.0 | 2.0–2.5 | 1143 | $3,760 | $3.29 | 1d | 5 | 1.06mi |
| 607 N Dalton Ave Unit 1 Azusa, CA | 2.0 | 1.0 | 960 | $2,100 | $2.19 | 43d | 1 | 1.07mi |
| 236 N San Gabriel Ave Unit 8 Azusa, CA | 2.0 | 1.0 | 600 | $2,100 | $3.50 | 24d | 1 | 1.13mi |
| 236 N San Gabriel Ave Unit 8 Azusa, CA | 2.0 | 1.0 | 588 | $2,200 | $3.74 | 43d | 1 | 1.13mi |
| 236 N San Gabriel Ave Unit 14 Azusa, CA | 2.0 | 1.0 | 710 | $2,100 | $2.96 | 43d | 1 | 1.13mi |
| 306 N Azusa Ave Azusa, CA | 2.0 | 1.0 | 850 | $1,955 | $2.30 | 3d | 1 | 1.17mi |
| 539 N Pasadena Ave Unit 1 Azusa, CA | 2.0 | 2.0 | 1000 | $2,700 | $2.70 | 18d | 1 | 1.22mi |
| 601 E 8th St Azusa, CA | 1.0–4.0 | 1.0–2.0 | 880 | $2,283 | $2.59 | 7d | 3 | 1.32mi |
| 1784 Shady Oaks Ct Azusa, CA | 2.0 | 2.0 | 1007 | $2,800 | $2.78 | 20d | 1 | 1.38mi |
| 160 N Soldano Ave Azusa, CA | 2.0 | 1.0 | 800 | $2,500 | $3.12 | 2d | 1 | 1.45mi |
Listing history 22 events
-
2026-06-18days on market $239,000 Active 135 DOM
-
2026-06-17days on market $239,000 Active 134 DOM
-
2026-06-16days on market $239,000 Active 133 DOM
-
2026-06-15days on market $239,000 Active 132 DOM
-
2026-06-13days on market $239,000 Active 130 DOM
-
2026-06-13days on market $239,000 Active 129 DOM
-
2026-06-09days on market $239,000 Active 126 DOM
-
2026-06-08days on market $239,000 Active 125 DOM
-
2026-06-07days on market $239,000 Active 124 DOM
-
2026-06-04days on market $239,000 Active 121 DOM
-
2026-06-03days on market $239,000 Active 120 DOM
-
2026-06-02days on market $239,000 Active 119 DOM
-
2026-06-01days on market $239,000 Active 118 DOM
-
2026-05-31days on market $239,000 Active 117 DOM
-
2026-03-19price $244,900 530-char remark
Show marketing remark (530 chars)
Remodeled 2015 built Manufactured Home located in a family park Close to schools , shopping, restaurants and freeways. Beutiful open spacious living room with high ceilings, Kitchen has Formica counter tops, newer sink with garbage disposal , fixtures and newer appliances, Washer and Dryer included Good size master bedroom plus two other bedrooms also has full hallway bathroom, inside laundry, Newer wood flooring through-out, Camera System. Schedule a showing today and make this dream Manutatured Home your clients a reality.
-
2026-02-25price $255,000 530-char remark
Show marketing remark (530 chars)
Remodeled 2015 built Manufactured Home located in a family park Close to schools , shopping, restaurants and freeways. Beutiful open spacious living room with high ceilings, Kitchen has Formica counter tops, newer sink with garbage disposal , fixtures and newer appliances, Washer and Dryer included Good size master bedroom plus two other bedrooms also has full hallway bathroom, inside laundry, Newer wood flooring through-out, Camera System. Schedule a showing today and make this dream Manutatured Home your clients a reality.
-
2026-02-03$259,000 Active 530-char remark
Show marketing remark (530 chars)
Remodeled 2015 built Manufactured Home located in a family park Close to schools , shopping, restaurants and freeways. Beutiful open spacious living room with high ceilings, Kitchen has Formica counter tops, newer sink with garbage disposal , fixtures and newer appliances, Washer and Dryer included Good size master bedroom plus two other bedrooms also has full hallway bathroom, inside laundry, Newer wood flooring through-out, Camera System. Schedule a showing today and make this dream Manutatured Home your clients a reality.
-
2017-07-01status Active
-
2017-07-01historical Hold Do Not Show
-
2017-06-24historical Hold Do Not Show
-
2017-05-04price $99,000
-
2017-04-24$112,000 Active
ⓘ Source: listings_history table (triggers on properties + properties_extension) + one-shot
backfill from property_details.listing_events for pre-trigger history.
Tax reassessment forecast CA · Resets to sale price
- Current annual tax
- $1,008 · $84/mo
- Projected year-2 tax
- $1,816 · $151/mo
- Expected delta
- +$809/yr (+$67/mo · 80.3%)
ⓘ Screening estimate from a state-policy table — verify with the county assessor before closing.
Climate risk First Street
- Flood 1/10 Low FEMA zone X (unshaded) · 0% chance over 30 yrs
- Wildfire 3/10 Moderate
- Heat 7/10 Severe 7 d/yr ≥99°F today · 19 d/yr by 30 yrs out
- Wind 1/10 Low
- Air quality 7/10 Severe 15 unhealthy d/yr today · 17 by 30 yrs out
Nearby sold comps map
Loading sold comps map…
Walkable amenities ~0.75 mi
Loading nearby amenities…
Taxation est. · year 1
- Rental income
- $32,921
- − Mortgage interest
- −$13,388
- − Property taxes
- −$1,008
- − Insurance
- −$1,195
- − Repairs & maintenance
- −$2,634
- − Management
- −$2,634
- − Depreciation
- −$6,953
- Taxable income
- $5,110
- Est. tax owed @ 24.0%
- −$1,227
- After-tax cash flow
- $7,538/yr
For passive investors: Depreciation is non-cash, so a rental often shows a tax loss while cash-flowing — sheltering income. Rental losses are passive: they offset passive income freely, and up to $25,000/yr can offset ordinary (W-2) income if you actively participate and your MAGI is under $100k (phasing out to $0 by $150k); unused losses carry forward. On sale, claimed depreciation is recaptured at up to 25%, and gains may owe capital-gains tax (a 1031 exchange can defer both). Figures are a year-1 estimate at your 24.0% rate — not tax advice; consult a CPA.
Schools (NCES district)
- District
- Azusa Unified
- NCES district ID
- 0603600
- Math proficiency
- 30% ▲ 2.00%
- Reading proficiency
- 39% ▬ 0.00%
- Median HH income
- $58,149
- Composite
- 33.35/100
- National rank
- #10566
- State rank
- #874 of 1400 in CA
Livability — Azusa
- Score
- 65/100
- State rank
- #367
- US rank
- #12533
Category grades
Schools grade is shown separately in the Schools card above.
Census & demographics
- Census place
- Azusa, CA
- County
- Los Angeles County · 9,444,647 people
- City population
- 60,903
- Metro
- Los Angeles-Long Beach-Anaheim, CA
- Population (ZIP)
- 60,903
- Household income
- $92,683
- Rent vs Own
- Severe rent burden
- 1631.0
Population outlook (Los Angeles County) Hauer SSP2
- Today (2025)
- 10,940,515 people
- By 2030
- 11,256,481 · +2.9%
- By 2040
- 11,729,929 · +7.2%
- By 2050
- 11,948,407 · +9.2%
- By 2075
- 11,818,114 · +8.0%
- By 2100
- 10,842,928 · -0.9%
Race, ethnicity, and origin ACS 2023
- Neighborhood character
- Predominantly Hispanic (68%)
- Race & ethnicity
- Hispanic / Latino 68% Two or more races 21% White 14% Asian 13% Black 2% Native American 1%
- Hispanic origin (detail)
- Mexican 59%
- Common ancestry
- Lithuanian 1% Italian 1%
- Foreign-born
- 33% · Canada, China, Vietnam
- Languages at home
- 42% English-only · Spanish 47% Chinese 3% Tagalog/Filipino 3%
Political lean MEDSL · Los Angeles
- 2024 margin
- Solid D (+32.9) · D 64.8% · R 31.9% · Other 3.3%
- 2008→2024 swing
- -7.4pp toward R · 2008: 40.4pp · 2024: 32.9pp
- All cycles
- 2024: D+32.9 2020: D+44.2 2016: D+48.0 2012: D+40.0 2008: D+40.4
Not yet ingested
- Civics
- —
Market trends
- HPI YoY
- ▼ -583.11%
- Current HPI
- 422.7044
- Rent YoY
- ▲ 5.38%
- Metro
- Los Angeles-Long Beach-Anaheim, CA
- State GDP YoY
- ▲ 3.21%
- F500 in state
- 116
Industry mix (Fortune 500 HQ in CA)
| Industry | F500 HQs | Revenue |
|---|---|---|
| Technology | 27 | $1,492B |
|
||
| Financial Services | 3 | $174B |
|
||
| Retail | 3 | $44B |
|
||
| Insurance | 3 | $26B |
|
||
| Media / Entertainment | 2 | $115B |
|
||
| Pharmaceuticals / Biotech | 2 | $62B |
|
||
Price history
+118.7% since first listed8 events — show timeline
- 2026-03-19 Price Changed $244,900 CRMLS
- 2026-02-25 Price Changed $255,000 CRMLS
- 2026-02-03 Listed $259,000 CRMLS
- 2017-07-01 Relisted — CRMLS
- 2017-07-01 Delisted — CRMLS
- 2017-06-24 Delisted — CRMLS
- 2017-05-04 Price Changed $99,000 CRMLS
- 2017-04-24 Listed $112,000 CRMLS
Property tax history
+0.2%/yrLatest (2025): $1,008 · +0.2% YoY. Source: county tax records.
Cash-flow waterfall
monthlySold comps — $/sqft
last 12 mo · ≤1 miLoading sold comps…