106 S Liberty St · Ohio City, OH
Flood risk 1/10 · Minimal
- FEMA flood zone
- X (unshaded)
- Chance of flooding over 30 yrs
- 0.0%
- Est. flood insurance / yr
- $507 – $1,088
Fire risk 1/10 · Minimal
- Est. fire insurance / yr
- $713 – $1,323
Heat risk 3/10 · Minor
- Hot days now (above 100°F)
- 7 days/yr
- Hot days in 30 yrs
- 18 days/yr
Wind risk 2/10 · Minimal
- Chance of severe wind over 30 yrs
- —
Air-quality risk 2/10 · Minimal
- Unhealthy air days now
- 1 days/yr
- Unhealthy air days in 30 yrs
- 2 days/yr
Risk factors via First Street. Map © Google.
Why this score? — see what drove the B+ grade
The composite is a weighted blend of 9 inputs, each scored 0–100. Each bar is that input's sub-score; the figure is the points it added to the 100-point composite (weight × sub-score).
- Cash flow +30.0/30.0
- 1% rule +10.0/10.0
- DSCR +10.0/10.0
- Appreciation +7.6/10.0
- ARV discount +7.5/15.0
- Schools +4.0/10.0
- Livability +3.0/5.0
- Rent growth +2.5/5.0
- Condition / age +2.5/5.0
$35,000
🖨 Deal sheet 📄 Offer letter ✓ Due diligence
Listing remarks
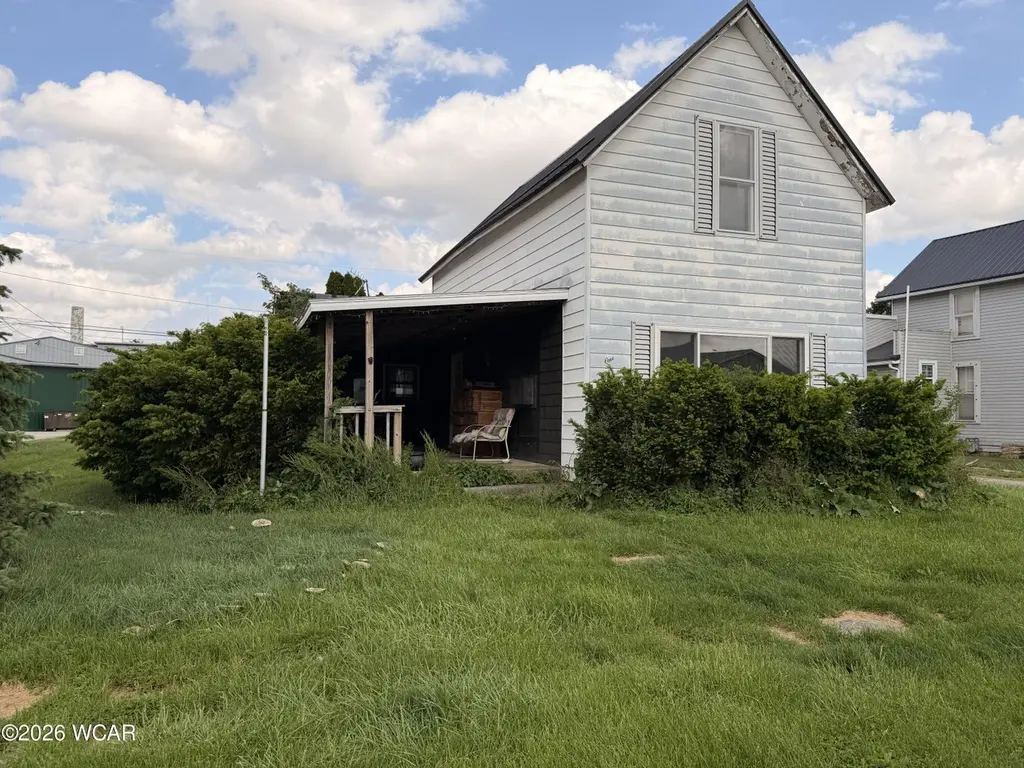
This 2-bedroom, 1-bath home is packed with potential and ready for someone with vision to bring it back to life. Featuring 992 sq ft, a 2-car attached garage, covered porch, and a metal roof that's only 6 years old, the big-ticket items are already a great start. Whether you're looking for your next investment opportunity, rental property, or fixer-upper project, this one has the bones to make it worth the work. Selling as is.
Key facts
- Covered porch
- Metal roof
- 6,730 sq ft lot
Tags
Property features AI
Exterior
- Parking: Detached 2-car garage
- Utilities: Public water; Public sewer
- Home design: Single-family residence; Two levels; Fixer condition; Residential zoning
- Construction: Aluminum siding; Wood siding
- Exterior features: Covered patio/porch; Garage(s) on the property
Interior
- Kitchen: Range; Refrigerator
- Flooring: Carpet
- Bathrooms: One full bathroom
- Heating & cooling: Space heater; No central cooling
- Interior features: Range and refrigerator included; Carpet flooring; Six total rooms
Neighborhood map
What this means for you Summary
Snapshot
- This is a 1-bed/1.0-bath single-family listed at $35k.
Deal economics
- At list price, monthly cash flow is $504 ($6k/yr) — positive.
- The deal already cash-flows at list — no discount required.
- Meets the 1% rule at list price ($974 rent vs $35k).
Location & tenants
- Location reads 60/100 on livability (#969 in OH) — a middle-class / working-renter tenant base. Strengths: cost of living A+, housing A+; Watch: employment D+, crime D, schools F.
- Van Wert City (rural): math 46% / reading 50% proficiency, ranked #476 of 656 in OH (top 73%) — families likely to look elsewhere, expect single-tenant / working-renter base with shorter leases.
- Market conditions: 2 active listings in the ZIP; 44 units permitted in Van Wert County in 2024 (0 in 5+ unit buildings).
- This rent is only 18% of the median local income ($67k/yr) — well below the 30% rent-burden line; pricing power to push rent on renewal without tenant pushback.
Forward outlook
- In year one you build about $2k of equity ($242 loan paydown + $2k appreciation (5.1% local appreciation)).
- Van Wert County population projected at -11% by 2050 — secular population decline; favor cash flow + early exit over multi-decade hold.
- At projected returns (5.1% appreciation + 3.0% rent growth), your $10k cash investment doubles in ~2 years — after that, you're playing with house money.
Negotiation context
- Only 8 days on market — expect competitive offers; lowballing is unlikely to land.
Risks & watch-outs
- Watch-outs: built in 1900 — expect roof / HVAC / electrical / plumbing capex.
Questions for the listing agent
- Built in 1900 — when were the roof, HVAC, electrical panel, plumbing, and water heater last replaced?
- Is there a deadline driving the sale (1031 exchange, divorce, estate, relocation)? That informs how much negotiation room exists.
- Schools are F-rated, which usually means shorter tenancies and higher turnover. Who's the typical renter profile here, and what's been the actual vacancy rate?
- Crime grade is D in this area — have there been break-ins, vandalism, or insurance claims at this property in the last 3 years? What carrier currently insures it and at what premium?
- What's the average days-on-market for RENTAL listings here right now (not sales)? A rising rental-DOM trend means longer vacancies and softer asking-rent achievability than the comps imply.
- What's the recent tenant-quality profile in this submarket — average credit score on applications, eviction rate, late-payment / NSF rate, and stable-employment percentage? A property-management company in the area should have these aggregated.
- How much new for-sale + rental construction is in the pipeline within 1–3 miles? Heavy new supply typically softens prices + rents 12–24 months out; constrained supply supports both.
Investment metrics
- 1% rule
- 2.78% ✓
- Cap rate
- 23.58%
- Cash-on-cash
- 61.73%
- DSCR
- 3.75
- GRM
- 3.0
CMA / ARV
- ARV (on-the-fly)
- $136,192
- Comps found
- 1
Show comp detail 1 sale within ~0.75 mi
| Address | Dist | Beds/Ba | Sqft | Sold | Price | $/sf | Match |
|---|---|---|---|---|---|---|---|
| 202 E Hoffman St | 0.25mi | 2/1.0 (+1) | 1,068 (-12%) | 8mo | $120,000 | $112 | 57 |
Match score weights: distance 35% · size 25% · config 20% · recency 20%. Top-matched comps best support the ARV.
Projected returns pro-forma
5.13% appreciation · 3.0% rent growth · sell at horizon
- IRR
- 68.7%
- Equity multiple
- 5.13×
- Total profit
- $40,463
- Equity at exit
- $20,109
- IRR
- 66.5%
- Equity multiple
- 10.64×
- Total profit
- $94,504
- Equity at exit
- $34,935
Cash invested: $9,800 (down + closing). Projections, not guarantees.
Landlord ↔ Tenant lean methodology
- Overall (STATE)
- 73 Landlord-Friendly
- State Ohio
- 73 Landlord-Friendly · R+6
- County
- — inherits STATE
- City
- — inherits STATE
ZIP-level market 45874
- Home prices YoY
- 2.0%
- Active inventory
- 2
- Price-to-rent
- 3.0×
Monthly cashflow live
- Estimated rent
- $974 medium interval (Pro) →
- Mortgage (P&I)
- −$184
- Tax from tax record
- −$67 /mo · $809/yr
- Insurance
- −$15
- HOA
- −$0
- Vacancy / Maint / Mgmt
- −$205
- Net cashflow
- $504
Break-even live
UW: 25.0% down · 7.5% · 30yr · 1.5% tax · 5.0% vac · 8.0% maint · 8.0% mgmt
Financing live
Cash to close
- Down payment
- $8,750
- Closing costs
- $1,050
- Reserves months
- —
- Total cash needed
- —
Loan-product check · same deal, 3 products live
Conventional
25% down · 7.5% · 30yr
- Down + closing
- —
- Monthly P&I
- —
- Monthly cashflow
- —
- DSCR
- —
- Eligible?
- —
Personal DTI + credit; lowest rate.
DSCR
20% down · 8.5% · 30yr
- Down + closing
- —
- Monthly P&I
- —
- Monthly cashflow
- —
- DSCR
- —
- Eligible?
- —
No personal income docs; deal must DSCR.
Hard money
10% down · 12.0% · 12mo
- Down + closing
- —
- Monthly P&I
- —
- Monthly cashflow
- —
- DSCR
- —
- Eligible?
- —
Short-term bridge; refi at stabilization.
Listing history 1 events
-
2026-05-20$35,000 Active
ⓘ Source: listings_history table (triggers on properties + properties_extension) + one-shot
backfill from property_details.listing_events for pre-trigger history.
Tax reassessment forecast OH · Partial reset (capped growth)
- Current annual tax
- $809 · $67/mo
- Projected year-2 tax
- $809 · $67/mo
- Expected delta
- $0/yr ($0/mo · 0.0%)
ⓘ Screening estimate from a state-policy table — verify with the county assessor before closing.
Climate risk First Street
- Flood 1/10 Low FEMA zone X (unshaded) · 0% chance over 30 yrs
- Wildfire 1/10 Low
- Heat 3/10 Moderate 7 d/yr ≥100°F today · 18 d/yr by 30 yrs out
- Wind 2/10 Low
- Air quality 2/10 Low 1 unhealthy d/yr today · 2 by 30 yrs out
Nearby sold comps map
Loading sold comps map…
Walkable amenities ~0.75 mi
Loading nearby amenities…
Taxation est. · year 1
- Rental income
- $11,691
- − Mortgage interest
- −$1,961
- − Property taxes
- −$809
- − Insurance
- −$175
- − Repairs & maintenance
- −$935
- − Management
- −$935
- − Depreciation
- −$1,018
- Taxable income
- $5,858
- Est. tax owed @ 24.0%
- −$1,406
- After-tax cash flow
- $4,644/yr
For passive investors: Depreciation is non-cash, so a rental often shows a tax loss while cash-flowing — sheltering income. Rental losses are passive: they offset passive income freely, and up to $25,000/yr can offset ordinary (W-2) income if you actively participate and your MAGI is under $100k (phasing out to $0 by $150k); unused losses carry forward. On sale, claimed depreciation is recaptured at up to 25%, and gains may owe capital-gains tax (a 1031 exchange can defer both). Figures are a year-1 estimate at your 24.0% rate — not tax advice; consult a CPA.
Schools (NCES district)
- District
- Van Wert City
- NCES district ID
- 3910023
- Math proficiency
- 46% ▼ -16.00%
- Reading proficiency
- 50% ▼ -13.00%
- Median HH income
- $41,846
- Composite
- 40.34/100
- National rank
- #3745
- State rank
- #476 of 656 in OH
Livability — Ohio City
- Score
- 60/100
- State rank
- #969
- US rank
- #18743
Category grades
Schools grade is shown separately in the Schools card above.
Census & demographics
- Census place
- Ohio City, OH
- County
- Van Wert · 34,605 people
- Population (ZIP)
- 2,186
- Household income
- $66,520
- Rent vs Own
Population outlook (Van Wert County) Hauer SSP2
- Today (2025)
- 28,235 people
- By 2030
- 27,793 · -1.6%
- By 2040
- 26,650 · -5.6%
- By 2050
- 25,251 · -10.6%
- By 2075
- 22,247 · -21.2%
- By 2100
- 18,559 · -34.3%
Race, ethnicity, and origin ACS 2023
- Neighborhood character
- Predominantly White (87%)
- Race & ethnicity
- White 87% Two or more races 10% Hispanic / Latino 8%
- Hispanic origin (detail)
- Mexican 7%
- Common ancestry
- Lithuanian 3% Iranian 1% Danish 1%
- Foreign-born
- 1% · Canada
- Languages at home
- 97% English-only · Spanish 2% German/W. Germanic 1%
Political lean MEDSL · Van Wert
- 2024 margin
- Solid R (+58.5) · D 20.4% · R 78.9%
- 2008→2024 swing
- -31.3pp toward R · 2008: -27.2pp · 2024: -58.5pp
- All cycles
- 2024: R+58.5 2020: R+57.4 2016: R+56.4 2012: R+40.5 2008: R+27.2
Not yet ingested
- Civics
- —
Market trends
- HPI YoY
- ▲ 5.13%
- Current HPI
- 256.1778
- Rent YoY
- —
- Metro
- —
- State GDP YoY
- ▲ 1.98%
- F500 in state
- 48
Industry mix (Fortune 500 HQ in OH)
| Industry | F500 HQs | Revenue |
|---|---|---|
| Insurance | 3 | $145B |
|
||
| Industrial Machinery | 3 | $49B |
|
||
| Financial Services | 3 | $24B |
|
||
| Consumer Goods | 2 | $93B |
|
||
| Aerospace / Defense | 2 | $47B |
|
||
| Utilities | 2 | $33B |
|
||
Price history
1 event — show timeline
- 2026-05-20 Listed $35,000 WCARE
Property tax history
-1.1%/yrLatest (2025): $809 · +1.4% YoY. Source: county tax records.
Cash-flow waterfall
monthlySold comps — $/sqft
last 12 mo · ≤1 miLoading sold comps…