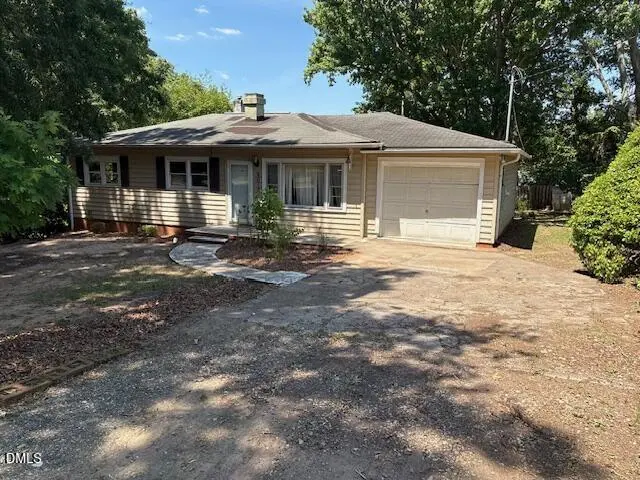
4016 Booker Ave · Durham, NC
Flood risk 1/10 · Minimal
- FEMA flood zone
- X (unshaded)
- Chance of flooding over 30 yrs
- 0.0%
- Est. flood insurance / yr
- $507 – $1,088
Fire risk 1/10 · Minimal
- Est. fire insurance / yr
- $906 – $1,684
Heat risk 6/10 · Moderate
- Hot days now (above 106°F)
- 7 days/yr
- Hot days in 30 yrs
- 16 days/yr
Wind risk 6/10 · Moderate
- Chance of severe wind over 30 yrs
- 27.0%
Air-quality risk 2/10 · Minimal
- Unhealthy air days now
- 1 days/yr
- Unhealthy air days in 30 yrs
- 1 days/yr
Risk factors via First Street. Map © Google.
Why this score? — see what drove the C+ grade
The composite is a weighted blend of 9 inputs, each scored 0–100. Each bar is that input's sub-score; the figure is the points it added to the 100-point composite (weight × sub-score).
- Cash flow +22.3/30.0
- ARV discount +15.0/15.0
- DSCR +7.1/10.0
- 1% rule +4.9/10.0
- Livability +4.0/5.0
- Schools +3.0/10.0
- Rent growth +2.7/5.0
- Condition / age +2.5/5.0
- Appreciation +0.0/10.0
$160,000
🖨 Deal sheet 📄 Offer letter ✓ Due diligence
Listing remarks
Investor opportunity in Durham! This 3-bedroom, 2-bath home is in need of a full rehab. The roof is leaking and will require replacement. Foundation cracks have been observed, and the floors are not level; buyers are encouraged to conduct further inspections and evaluations. Property is being sold strictly AS-IS. Seller will make no repairs. Electricity and water are currently off. Please use caution and watch your step when entering the property.
Key facts
- 0.26 acre lot
- Garage
- Built 1959
Property features AI
Finance
- Other: Lot size approximately 0.26 acres
- HOA & community: No association
Exterior
- Parking: Attached garage (1 covered space); Additional open parking for 2 vehicles
- Utilities: Public water; Public sewer; Publicly maintained asphalt road access
- Home design: Single-story house; One level; Fixer condition; Zoning: R-20
- Construction: Vinyl siding; Block foundation; Shingle roof; Built as a house
- Exterior features: Front porch
Interior
- Bedrooms: 3 bedrooms (all on the main level)
- Flooring: Hardwood; Tile
- Bathrooms: 2 full bathrooms
- Heating & cooling: No heating; Central air conditioning
- Interior features: Hardwood and tile flooring
Neighborhood map
What this means for you Summary
Snapshot
- This is a 2-bed/1.0-bath single-family listed at $160k.
Deal economics
- At list price, monthly cash flow is $264 ($3k/yr) — positive.
- The deal already cash-flows at list — no discount required.
- To meet the 1% rule (rent ≥ 1% of price), the offer needs to be $158k (1.3% below list).
- Recommended offer: $158k (1.3% below list) — sets the bar for 1% rule.
- Cap rate 8.3% vs local median 3.0% in Durham — top-decile yield for the area; either an underpriced asset or a hidden risk that comps aren't pricing in. Stress-test before assuming the spread holds.
Location & tenants
- Location reads 81/100 on livability (#15 in NC, #1,411 nationally) — a professional / high-income tenant draw. Strengths: amenities A+, commute A+, housing A+; Watch: schools D+, crime F.
- Durham Public Schools (urban): math 29% / reading 39% proficiency, ranked #132 of 178 in NC (top 74%) — families likely to look elsewhere, expect single-tenant / working-renter base with shorter leases.
- Market conditions: Rents flat; 359 active listings in the ZIP; 21 comparable units currently listed for rent nearby; rentals at typical pace (median 23d on market — plan ~3-4 weeks tenant-placement turnaround); solid renter incomes; 2,905 units permitted in Durham County in 2024 (955 in 5+ unit buildings).
Forward outlook
- Local home prices are declining (-3.0%/yr); year-one equity from $1k of loan paydown is wiped out by about $5k of value loss. Plan a longer hold.
- Durham County population projected at +44% by 2050 — long-run rental-demand tailwind backs the buy-and-hold thesis.
Negotiation context
- Only 1 days on market — expect competitive offers; lowballing is unlikely to land.
- 4 sale attempts since 20y ago with the ask held roughly flat each time — persistent listings suggest the price (not the market) is what's stuck; bring a comps-based counter.
- Current owner paid $118k; 36% above their basis — modest negotiation headroom, anchor on the comps not their cost.
Risks & watch-outs
- Watch-outs: built in 1959 — expect roof / HVAC / electrical / plumbing capex.
- Climate carrying-cost: major wind risk, 27% chance of damaging wind over 30y; extreme-heat days projected 7→16/yr by 2055 (HVAC capex compounding) — expect insurance premiums to compound above CPI over the hold.
Questions for the listing agent
- Built in 1959 — when were the roof, HVAC, electrical panel, plumbing, and water heater last replaced?
- Is there a deadline driving the sale (1031 exchange, divorce, estate, relocation)? That informs how much negotiation room exists.
- Schools are D-rated, which usually means shorter tenancies and higher turnover. Who's the typical renter profile here, and what's been the actual vacancy rate?
- Crime grade is F in this area — have there been break-ins, vandalism, or insurance claims at this property in the last 3 years? What carrier currently insures it and at what premium?
- What's the average days-on-market for RENTAL listings here right now (not sales)? A rising rental-DOM trend means longer vacancies and softer asking-rent achievability than the comps imply.
- What's the recent tenant-quality profile in this submarket — average credit score on applications, eviction rate, late-payment / NSF rate, and stable-employment percentage? A property-management company in the area should have these aggregated.
- How much new for-sale + rental construction is in the pipeline within 1–3 miles? Heavy new supply typically softens prices + rents 12–24 months out; constrained supply supports both.
Investment metrics
- 1% rule
- 0.99% ✗
- Cap rate
- 8.27%
- Cash-on-cash
- 7.07%
- DSCR
- 1.31
- GRM
- 8.4
CMA / ARV
- ARV (on-the-fly)
- $279,840
- Comps found
- 8
Show comp detail 8 sales within ~0.75 mi
| Address | Dist | Beds/Ba | Sqft | Sold | Price | $/sf | Match |
|---|---|---|---|---|---|---|---|
| 4008 Booker Ave | 0.03mi | 3/1.0 (+1) | 1,067 (+1%) | 3mo | $210,000 | $197 | 90 |
| 3506 Four Seasons Dr | 0.65mi | 3/1.5 (+1) | 1,053 (-1%) | 1mo | $205,000 | $195 | 60 |
| 1304 Tralea Dr | 0.40mi | 3/2.0 (+1) | 1,160 (+9%) | 3mo | $290,000 | $250 | 54 |
| 3624 Four Seasons Dr | 0.44mi | 3/1.5 (+1) | 966 (-9%) | 20mo | $267,000 | $276 | 41 |
| 3323 Fayetteville St Unit A | 0.74mi | 3/2.5 (+1) | 1,203 (+14%) | 3mo | $318,000 | $264 | 29 |
| 3323 Fayetteville St Unit D | 0.74mi | 3/2.5 (+1) | 1,203 (+14%) | 3mo | $318,000 | $264 | 29 |
| 3323 Fayetteville St Unit B | 0.74mi | 3/2.5 (+1) | 1,207 (+14%) | 6mo | $359,900 | $298 | 27 |
| 3323 Fayetteville St Unit E | 0.74mi | 3/2.5 (+1) | 1,207 (+14%) | 6mo | $355,000 | $294 | 26 |
Match score weights: distance 35% · size 25% · config 20% · recency 20%. Top-matched comps best support the ARV.
Projected returns pro-forma
-3.0% appreciation · 0.95% rent growth · sell at horizon
- IRR
- -7.6%
- Equity multiple
- 0.72×
- Total profit
- $-12,361
- Equity at exit
- $23,857
- IRR
- -0.7%
- Equity multiple
- 0.96×
- Total profit
- $-1,897
- Equity at exit
- $13,834
Cash invested: $44,800 (down + closing). Projections, not guarantees.
Landlord ↔ Tenant lean methodology
- Overall (STATE)
- 85 Strongly Landlord-Friendly
- State North Carolina
- 85 Strongly Landlord-Friendly · R+3
- County
- — inherits STATE
- City
- — inherits STATE
ZIP-level market 27713
- Rents YoY
- 0.9%
- Active inventory
- 359
- Price-to-rent
- 8.4×
Monthly cashflow live
- Estimated rent
- $1,579 high interval (Pro) →
- Mortgage (P&I)
- −$839
- Tax from tax record
- −$78 /mo · $935/yr
- Insurance
- −$67
- HOA
- −$0
- Vacancy / Maint / Mgmt
- −$332
- Net cashflow
- $264
Break-even live
UW: 25.0% down · 7.5% · 30yr · 1.5% tax · 5.0% vac · 8.0% maint · 8.0% mgmt
Financing live
Cash to close
- Down payment
- $40,000
- Closing costs
- $4,800
- Reserves months
- —
- Total cash needed
- —
Loan-product check · same deal, 3 products live
Conventional
25% down · 7.5% · 30yr
- Down + closing
- —
- Monthly P&I
- —
- Monthly cashflow
- —
- DSCR
- —
- Eligible?
- —
Personal DTI + credit; lowest rate.
DSCR
20% down · 8.5% · 30yr
- Down + closing
- —
- Monthly P&I
- —
- Monthly cashflow
- —
- DSCR
- —
- Eligible?
- —
No personal income docs; deal must DSCR.
Hard money
10% down · 12.0% · 12mo
- Down + closing
- —
- Monthly P&I
- —
- Monthly cashflow
- —
- DSCR
- —
- Eligible?
- —
Short-term bridge; refi at stabilization.
Rent comps 21 comps
| Address | Beds | Baths | Sqft | Rent | $/sqft | DOM | Units | Dist |
|---|---|---|---|---|---|---|---|---|
| 1400 E Cornwallis Rd Durham, NC | 2.0–3.0 | 2.0–3.0 | 792 | $1,539 | $1.94 | 13d | 5 | 0.38mi |
| 3528 Arlington St Durham, NC | 3.0 | 1.5 | 1053 | $1,850 | $1.76 | 23d | 1 | 0.52mi |
| 2800 Bainbridge Dr Durham, NC | 1.0–2.0 | 1.0–2.0 | 990 | $1,340 | $1.35 | 13d | 15 | 0.81mi |
| 2911 Beechwood Dr Durham, NC | 3.0 | 1.5 | 1189 | $1,965 | $1.65 | 23d | 1 | 0.82mi |
| 1701 E Cornwallis Rd Durham, NC | 2.0–3.0 | 1.0–2.5 | 1125 | $1,056 | $0.94 | 13d | 14 | 0.86mi |
| 100 Lynn Forest Dr Durham, NC | 2.0–4.0 | 2.0 | 1140 | $1,280 | $1.12 | 13d | 6 | 0.90mi |
| 1619 Snowmass Way Durham, NC | 2.0 | 2.5 | 1280 | $1,725 | $1.35 | 23d | 1 | 0.98mi |
| 1326 Holly Grove Way Durham, NC | 2.0 | 2.5 | 1238 | $1,630 | $1.32 | 23d | 1 | 1.02mi |
| 3003 Courtney Creek Blvd Durham, NC | 2.0 | 2.5 | 1238 | $1,795 | $1.45 | 23d | 1 | 1.02mi |
| 901 Elmira Ave Durham, NC | 3.0 | 1.0 | 960 | $1,595 | $1.66 | 13d | 1 | 1.02mi |
| 827 Elmira Ave Durham, NC | 3.0 | 1.0 | 1218 | $1,630 | $1.34 | 23d | 1 | 1.04mi |
| 2850 Courtney Creek Blvd Durham, NC | 1.0–3.0 | 1.0–2.0 | 1116 | $1,430 | $1.28 | 13d | 19 | 1.06mi |
| 3417 Balfour W Durham, NC | 2.0 | 2.5 | 1162 | $1,495 | $1.29 | 13d | 1 | 1.06mi |
| 1504 Holly Grove Way Durham, NC | 3.0 | 2.5 | 1360 | $2,000 | $1.47 | 23d | 1 | 1.07mi |
| 412 E Pilot St Durham, NC | 1.0–2.0 | 1.0 | 643 | $1,075 | $1.67 | 23d | 6 | 1.12mi |
| 2727 Atlantic St Durham, NC | 3.0 | 1.0 | 1036 | $1,595 | $1.54 | 13d | 1 | 1.27mi |
| 10 Wiltshire Pl Durham, NC | 1.0 | 1.0 | 1483 | $585 | $0.39 | 23d | 1 | 1.27mi |
| 116 E Cornwallis Rd Durham, NC | 1.0 | 1.0 | 1013 | $600 | $0.59 | 23d | 1 | 1.33mi |
| 123 Archdale Dr Durham, NC | 1.0 | 1.0 | 1200 | $1,600 | $1.33 | 23d | 1 | 1.34mi |
| 405 Reynolds Ave Unit 1300723P Durham, NC | 3.0 | 2.0 | 1453 | $6,039 | $4.16 | 13d | 1 | 1.43mi |
| 10 Hartford Ct Durham, NC | 2.0 | 1.5 | 1000 | $1,500 | $1.50 | 23d | 1 | 1.48mi |
Listing history 3 events
-
2026-06-10status $160,000 Pending 1 DOM
-
2026-06-09remarks 451-char remark
-
2026-06-09$160,000 Active 1 DOM
ⓘ Source: listings_history table (triggers on properties + properties_extension) + one-shot
backfill from property_details.listing_events for pre-trigger history.
Tax reassessment forecast NC · Resets to sale price
- Current annual tax
- $935 · $78/mo
- Projected year-2 tax
- $1,312 · $109/mo
- Expected delta
- +$377/yr (+$31/mo · 40.4%)
ⓘ Screening estimate from a state-policy table — verify with the county assessor before closing.
Climate risk First Street
- Flood 1/10 Low FEMA zone X (unshaded) · 0% chance over 30 yrs
- Wildfire 1/10 Low
- Heat 6/10 Major 7 d/yr ≥106°F today · 16 d/yr by 30 yrs out
- Wind 6/10 Major 27% chance of damaging wind over 30 yrs
- Air quality 2/10 Low 1 unhealthy d/yr today · 1 by 30 yrs out
Nearby sold comps map
Loading sold comps map…
Walkable amenities ~0.75 mi
Loading nearby amenities…
Taxation est. · year 1
- Rental income
- $18,950
- − Mortgage interest
- −$8,962
- − Property taxes
- −$935
- − Insurance
- −$800
- − Repairs & maintenance
- −$1,516
- − Management
- −$1,516
- − Depreciation
- −$4,655
- Taxable income
- $566
- Est. tax owed @ 24.0%
- −$136
- After-tax cash flow
- $3,031/yr
For passive investors: Depreciation is non-cash, so a rental often shows a tax loss while cash-flowing — sheltering income. Rental losses are passive: they offset passive income freely, and up to $25,000/yr can offset ordinary (W-2) income if you actively participate and your MAGI is under $100k (phasing out to $0 by $150k); unused losses carry forward. On sale, claimed depreciation is recaptured at up to 25%, and gains may owe capital-gains tax (a 1031 exchange can defer both). Figures are a year-1 estimate at your 24.0% rate — not tax advice; consult a CPA.
Schools (NCES district)
- District
- Durham Public Schools
- NCES district ID
- 3701260
- Math proficiency
- 29% ▼ -3.00%
- Reading proficiency
- 39% ▲ 2.00%
- Median HH income
- $52,143
- Composite
- 29.69/100
- National rank
- #6457
- State rank
- #132 of 178 in NC
Livability — Durham
- Score
- 81/100
- State rank
- #15
- US rank
- #1411
Category grades
Schools grade is shown separately in the Schools card above.
Census & demographics
- Census place
- Durham, NC
- County
- Durham County · 288,747 people
- City population
- 288,747
- Metro
- Durham-Chapel Hill, NC
- Population (ZIP)
- 59,197
- Household income
- $100,676
- Rent vs Own
- Severe rent burden
- 2779.0
Population outlook (Durham County) Hauer SSP2
- Today (2025)
- 368,962 people
- By 2030
- 402,686 · +9.1%
- By 2040
- 468,677 · +27.0%
- By 2050
- 531,727 · +44.1%
- By 2075
- 660,446 · +79.0%
- By 2100
- 739,971 · +100.6%
Race, ethnicity, and origin ACS 2023
- Neighborhood character
- Diverse neighborhood (Simpson 0.68)
- Race & ethnicity
- White 42% Black 35% Hispanic / Latino 11% Two or more races 9% Asian 6%
- Hispanic origin (detail)
- Mexican 5% Puerto Rican 1%
- Common ancestry
- Slovak 2% Italian 2% Romanian 2%
- Foreign-born
- 14% · Canada, China, Jamaica
- Languages at home
- 82% English-only · Spanish 9% Chinese 2% Other Indo-European 2%
Political lean MEDSL · Durham
- 2024 margin
- Solid D (+61.9) · D 80.2% · R 18.2% · Other 1.6%
- 2008→2024 swing
- +10.0pp toward D · 2008: 51.9pp · 2024: 61.9pp
- All cycles
- 2024: D+61.9 2020: D+62.4 2016: D+60.4 2012: D+52.7 2008: D+51.9
Not yet ingested
- Civics
- —
Market trends
- HPI YoY
- ▼ -131.99%
- Current HPI
- 240.5548
- Rent YoY
- ▲ 0.95%
- Metro
- Durham-Chapel Hill, NC
- State GDP YoY
- ▲ 3.28%
- F500 in state
- 26
Industry mix (Fortune 500 HQ in NC)
| Industry | F500 HQs | Revenue |
|---|---|---|
| Financial Services | 2 | $213B |
|
||
| Retail | 2 | $95B |
|
||
| Industrial Conglomerate | 1 | $38B |
|
||
| Metals / Steel | 1 | $35B |
|
||
| Utilities | 1 | $30B |
|
||
| Industrial Machinery | 1 | $19B |
|
||
Price history
+68.4% since first listed8 events — show timeline
- 2026-06-09 Listed $160,000 TMLS
- 2026-01-27 Sold (Public Records) $118,000 Public Records
- 2009-03-03 Sold (Public Records) $56,500 Public Records
- 2008-01-05 Listing Removed — TMLS
- 2007-07-30 Listed $79,900 TMLS
- 2007-02-16 Listed $79,900 TMLS
- 2007-02-10 Listing Removed — TMLS
- 2006-08-17 Listed $95,000 TMLS
Property tax history
-0.7%/yrLatest (2025): $935 · +4.1% YoY. Source: county tax records.
Cash-flow waterfall
monthlySold comps — $/sqft
last 12 mo · ≤1 miLoading sold comps…