None · Glenwood, IL
Flood risk No data
- FEMA flood zone
- —
- Chance of flooding over 30 yrs
- —
- Est. flood insurance / yr
- —
Fire risk No data
- Est. fire insurance / yr
- —
Heat risk No data
- Hot days now (above threshold)
- —
- Hot days in 30 yrs
- —
Wind risk No data
- Chance of severe wind over 30 yrs
- —
Air-quality risk No data
- Unhealthy air days now
- —
- Unhealthy air days in 30 yrs
- —
Risk factors via First Street. Map © Google.
Why this score? — see what drove the C+ grade
The composite is a weighted blend of 9 inputs, each scored 0–100. Each bar is that input's sub-score; the figure is the points it added to the 100-point composite (weight × sub-score).
- Cash flow +26.9/30.0
- ARV discount +10.6/15.0
- DSCR +9.3/10.0
- 1% rule +7.2/10.0
- Livability +3.3/5.0
- Rent growth +2.5/5.0
- Condition / age +2.5/5.0
- Schools +0.7/10.0
- Appreciation +0.0/10.0
$188,000
🖨 Deal sheet (PDF) 📄 Offer letter ✓ Due diligence
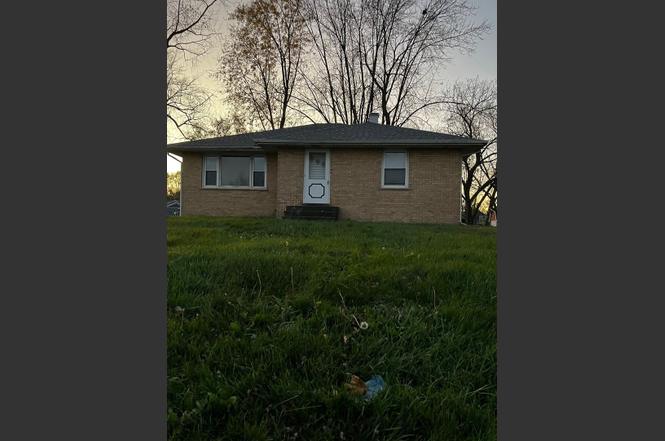
Listing remarks
Welcome to this charming home in the heart of Glenwood, Illinois, offering a fantastic opportunity for those looking for a property with unlimited potential! This home is being sold as-is and has been partially updated to provide a solid foundation for your personal touch and creativity. The interior boasts spacious rooms filled with natural light, perfect for both relaxation and entertaining. With recent updates, including insert fresh paint and bathroom updates this home is ready to meet modern living needs while maintaining its classic appeal. Large backyard with potential for landscaping, gardening, or outdoor entertaining, sprawling basement and cozy interior. The as-is nature of the p
Key facts
- Garage
- Built 1959
Property features AI
Exterior
- Parking: Includes a garage
- Home design: Single family home
Interior
- Bedrooms: 3 bedrooms
- Bathrooms: 1.5 bathrooms
- Interior features: Central air conditioning
Neighborhood map
What this means for you Summary
Snapshot
- This is a 3-bed/1.5-bath single-family listed at $188k.
Deal economics
- At list price, monthly cash flow is $518 ($6k/yr) — positive.
- The deal already cash-flows at list — no discount required.
- Meets the 1% rule at list price ($2k rent vs $188k).
- Recommended offer: $171k (9.0% below list) — sets the bar for market timing.
- Cap rate 9.6% vs local median 8.0% in Glenwood — meaningfully above typical; check what's discounted (condition, days-on-market, listing class) to confirm the premium yield is real.
Location & tenants
- Location reads 66/100 on livability (#545 in IL) — a middle-class / working-renter tenant base. Strengths: cost of living A+, housing A+, employment B; Watch: health & safety D+, schools F, amenities F.
- Bloom Twp Hsd 206 (suburban): math 8% / reading 9% proficiency, ranked #591 of 620 in IL (top 95%) — low school quality limits family demand, transient renter base, plan for 1-2y turnover.
- Market conditions: 54 active listings in the ZIP; 2 comparable units currently listed for rent nearby; 6,272 units permitted in Cook County in 2024 (4,658 in 5+ unit buildings).
Forward outlook
- Local home prices are declining (-3.0%/yr); year-one equity from $1k of loan paydown is wiped out by about $6k of value loss. Plan a longer hold.
- At projected returns (-3.0% appreciation + 3.0% rent growth), your $53k cash investment doubles in ~10 years — after that, you're playing with house money.
Negotiation context
- It's been on market 97 days — a 9% lower offer ($171k) is reasonable based on typical stale-listing flexibility.
Risks & watch-outs
- Watch-outs: built in 1959 — expect roof / HVAC / electrical / plumbing capex.
Questions for the listing agent
- It's been on market 97 days. Have you received any prior offers? Is the seller open to a 9% concession, seller financing, or rate buy-down credit?
- Built in 1959 — when were the roof, HVAC, electrical panel, plumbing, and water heater last replaced?
- Why hasn't it sold? Are there any deal-killer items the seller is aware of (foundation, flood, title, zoning, code violations)?
- Is there a deadline driving the sale (1031 exchange, divorce, estate, relocation)? That informs how much negotiation room exists.
- Schools are F-rated, which usually means shorter tenancies and higher turnover. Who's the typical renter profile here, and what's been the actual vacancy rate?
- What's the average days-on-market for RENTAL listings here right now (not sales)? A rising rental-DOM trend means longer vacancies and softer asking-rent achievability than the comps imply.
- What's the recent tenant-quality profile in this submarket — average credit score on applications, eviction rate, late-payment / NSF rate, and stable-employment percentage? A property-management company in the area should have these aggregated.
- How much new for-sale + rental construction is in the pipeline within 1–3 miles? Heavy new supply typically softens prices + rents 12–24 months out; constrained supply supports both.
Investment metrics
- 1% rule
- 1.22% ✓
- Cap rate
- 9.60%
- Cash-on-cash
- 11.80%
- DSCR
- 1.53
- GRM
- 6.8
CMA / ARV
- ARV (on-the-fly)
- $202,120
- Comps found
- 12
Show comp detail 12 sales within ~0.75 mi
| Address | Dist | Beds/Ba | Sqft | Sold | Price | $/sf | Match |
|---|---|---|---|---|---|---|---|
| 424 E Clark St | 0.10mi | 3/2.0 | 1,276 (+3%) | 4mo | $240,000 | $188 | 85 |
| 243 S Walnut St | 0.19mi | 3/1.5 | 1,300 (+5%) | 9mo | $265,000 | $204 | 76 |
| 110 S Willow Ln | 0.17mi | 3/1.0 | 1,179 (-5%) | 10mo | $175,000 | $148 | 73 |
| 202 E Rose St | 0.35mi | 2/1.5 (-1) | 1,313 (+6%) | 1mo | $137,000 | $104 | 68 |
| 110 E Main St | 0.42mi | 3/1.0 | 1,276 (+3%) | 12mo | $140,000 | $110 | 64 |
| 34 S Chestnut Ct | 0.26mi | 3/1.5 | 1,067 (-14%) | 2mo | $189,900 | $178 | 63 |
| 41 S Walnut Ln | 0.26mi | 3/1.0 | 1,350 (+9%) | 10mo | $177,500 | $131 | 63 |
| 710 E 194th St | 0.43mi | 3/2.0 | 1,164 (-6%) | 8mo | $271,000 | $233 | 61 |
| 19 N Elm Ln | 0.44mi | 4/2.0 (+1) | 1,258 (+2%) | 13mo | $205,000 | $163 | 59 |
| 32 E Center St | 0.56mi | 2/1.0 (-1) | 1,184 (-4%) | 13mo | $119,900 | $101 | 48 |
| 301 E Maple Dr | 0.57mi | 3/1.5 | 1,067 (-14%) | 13mo | $206,000 | $193 | 40 |
| 22 W Main St | 0.66mi | 3/2.0 | 1,416 (+14%) | 9mo | $212,000 | $150 | 36 |
Match score weights: distance 35% · size 25% · config 20% · recency 20%. Top-matched comps best support the ARV.
Projected returns pro-forma
-3.0% appreciation · 3.0% rent growth · sell at horizon
- IRR
- 1.3%
- Equity multiple
- 1.05×
- Total profit
- $2,548
- Equity at exit
- $28,031
- IRR
- 10.9%
- Equity multiple
- 1.85×
- Total profit
- $44,823
- Equity at exit
- $16,255
Cash invested: $52,640 (down + closing). Projections, not guarantees.
Landlord ↔ Tenant lean methodology
- Overall (STATE)
- 43 Moderately Tenant-Leaning
- State Illinois
- 43 Moderately Tenant-Leaning · D+7
- County
- — inherits STATE
- City
- — inherits STATE
ZIP-level market 60425
- Home prices YoY
- -10.6%
- Active inventory
- 54
- Price-to-rent
- 6.8×
Monthly cashflow live
- Estimated rent
- $2,300 medium interval (Pro) →
- Mortgage (P&I)
- −$986
- Tax est. 1.5%
- −$235 /mo · $2,820/yr
- Insurance
- −$78
- HOA
- −$0
- Vacancy / Maint / Mgmt
- −$483
- Net cashflow
- $518
Break-even live
Sensitivity live
| Price | -10% $648 | -5% $583 | +0% $518 | +5% $453 | +10% $388 |
|---|---|---|---|---|---|
| Rent | -10% $336 | -5% $427 | +0% $518 | +5% $609 | +10% $699 |
| Rate | -1.0pp $612 | -0.5pp $566 | base $518 | +0.5pp $469 | +1.0pp $419 |
UW: 25.0% down · 7.5% · 30yr · 1.5% tax · 5.0% vac · 8.0% maint · 8.0% mgmt
Financing live
Cash to close
- Down payment
- $47,000
- Closing costs
- $5,640
- Reserves months
- —
- Total cash needed
- —
Loan-product check · same deal, 3 products live
Conventional
25% down · 7.5% · 30yr
- Down + closing
- —
- Monthly P&I
- —
- Monthly cashflow
- —
- DSCR
- —
- Eligible?
- —
Personal DTI + credit; lowest rate.
DSCR
20% down · 8.5% · 30yr
- Down + closing
- —
- Monthly P&I
- —
- Monthly cashflow
- —
- DSCR
- —
- Eligible?
- —
No personal income docs; deal must DSCR.
Hard money
10% down · 12.0% · 12mo
- Down + closing
- —
- Monthly P&I
- —
- Monthly cashflow
- —
- DSCR
- —
- Eligible?
- —
Short-term bridge; refi at stabilization.
Rent comps 2 comps
| Address | Beds | Baths | Sqft | Rent | $/sqft | DOM | Units | Dist |
|---|---|---|---|---|---|---|---|---|
| 105 S Sycamore Ln Glenwood, IL | 3.0 | 1.5 | 1201 | $2,300 | $1.92 | 0d | 1 | 0.18mi |
| 105 S Sycamore Ln Glenwood, IL | 3.0 | 1.5 | 1201 | $2,300 | $1.92 | 2d | 1 | 0.18mi |
Listing history 15 events
-
2026-06-21days on market $188,000 Coming Soon 97 DOM
-
2026-06-18days on market $188,000 Coming Soon 94 DOM
-
2026-06-17days on market $188,000 Coming Soon 93 DOM
-
2026-06-16days on market $188,000 Coming Soon 92 DOM
-
2026-06-15days on market $188,000 Coming Soon 91 DOM
-
2026-06-13days on market $188,000 Coming Soon 89 DOM
-
2026-06-13days on market $188,000 Coming Soon 88 DOM
-
2026-06-09days on market $188,000 Coming Soon 85 DOM
-
2026-06-08days on market $188,000 Coming Soon 84 DOM
-
2026-06-07days on market $188,000 Coming Soon 83 DOM
-
2026-06-04days on market $188,000 Coming Soon 80 DOM
-
2026-06-03days on market $188,000 Coming Soon 79 DOM
-
2026-06-02days on market $188,000 Coming Soon 78 DOM
-
2026-06-01days on market $188,000 Coming Soon 77 DOM
-
2026-05-31days on market $188,000 Coming Soon 76 DOM
ⓘ Source: listings_history table (triggers on properties + properties_extension) + one-shot
backfill from property_details.listing_events for pre-trigger history.
Nearby sold comps map
Loading sold comps map…
Walkable amenities ~0.75 mi
Loading nearby amenities…
Taxation est. · year 1
- Rental income
- $27,600
- − Mortgage interest
- −$10,531
- − Property taxes
- −$2,820
- − Insurance
- −$940
- − Repairs & maintenance
- −$2,208
- − Management
- −$2,208
- − Depreciation
- −$5,469
- Taxable income
- $3,424
- Est. tax owed @ 24.0%
- −$822
- After-tax cash flow
- $5,392/yr
For passive investors: Depreciation is non-cash, so a rental often shows a tax loss while cash-flowing — sheltering income. Rental losses are passive: they offset passive income freely, and up to $25,000/yr can offset ordinary (W-2) income if you actively participate and your MAGI is under $100k (phasing out to $0 by $150k); unused losses carry forward. On sale, claimed depreciation is recaptured at up to 25%, and gains may owe capital-gains tax (a 1031 exchange can defer both). Figures are a year-1 estimate at your 24.0% rate — not tax advice; consult a CPA.
Schools (NCES district)
- District
- Bloom Twp Hsd 206
- NCES district ID
- 1706420
- Math proficiency
- 8% ▼ -3.00%
- Reading proficiency
- 9% ▼ -8.00%
- Median HH income
- $39,795
- Composite
- 7.4/100
- National rank
- #9952
- State rank
- #591 of 620 in IL
Livability — Glenwood
- Score
- 66/100
- State rank
- #545
- US rank
- #11292
Category grades
Schools grade is shown separately in the Schools card above.
Census & demographics
- Census place
- Glenwood, IL
- City population
- 8,730
- Population (ZIP)
- 8,730
Population outlook (Cook County) Hauer SSP2
- Today (2025)
- 5,347,519 people
- By 2030
- 5,357,703 · +0.2%
- By 2040
- 5,324,924 · -0.4%
- By 2050
- 5,230,762 · -2.2%
- By 2075
- 4,785,735 · -10.5%
- By 2100
- 4,188,836 · -21.7%
Race, ethnicity, and origin ACS 2023
- Neighborhood character
- Predominantly Black (68%)
- Race & ethnicity
- Black 68% White 22% Hispanic / Latino 6% Two or more races 4%
- Hispanic origin (detail)
- Mexican 5%
- Common ancestry
- Romanian 3% Iranian 1% Lithuanian 1%
- Foreign-born
- 3% · Canada
- Languages at home
- 95% English-only · Spanish 4%
Political lean MEDSL · Cook
- 2024 margin
- Solid D (+42.0) · D 70.4% · R 28.4% · Other 1.2%
- 2008→2024 swing
- -11.4pp toward R · 2008: 53.4pp · 2024: 42.0pp
- All cycles
- 2024: D+42.0 2020: D+50.3 2016: D+53.0 2012: D+49.4 2008: D+53.4
Not yet ingested
- Civics
- —
Market trends
- HPI YoY
- ▼ -37.24%
- Current HPI
- 314.1777
- Rent YoY
- —
- Metro
- —
- State GDP YoY
- ▲ 1.59%
- F500 in state
- 60
Industry mix (Fortune 500 HQ in IL)
| Industry | F500 HQs | Revenue |
|---|---|---|
| Insurance | 4 | $201B |
|
||
| Consumer Goods | 4 | $87B |
|
||
| Industrial Machinery | 3 | $64B |
|
||
| Healthcare | 2 | $55B |
|
||
| Retail / Pharmacy | 1 | $148B |
|
||
| Agriculture / Food | 1 | $86B |
|
||
Cash-flow waterfall
monthlySold comps — $/sqft
last 12 mo · ≤1 miLoading sold comps…