 🏷️ Likely Rental
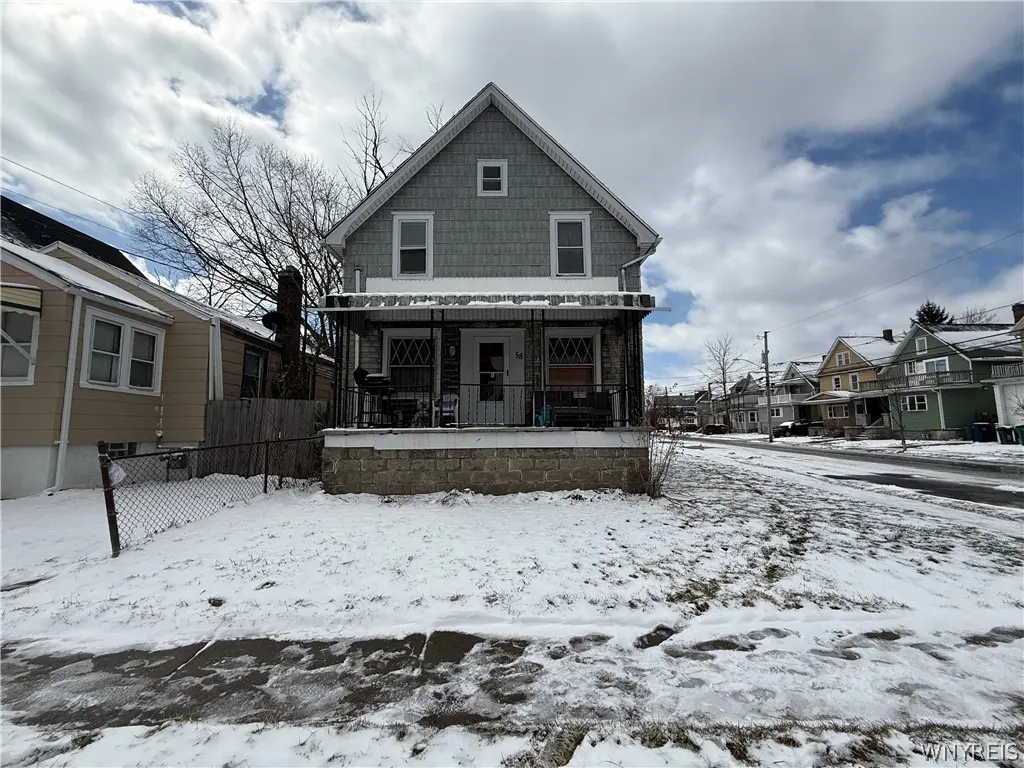
58 Eckhert St · Buffalo, NY
Flood risk 1/10 · Minimal
- FEMA flood zone
- X (unshaded)
- Chance of flooding over 30 yrs
- 0.0%
- Est. flood insurance / yr
- $473 – $860
Fire risk 1/10 · Minimal
- Est. fire insurance / yr
- $691 – $1,283
Heat risk 3/10 · Minor
- Hot days now (above 93°F)
- 7 days/yr
- Hot days in 30 yrs
- 15 days/yr
Wind risk 1/10 · Minimal
- Chance of severe wind over 30 yrs
- —
Air-quality risk 3/10 · Minor
- Unhealthy air days now
- 3 days/yr
- Unhealthy air days in 30 yrs
- 4 days/yr
Risk factors via First Street. Map © Google.
Why this score? — see what drove the C grade
The composite is a weighted blend of 9 inputs, each scored 0–100. Each bar is that input's sub-score; the figure is the points it added to the 100-point composite (weight × sub-score).
- Cash flow +20.2/30.0
- ARV discount +15.0/15.0
- DSCR +6.4/10.0
- Rent growth +4.5/5.0
- 1% rule +4.0/10.0
- Livability +3.9/5.0
- Schools +3.3/10.0
- Condition / age +2.5/5.0
- Appreciation +0.0/10.0
$144,900
🖨 Deal sheet 📄 Offer letter ✓ Due diligence
Multi-family units
County records classify this as Multi-Family (2-4 Unit). Listing-text estimate: 1 unit. estimate disagrees with records
Listing remarks MLS
Welcome to 58 Eckhert St, a spacious single-family home situated on a desirable corner lot, offering 4 bedrooms and 2 full baths—perfect for both owner-occupants and investors alike! Currently rented for $1,370 per month, this property presents an excellent opportunity for immediate cash flow or future owner occupancy. The home features a functional layout with generously sized bedrooms, a full basement providing ample storage or potential additional living space, and off-street parking for added convenience. The corner lot offers added privacy and extra outdoor space. Conveniently located near public transportation, shopping, restaurants, and everyday amenities, making it an attractive option for tenants and homeowners alike. Whether you’re looking to expand your investment portfolio or secure a home with income potential
Key facts
- Full basement
- Outdoor space
- Off-street parking
Tags
Neighborhood map
What this means for you Summary
Snapshot
- This is a 2-bed/2.0-bath multifamily listed at $145k.
Deal economics
- At list price, monthly cash flow is $183 ($2k/yr) — positive.
- The deal already cash-flows at list — no discount required.
- To meet the 1% rule (rent ≥ 1% of price), the offer needs to be $130k (10.1% below list).
- Recommended offer: $130k (10.1% below list) — sets the bar for 1% rule.
Location & tenants
- Location reads 77/100 on livability (#195 in NY, #3,011 nationally) — a middle-class / working-renter tenant base. Strengths: commute A+, housing A+, health & safety A+; Watch: crime F, employment D-.
- Buffalo City School District (urban): math 41% / reading 40% proficiency, ranked #535 of 590 in NY (top 91%) — families likely to look elsewhere, expect single-tenant / working-renter base with shorter leases; 75% free/reduced lunch — lower-income household profile, screen leases tightly.
- Market conditions: Rents rising fast (+8.2%/yr); 197 active listings in the ZIP; 5 comparable units currently listed for rent nearby; rentals at typical pace (median 22d on market — plan ~3-4 weeks tenant-placement turnaround); lower-income renter base — watch delinquency; 1,244 units permitted in Erie County in 2024 (563 in 5+ unit buildings).
- This rent runs 39% of the median local income ($40k/yr) — at the standard rent-burdened threshold; future hikes will face affordability resistance.
Forward outlook
- Local home prices are declining (-3.0%/yr); year-one equity from $1k of loan paydown is wiped out by about $4k of value loss. Plan a longer hold.
- At projected returns (-3.0% appreciation + 8.0% rent growth), your $41k cash investment doubles in ~10 years — after that, you're playing with house money.
Negotiation context
- It's been on market 80 days — a 6% lower offer ($136k) is reasonable based on typical stale-listing flexibility.
- 2 sale attempts since 16y ago; this cycle's ask has dropped $10k (6%) from the opening price — seller is motivated, your offer sets the floor, not the list.
- Current owner paid $21k; list at $145k implies a 590% gain — meaningful room to come down on a strong offer.
Risks & watch-outs
- Watch-outs: built in 1910 — expect roof / HVAC / electrical / plumbing capex.
Questions for the listing agent
- It's been on market 80 days. Have you received any prior offers? Is the seller open to a 10% concession, seller financing, or rate buy-down credit?
- Built in 1910 — when were the roof, HVAC, electrical panel, plumbing, and water heater last replaced?
- Why hasn't it sold? Are there any deal-killer items the seller is aware of (foundation, flood, title, zoning, code violations)?
- Is there a deadline driving the sale (1031 exchange, divorce, estate, relocation)? That informs how much negotiation room exists.
- Crime grade is F in this area — have there been break-ins, vandalism, or insurance claims at this property in the last 3 years? What carrier currently insures it and at what premium?
- What's the average days-on-market for RENTAL listings here right now (not sales)? A rising rental-DOM trend means longer vacancies and softer asking-rent achievability than the comps imply.
- What's the recent tenant-quality profile in this submarket — average credit score on applications, eviction rate, late-payment / NSF rate, and stable-employment percentage? A property-management company in the area should have these aggregated.
- How much new apartment / multifamily construction is in the pipeline within 1–3 miles? Heavy new supply (>2% of stock underway) typically softens rents 12–24 months out; light construction supports rent growth.
Investment metrics
- 1% rule
- 0.90% ✗
- Cap rate
- 7.81%
- Cash-on-cash
- 5.43%
- DSCR
- 1.24
- GRM
- 9.3
CMA / ARV
- ARV (median comp)
- $213,071
- List price
- $144,900
- Delta
- -31.99%
- Verdict
- UNDERPRICED
- Comps
- 20 within 1.0 mi
Show comp detail 3 sales within ~0.75 mi
| Address | Dist | Beds/Ba | Sqft | Sold | Price | $/sf | Match |
|---|---|---|---|---|---|---|---|
| 31 Philadelphia St | 0.28mi | 3/2.0 (+1) | 1,628 (-3%) | 15mo | $220,000 | $135 | 65 |
| 315 Roesch Ave | 0.37mi | 3/2.0 (+1) | 1,498 (-11%) | 6mo | $167,000 | $111 | 55 |
| 227 Crowley Ave | 0.41mi | 3/2.0 (+1) | 1,909 (+14%) | 6mo | $155,000 | $81 | 48 |
Match score weights: distance 35% · size 25% · config 20% · recency 20%. Top-matched comps best support the ARV.
Projected returns pro-forma
-3.0% appreciation · 8.0% rent growth · sell at horizon
- IRR
- -3.1%
- Equity multiple
- 0.88×
- Total profit
- $-4,987
- Equity at exit
- $21,605
- IRR
- 11.0%
- Equity multiple
- 2.03×
- Total profit
- $41,735
- Equity at exit
- $12,528
Cash invested: $40,572 (down + closing). Projections, not guarantees.
Landlord ↔ Tenant lean methodology
- Overall (STATE)
- 15 Strongly Tenant-Friendly
- State New York
- 15 Strongly Tenant-Friendly · D+10
- County
- — inherits STATE
- City
- — inherits STATE
ZIP-level market 14207
- Home prices YoY
- -18.9%
- Rents YoY
- 8.2%
- Active inventory
- 197
- Price-to-rent
- 9.3×
Monthly cashflow live
- Estimated rent
- $1,303 medium interval (Pro) →
- Mortgage (P&I)
- −$760
- Tax from tax record
- −$26 /mo · $308/yr
- Insurance
- −$60
- HOA
- −$0
- Vacancy / Maint / Mgmt
- −$274
- Net cashflow
- $183
Break-even live
Sensitivity live
| Price | -10% $265 | -5% $224 | +0% $183 | +5% $142 | +10% $-72 |
|---|---|---|---|---|---|
| Rent | -10% $80 | -5% $132 | +0% $183 | +5% $235 | +10% $286 |
| Rate | -1.0pp $256 | -0.5pp $220 | base $183 | +0.5pp $146 | +1.0pp $108 |
UW: 25.0% down · 7.5% · 30yr · 1.5% tax · 5.0% vac · 8.0% maint · 8.0% mgmt
Financing live
Cash to close
- Down payment
- $36,225
- Closing costs
- $4,347
- Reserves months
- —
- Total cash needed
- —
Loan-product check · same deal, 3 products live
Conventional
25% down · 7.5% · 30yr
- Down + closing
- —
- Monthly P&I
- —
- Monthly cashflow
- —
- DSCR
- —
- Eligible?
- —
Personal DTI + credit; lowest rate.
DSCR
20% down · 8.5% · 30yr
- Down + closing
- —
- Monthly P&I
- —
- Monthly cashflow
- —
- DSCR
- —
- Eligible?
- —
No personal income docs; deal must DSCR.
Hard money
10% down · 12.0% · 12mo
- Down + closing
- —
- Monthly P&I
- —
- Monthly cashflow
- —
- DSCR
- —
- Eligible?
- —
Short-term bridge; refi at stabilization.
Rent comps 5 comps
| Address | Beds | Baths | Sqft | Rent | $/sqft | DOM | Units | Dist |
|---|---|---|---|---|---|---|---|---|
| 61 Baxter St Buffalo, NY | 3.0 | 1.0 | 2014 | $1,400 | $0.70 | 2d | 1 | 0.10mi |
| 118 Rano St Buffalo, NY | 3.0 | 1.0 | 1050 | $1,200 | $1.14 | 21d | 1 | 0.79mi |
| 27 Garfield St Buffalo, NY | 1.0 | 1.0 | 1850 | $1,200 | $0.65 | 44d | 1 | 1.11mi |
| 52 Greeley St Unit Upper Buffalo, NY | 2.0 | 1.0 | 1804 | $1,000 | $0.55 | 24d | 1 | 1.32mi |
| 172 Tremont Ave Kenmore, NY | 3.0 | 1.5 | 1569 | $2,500 | $1.59 | 11d | 1 | 1.50mi |
Listing history 20 events
-
2026-06-18days on market $144,900 Active 80 DOM
-
2026-06-17days on market $144,900 Active 79 DOM
-
2026-06-16days on market $144,900 Active 78 DOM
-
2026-06-15days on market $144,900 Active 77 DOM
-
2026-06-13days on market $144,900 Active 75 DOM
-
2026-06-13days on market $144,900 Active 74 DOM
-
2026-06-10days on market $144,900 Active 72 DOM
-
2026-06-09days on market $144,900 Active 71 DOM
-
2026-06-08days on market $144,900 Active 70 DOM
-
2026-06-07pricedays on market $144,900 Active 69 DOM
-
2026-06-03days on market $154,400 Active 65 DOM
-
2026-06-02days on market $154,400 Active 64 DOM
-
2026-06-01days on market $154,400 Active 63 DOM
-
2026-05-31days on market $154,400 Active 62 DOM
-
2026-04-17price $154,400 846-char remark
Show marketing remark (846 chars)
Welcome to 58 Eckhert St, a spacious single-family home situated on a desirable corner lot, offering 4 bedrooms and 2 full baths—perfect for both owner-occupants and investors alike! Currently rented for $1,370 per month, this property presents an excellent opportunity for immediate cash flow or future owner occupancy. The home features a functional layout with generously sized bedrooms, a full basement providing ample storage or potential additional living space, and off-street parking for added convenience. The corner lot offers added privacy and extra outdoor space. Conveniently located near public transportation, shopping, restaurants, and everyday amenities, making it an attractive option for tenants and homeowners alike. Whether you’re looking to expand your investment portfolio or secure a home with income potential
-
2026-03-30$154,900 Active 846-char remark
Show marketing remark (846 chars)
Welcome to 58 Eckhert St, a spacious single-family home situated on a desirable corner lot, offering 4 bedrooms and 2 full baths—perfect for both owner-occupants and investors alike! Currently rented for $1,370 per month, this property presents an excellent opportunity for immediate cash flow or future owner occupancy. The home features a functional layout with generously sized bedrooms, a full basement providing ample storage or potential additional living space, and off-street parking for added convenience. The corner lot offers added privacy and extra outdoor space. Conveniently located near public transportation, shopping, restaurants, and everyday amenities, making it an attractive option for tenants and homeowners alike. Whether you’re looking to expand your investment portfolio or secure a home with income potential
-
2010-09-28soldstatus $21,000
-
2010-09-15soldstatus $21,000 342-char remark
Show marketing remark (342 chars)
large home with four bedrooms. new boiler of 3 yrs, updated electric. off street parking, full front porch, 2 full baths. full basement. built-ins in dining room, artificial fireplace in living room. long term tenant pays $500 a month and would like to stay. Rent could be higher. owner very anxious and will listen to all reasonable offers.
-
2010-08-02$24,900 342-char remark
Show marketing remark (342 chars)
large home with four bedrooms. new boiler of 3 yrs, updated electric. off street parking, full front porch, 2 full baths. full basement. built-ins in dining room, artificial fireplace in living room. long term tenant pays $500 a month and would like to stay. Rent could be higher. owner very anxious and will listen to all reasonable offers.
-
2005-11-03soldstatus $26,000
ⓘ Source: listings_history table (triggers on properties + properties_extension) + one-shot
backfill from property_details.listing_events for pre-trigger history.
Tax reassessment forecast NY · Partial reset (capped growth)
- Current annual tax
- $308 · $26/mo
- Projected year-2 tax
- $1,379 · $115/mo
- Expected delta
- +$1,070/yr (+$89/mo · 347.2%)
ⓘ Screening estimate from a state-policy table — verify with the county assessor before closing.
Climate risk First Street
- Flood 1/10 Low FEMA zone X (unshaded) · 0% chance over 30 yrs
- Wildfire 1/10 Low
- Heat 3/10 Moderate 7 d/yr ≥93°F today · 15 d/yr by 30 yrs out
- Wind 1/10 Low
- Air quality 3/10 Moderate 3 unhealthy d/yr today · 4 by 30 yrs out
Nearby sold comps map
Loading sold comps map…
Walkable amenities ~0.75 mi
Loading nearby amenities…
Taxation est. · year 1
- Rental income
- $15,636
- − Mortgage interest
- −$8,117
- − Property taxes
- −$308
- − Insurance
- −$724
- − Repairs & maintenance
- −$1,251
- − Management
- −$1,251
- − Depreciation
- −$4,215
- Taxable loss
- −$230
- Est. tax savings @ 24.0%
- +$55
- After-tax cash flow
- $2,257/yr
For passive investors: Depreciation is non-cash, so a rental often shows a tax loss while cash-flowing — sheltering income. Rental losses are passive: they offset passive income freely, and up to $25,000/yr can offset ordinary (W-2) income if you actively participate and your MAGI is under $100k (phasing out to $0 by $150k); unused losses carry forward. On sale, claimed depreciation is recaptured at up to 25%, and gains may owe capital-gains tax (a 1031 exchange can defer both). Figures are a year-1 estimate at your 24.0% rate — not tax advice; consult a CPA.
Schools (NCES district)
- District
- Buffalo City School District
- NCES district ID
- 3605850
- Math proficiency
- 41% ▲ 11.00%
- Reading proficiency
- 40% ▲ 7.00%
- Median HH income
- $31,665
- Composite
- 33.17/100
- National rank
- #5544
- State rank
- #535 of 590 in NY
Livability — Buffalo
- Score
- 77/100
- State rank
- #195
- US rank
- #3011
Category grades
Schools grade is shown separately in the Schools card above.
Census & demographics
- Census place
- Buffalo, NY
- County
- Erie County · 714,559 people
- City population
- 440,021
- Metro
- Buffalo-Cheektowaga, NY
- Population (ZIP)
- 26,327
- Household income
- $39,753
- Rent vs Own
- Severe rent burden
- 2177.0
Population outlook (Erie County) Hauer SSP2
- Today (2025)
- 933,037 people
- By 2030
- 935,181 · +0.2%
- By 2040
- 928,531 · -0.5%
- By 2050
- 905,725 · -2.9%
- By 2075
- 834,037 · -10.6%
- By 2100
- 708,033 · -24.1%
Race, ethnicity, and origin ACS 2023
- Neighborhood character
- Highly diverse neighborhood (Simpson 0.74)
- Race & ethnicity
- White 40% Hispanic / Latino 23% Black 16% Asian 15% Two or more races 14%
- Hispanic origin (detail)
- Puerto Rican 18% Dominican 2%
- Common ancestry
- Romanian 8% Portuguese 1% Arab 1%
- Foreign-born
- 19% · Philippines, Canada, India
- Languages at home
- 65% English-only · Spanish 14% Other Asian/Pacific 10% Other Indo-European 5%
Political lean MEDSL · Erie
- 2024 margin
- Lean D (+9.7) · D 54.8% · R 45.2%
- 2008→2024 swing
- -7.9pp toward R · 2008: 17.5pp · 2024: 9.7pp
- All cycles
- 2024: D+9.7 2020: D+14.7 2016: D+4.8 2012: D+15.6 2008: D+17.5
Not yet ingested
- Civics
- —
Market trends
- HPI YoY
- ▼ -54.42%
- Current HPI
- 233.0902
- Rent YoY
- ▲ 8.19%
- Metro
- Buffalo-Cheektowaga, NY
- State GDP YoY
- ▲ 2.60%
- F500 in state
- 92
Industry mix (Fortune 500 HQ in NY)
| Industry | F500 HQs | Revenue |
|---|---|---|
| Financial Services | 10 | $950B |
|
||
| Consumer Goods | 9 | $162B |
|
||
| Insurance | 4 | $225B |
|
||
| Telecommunications | 2 | $144B |
|
||
| Pharmaceuticals | 2 | $112B |
|
||
| Media / Entertainment | 2 | $69B |
|
||
Price history
+493.8% since first listed6 events — show timeline
- 2026-04-17 Price Changed $154,400 WNYREIS
- 2026-03-30 Listed $154,900 WNYREIS
- 2010-09-28 Sold (Public Records) $21,000 Public Records
- 2010-09-15 Sold (MLS) $21,000 WNYREIS
- 2010-08-02 Listed $24,900 WNYREIS
- 2005-11-03 Sold (Public Records) $26,000 Public Records
Property tax history
+2.1%/yrLatest (2025): $308 · +0.0% YoY. Source: county tax records.
Cash-flow waterfall
monthlySold comps — $/sqft
last 12 mo · ≤1 miLoading sold comps…