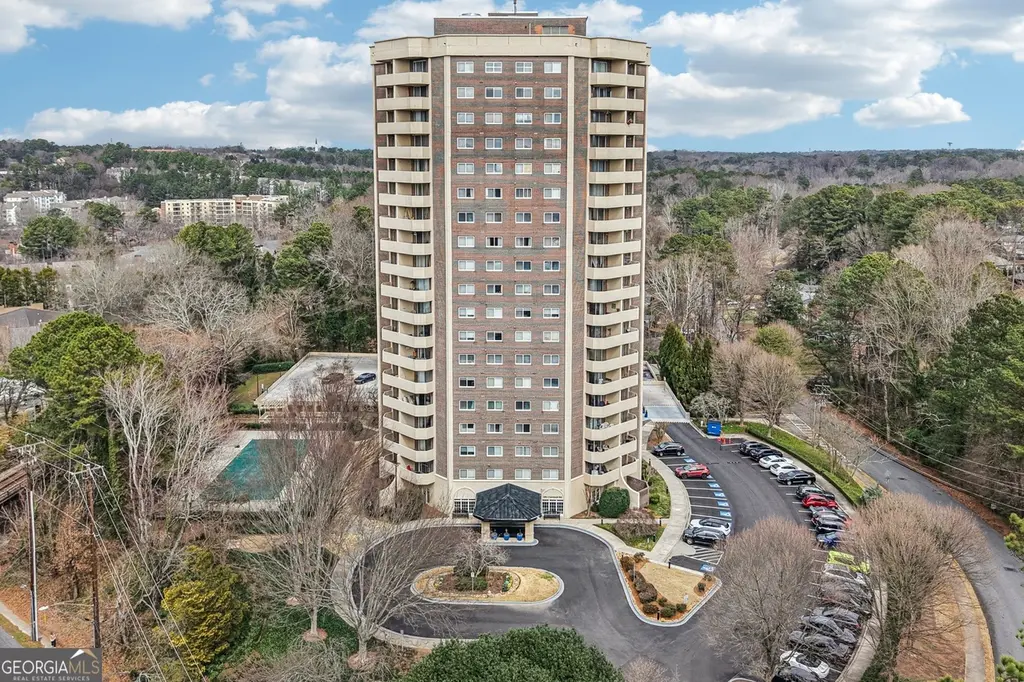
1501 Clairmont Rd · North Decatur, GA
Flood risk 6/10 · Moderate
- FEMA flood zone
- X (unshaded)
- Chance of flooding over 30 yrs
- 0.74%
- Est. flood insurance / yr
- $507 – $1,088
Fire risk 1/10 · Minimal
- Est. fire insurance / yr
- $963 – $1,789
Heat risk 5/10 · Moderate
- Hot days now (above 103°F)
- 7 days/yr
- Hot days in 30 yrs
- 17 days/yr
Wind risk 4/10 · Minor
- Chance of severe wind over 30 yrs
- 23.0%
Air-quality risk 5/10 · Moderate
- Unhealthy air days now
- 6 days/yr
- Unhealthy air days in 30 yrs
- 8 days/yr
Risk factors via First Street. Map © Google.
Why this score? — see what drove the C grade
The composite is a weighted blend of 9 inputs, each scored 0–100. Each bar is that input's sub-score; the figure is the points it added to the 100-point composite (weight × sub-score).
- Cash flow +25.1/30.0
- DSCR +8.2/10.0
- ARV discount +7.5/15.0
- 1% rule +7.1/10.0
- Livability +4.0/5.0
- Rent growth +3.1/5.0
- Condition / age +2.5/5.0
- Schools +2.1/10.0
- Appreciation +0.0/10.0
$128,000
🖨 Deal sheet 📄 Offer letter ✓ Due diligence
Listing remarks
LOCATION, LOCATION, LOCATION! This 19th- Floor 1BR Condo with city views of the Atlanta Skyline, resort-style amenities and convenience the Somerset Heights Community is loaded with value! This unit is a bright and inviting 1-bedroom, 1 bath high-rise residence offering elevated living from the 19th floor. The large windows fill the open living and dinging area with natural light and panoramic city views. Enjoy low-maintenance and convenience with an in-unit washer and dryer, one assigned parking space and a versatile HOA. Residents benefit from a full suite of community amenities, including an outdoor pool, BBQ pavilion, fitness center, library, laundry facility, dog park, meeting area wit
Key facts
- Outdoor pool
- City views
- Bbq pavilion
Tags
Property features AI
Finance
- Other: Listing terms: Cash, Conventional, FHA
- HOA & community: Condo association with monthly fee; Association fee covers insurance, building and grounds maintenance, pest control, reserve fund, security, sewer, swimming, trash, and water; Community amenities include fitness center, pool, sidewalks, street lights, proximity to public transport and shopping
Exterior
- Parking: Assigned garage; 1 parking space
- Security: Key card entry; Fire sprinkler system; Smoke detectors
- Utilities: Public water; Public sewer; 220-volt electric; Cable available; High-speed internet available; Natural gas available; Phone available; Electricity available; Sewer available; Water available
- Home design: Residential condominium; High-rise building; Attached property; Resale condition
- Construction: Built in 1968; Aluminum siding, block, brick, and concrete construction; Composition roof; No basement
- Exterior features: Level lot; Has view
Interior
- Kitchen: Disposal; Microwave; Refrigerator; Dishwasher; Stainless steel appliances; Gas water heater
- Bedrooms: 1 bedroom (main level)
- Flooring: Laminate
- Bathrooms: 1 full bathroom (main level)
- Heating & cooling: Central heating; Central air conditioning
- Interior features: High ceilings; Separate shower; Accessible doors; Two-or-more common walls; Three or more levels
- Laundry & utility: Dryer; Laundry in basement; Laundry in hall; Laundry closet
Neighborhood map
What this means for you Summary
Snapshot
- This is a 1-bed/1.0-bath condo listed at $128k.
Deal economics
- At list price, monthly cash flow is $282 ($3k/yr) — positive.
- The deal already cash-flows at list — no discount required.
- Meets the 1% rule at list price ($2k rent vs $128k).
- Recommended offer: $126k (1.5% below list) — sets the bar for market timing.
- Cap rate 8.9% vs local median 2.6% in North Decatur — top-decile yield for the area; either an underpriced asset or a hidden risk that comps aren't pricing in. Stress-test before assuming the spread holds.
Location & tenants
- Location reads 80/100 on livability (#10 in GA, #1,846 nationally) — a professional / high-income tenant draw. Strengths: crime A+, employment A+, housing A+; Watch: cost of living D+, amenities D-.
- Dekalb County (suburban): math 19% / reading 28% proficiency, ranked #125 of 174 in GA (top 72%) — low school quality limits family demand, transient renter base, plan for 1-2y turnover; 68% free/reduced lunch — lower-income household profile, screen leases tightly.
- Zoned schools: Fernbank Elementary School (math 52% / reading 57%, grade C, #185 of 1,228 statewide, top 16%, 744 students, 18% FRL); Druid Hills Middle School (math 22% / reading 37%, grade F, #249 of 470 statewide, top 55%, 956 students, 46% FRL); Druid Hills High School (math 12% / reading 22%, grade F, #277 of 424 statewide, top 67%, 1,358 students, 37% FRL) — zoned schools average 34% FRL vs 68% district-wide (34 pts lower); this property's tenant base skews higher-income than the district average.
- Market conditions: Rents rising (+2.2%/yr); 241 active listings in the ZIP; 19 comparable units currently listed for rent nearby; rentals leasing fast (median 5d on market — plan ~1-2 weeks tenant-placement turnaround); high-income renter base; 1,240 units permitted in DeKalb County in 2024 (385 in 5+ unit buildings).
- This rent is only 17% of the median local income ($112k/yr) — well below the 30% rent-burden line; pricing power to push rent on renewal without tenant pushback.
Forward outlook
- Local home prices are declining (-3.0%/yr); year-one equity from $885 of loan paydown is wiped out by about $4k of value loss. Plan a longer hold.
- DeKalb County population projected at +28% by 2050 — long-run rental-demand tailwind backs the buy-and-hold thesis.
Negotiation context
- It's been on market 27 days — a 2% lower offer ($126k) is reasonable based on typical stale-listing flexibility.
- 16 sale attempts since 11y ago with the ask held roughly flat each time — persistent listings suggest the price (not the market) is what's stuck; bring a comps-based counter.
Risks & watch-outs
- Climate carrying-cost: major flood risk; extreme-heat days projected 7→17/yr by 2055 (HVAC capex compounding) — expect insurance premiums to compound above CPI over the hold.
Questions for the listing agent
- Built in 1968 — when were the roof, HVAC, electrical panel, plumbing, and water heater last replaced?
- What does the HOA fee cover, when was the last increase, and are there any pending special assessments or reserve-fund shortfalls?
- Any open or pending special assessments — roof, HVAC, plumbing, elevator, façade? What's the per-unit balance and payoff schedule, and is the seller paying it off at close or rolling it to the buyer?
- Is there a deadline driving the sale (1031 exchange, divorce, estate, relocation)? That informs how much negotiation room exists.
- What's the average days-on-market for RENTAL listings here right now (not sales)? A rising rental-DOM trend means longer vacancies and softer asking-rent achievability than the comps imply.
- What's the recent tenant-quality profile in this submarket — average credit score on applications, eviction rate, late-payment / NSF rate, and stable-employment percentage? A property-management company in the area should have these aggregated.
- How much new apartment / multifamily construction is in the pipeline within 1–3 miles? Heavy new supply (>2% of stock underway) typically softens rents 12–24 months out; light construction supports rent growth.
Investment metrics
- 1% rule
- 1.21% ✓
- Cap rate
- 8.93%
- Cash-on-cash
- 9.44%
- DSCR
- 1.42
- GRM
- 6.9
CMA / ARV
No comps found within radius.
Projected returns pro-forma
-3.0% appreciation · 2.2% rent growth · sell at horizon
- IRR
- -3.0%
- Equity multiple
- 0.89×
- Total profit
- $-3,970
- Equity at exit
- $19,085
- IRR
- 5.8%
- Equity multiple
- 1.42×
- Total profit
- $14,902
- Equity at exit
- $11,067
Cash invested: $35,840 (down + closing). Projections, not guarantees.
Landlord ↔ Tenant lean methodology
- Overall (STATE)
- 90 Strongly Landlord-Friendly
- State Georgia
- 90 Strongly Landlord-Friendly · R+3
- County
- — inherits STATE
- City
- — inherits STATE
ZIP-level market 30033
- Rents YoY
- 2.2%
- Active inventory
- 241
- Price-to-rent
- 6.9×
Monthly cashflow live
- Estimated rent
- $1,546 high interval (Pro) →
- Mortgage (P&I)
- −$671
- Tax est. 1.5%
- −$160 /mo · $1,920/yr
- Insurance
- −$53
- HOA
- −$55
- Vacancy / Maint / Mgmt
- −$325
- Net cashflow
- $282
Break-even live
UW: 25.0% down · 7.5% · 30yr · 1.5% tax · 5.0% vac · 8.0% maint · 8.0% mgmt
Financing live
Cash to close
- Down payment
- $32,000
- Closing costs
- $3,840
- Reserves months
- —
- Total cash needed
- —
Loan-product check · same deal, 3 products live
Conventional
25% down · 7.5% · 30yr
- Down + closing
- —
- Monthly P&I
- —
- Monthly cashflow
- —
- DSCR
- —
- Eligible?
- —
Personal DTI + credit; lowest rate.
DSCR
20% down · 8.5% · 30yr
- Down + closing
- —
- Monthly P&I
- —
- Monthly cashflow
- —
- DSCR
- —
- Eligible?
- —
No personal income docs; deal must DSCR.
Hard money
10% down · 12.0% · 12mo
- Down + closing
- —
- Monthly P&I
- —
- Monthly cashflow
- —
- DSCR
- —
- Eligible?
- —
Short-term bridge; refi at stabilization.
Rent comps 19 comps
| Address | Beds | Baths | Sqft | Rent | $/sqft | DOM | Units | Dist |
|---|---|---|---|---|---|---|---|---|
| 1575 Clairmont Rd Decatur, GA | 1.0–2.0 | 1.0–2.0 | 935 | $1,449 | $1.55 | 3d | 20 | 0.11mi |
| 10 Highland Lake Cir Decatur, GA | 1.0–3.0 | 1.0–2.0 | 1075 | $1,519 | $1.41 | 1d | 23 | 0.29mi |
| 1861 Clairmont Rd Unit A513 Decatur, GA | — | 1.0 | 500 | $1,730 | $3.46 | 5d | 1 | 0.68mi |
| 451 Durand Dr NE Unit 1 Atlanta, GA | 1.0 | 1.0 | 550 | $1,195 | $2.17 | 43d | 1 | 0.83mi |
| 757 Houston Mill Rd NE #5 Atlanta, GA | 1.0 | 1.0 | 741 | $1,600 | $2.16 | 43d | 1 | 0.92mi |
| 755 Houston Mill Rd NE Atlanta, GA | 1.0 | 1.0 | 741 | $1,650 | $2.23 | 43d | 1 | 0.94mi |
| 3421 N Druid Hills Rd Decatur, GA | 2.0 | 1.0–2.0 | 885 | $1,436 | $1.62 | 1d | 74 | 0.97mi |
| 1783 Ridgewood Dr NE Apt 2 Atlanta, GA | 1.0 | 1.0 | 600 | $2,499 | $4.17 | 5d | 1 | 1.07mi |
| 132 Huron St Unit 2 Decatur, GA | 1.0 | 1.0 | 700 | $1,550 | $2.21 | 20d | 1 | 1.09mi |
| 2536 Blackmon Dr Decatur, GA | 1.0–2.0 | 1.0–2.0 | 942 | $2,437 | $2.59 | 20d | 13 | 1.19mi |
| 2075 Lavista Rd NE Atlanta, GA | 1.0–2.0 | 1.0–2.0 | 1050 | $1,600 | $1.52 | 5d | 23 | 1.29mi |
| 2588 Decatur Village Dr Decatur, GA | 1.0–2.0 | 1.0–2.0 | 964 | $1,594 | $1.65 | 1d | 24 | 1.30mi |
| 855 Emory Point Dr Atlanta, GA | 2.0 | 1.0–2.0 | 876 | $2,434 | $2.78 | 1d | 85 | 1.31mi |
| 1605 Church St Decatur, GA | 3.0 | 1.0–2.0 | 1077 | $1,537 | $1.43 | 1d | 25 | 1.40mi |
| 2284 Lavista Rd NE Atlanta, GA | 1.0–2.0 | 1.0 | 781 | $1,095 | $1.40 | 5d | 4 | 1.41mi |
| 1351 Oxford Rd NE Unit 3 Atlanta, GA | 1.0 | 1.0 | 700 | $1,650 | $2.36 | 21d | 1 | 1.41mi |
| 2284 Lavista Rd Unit 2282-01 Atlanta, GA | 1.0 | 1.0 | 715 | $1,350 | $1.89 | 43d | 1 | 1.43mi |
| 2284 Lavista Rd Unit 2298 21 Atlanta, GA | 1.0 | 1.0 | 576 | $1,095 | $1.90 | 12d | 1 | 1.43mi |
| 2600 Milscott Dr Decatur, GA | 3.0 | 1.0–2.0 | 1087 | $2,221 | $2.04 | 1d | 30 | 1.48mi |
HOA detail condo
- Monthly dues
- $55 · $660/yr
- Likely covers
- poolgymparking
- Assessments
- None detected in remarks — confirm with the listing agent.
Listing history 50 events
-
2026-06-18days on market $128,000 Active 27 DOM
-
2026-06-17days on market $128,000 Active 26 DOM
-
2026-06-16days on market $128,000 Active 25 DOM
-
2026-06-15days on market $128,000 Active 24 DOM
-
2026-06-13days on market $128,000 Active 22 DOM
-
2026-06-09days on market $128,000 Active 18 DOM
-
2026-06-08days on market $128,000 Active 17 DOM
-
2026-06-07statusdays on market $128,000 Active 16 DOM
-
2026-06-04days on market $128,000 New 13 DOM
-
2026-06-03days on market $128,000 New 12 DOM
-
2026-06-02days on market $128,000 New 11 DOM
-
2026-06-01days on market $128,000 New 10 DOM
-
2026-05-31days on market $128,000 New 9 DOM
-
2026-05-22$128,000 New
-
2026-04-27historical
-
2026-04-22price $275,000
-
2026-03-26price $285,000
-
2026-03-04price $289,900
-
2026-02-21$295,000 New
-
2025-05-31historical
-
2025-05-31historical
-
2025-04-21price $297,500
-
2025-04-21price $297,500
-
2025-03-31$299,000 Active
-
2025-03-31$299,000 New
-
2023-08-30soldstatus $245,000 Sold
-
2023-08-21status Under Contract
-
2023-08-14status Back On Market
-
2023-06-19historical Active Under Contract
-
2023-06-05$245,000 New
-
2023-02-13historical
-
2023-01-27price $234,900
-
2022-12-01price $239,900
-
2022-11-02price $249,900
-
2022-10-11$263,000 New
-
2021-10-15soldstatus $145,000 Sold
-
2021-09-26status Under Contract
-
2021-09-17status Back on Market
-
2021-09-09status Under Contract
-
2021-08-31$145,000 New
-
2021-01-09status Under Contract
-
2020-12-22soldstatus $120,000 Sold
-
2020-09-26price $129,900
-
2020-09-24$139,000 New
-
2019-06-07soldstatus $173,000 Sold
-
2019-05-07soldstatus $136,000 Sold
-
2019-04-30soldstatus $175,000 Sold
-
2019-04-28status Under Contract
-
2019-04-25status Under Contract
-
2019-04-20status Under Contract
ⓘ Source: listings_history table (triggers on properties + properties_extension) + one-shot
backfill from property_details.listing_events for pre-trigger history.
Climate risk First Street
- Flood 6/10 Major FEMA zone X (unshaded) · 74% chance over 30 yrs
- Wildfire 1/10 Low
- Heat 5/10 Major 7 d/yr ≥103°F today · 17 d/yr by 30 yrs out
- Wind 4/10 Moderate 23% chance of damaging wind over 30 yrs
- Air quality 5/10 Major 6 unhealthy d/yr today · 8 by 30 yrs out
Nearby sold comps map
Loading sold comps map…
Walkable amenities ~0.75 mi
Loading nearby amenities…
Taxation est. · year 1
- Rental income
- $18,553
- − Mortgage interest
- −$7,170
- − Property taxes
- −$1,920
- − Insurance
- −$640
- − Repairs & maintenance
- −$1,484
- − Management
- −$1,484
- − HOA
- −$660
- − Depreciation
- −$3,724
- Taxable income
- $1,471
- Est. tax owed @ 24.0%
- −$353
- After-tax cash flow
- $3,029/yr
For passive investors: Depreciation is non-cash, so a rental often shows a tax loss while cash-flowing — sheltering income. Rental losses are passive: they offset passive income freely, and up to $25,000/yr can offset ordinary (W-2) income if you actively participate and your MAGI is under $100k (phasing out to $0 by $150k); unused losses carry forward. On sale, claimed depreciation is recaptured at up to 25%, and gains may owe capital-gains tax (a 1031 exchange can defer both). Figures are a year-1 estimate at your 24.0% rate — not tax advice; consult a CPA.
Schools (NCES district)
- District
- Dekalb County
- NCES district ID
- 1301740
- Math proficiency
- 19% ▼ -12.00%
- Reading proficiency
- 28% ▼ -7.00%
- Median HH income
- $51,448
- Composite
- 20.92/100
- National rank
- #8482
- State rank
- #125 of 174 in GA
Livability — North Decatur
- Score
- 80/100
- State rank
- #10
- US rank
- #1846
Category grades
Schools grade is shown separately in the Schools card above.
Census & demographics
- Census place
- North Decatur, GA
- County
- Dekalb County · 782,738 people
- City population
- 31,530
- Metro
- Atlanta-Sandy Springs-Alpharetta, GA
- Population (ZIP)
- 31,310
- Household income
- $111,616
- Rent vs Own
- Severe rent burden
- 1503.0
Population outlook (DeKalb County) Hauer SSP2
- Today (2025)
- 839,977 people
- By 2030
- 891,768 · +6.2%
- By 2040
- 988,894 · +17.7%
- By 2050
- 1,074,583 · +27.9%
- By 2075
- 1,245,026 · +48.2%
- By 2100
- 1,303,135 · +55.1%
Race, ethnicity, and origin ACS 2023
- Neighborhood character
- Diverse neighborhood (Simpson 0.60)
- Race & ethnicity
- White 59% Black 14% Asian 13% Two or more races 8% Hispanic / Latino 7%
- Hispanic origin (detail)
- Mexican 2%
- Common ancestry
- Slovak 4% Lithuanian 3% Romanian 3%
- Foreign-born
- 17% · China, Canada, South Korea
- Languages at home
- 80% English-only · Other Indo-European 5% Spanish 5% Chinese 3%
Political lean MEDSL · DeKalb
- 2024 margin
- Solid D (+64.8) · D 81.9% · R 17.1% · Other 1.0%
- 2008→2024 swing
- +6.1pp toward D · 2008: 58.6pp · 2024: 64.8pp
- All cycles
- 2024: D+64.8 2020: D+67.4 2016: D+64.8 2012: D+56.8 2008: D+58.6
Not yet ingested
- Civics
- —
Market trends
- HPI YoY
- ▼ -393.60%
- Current HPI
- 234.828
- Rent YoY
- ▲ 2.20%
- Metro
- Atlanta-Sandy Springs-Alpharetta, GA
- State GDP YoY
- ▲ 2.66%
- F500 in state
- 28
Industry mix (Fortune 500 HQ in GA)
| Industry | F500 HQs | Revenue |
|---|---|---|
| Paper / Packaging | 2 | $29B |
|
||
| Retail | 1 | $160B |
|
||
| Transportation / Logistics | 1 | $91B |
|
||
| Airlines | 1 | $62B |
|
||
| Consumer Goods | 1 | $47B |
|
||
| Utilities | 1 | $25B |
|
||
Price history
+34.7% since first listed60 events — show timeline
- 2026-05-22 Listed $128,000 GAMLS
- 2026-04-27 Listing Removed — GAMLS
- 2026-04-22 Price Changed $275,000 GAMLS
- 2026-03-26 Price Changed $285,000 GAMLS
- 2026-03-04 Price Changed $289,900 GAMLS
- 2026-02-21 Listed $295,000 GAMLS
- 2025-05-31 Listing Removed — GAMLS
- 2025-05-31 Listing Removed — FMLS
- 2025-04-21 Price Changed $297,500 GAMLS
- 2025-04-21 Price Changed $297,500 FMLS
- 2025-03-31 Listed $299,000 GAMLS
- 2025-03-31 Listed $299,000 FMLS
- 2023-08-30 Sold (MLS) $245,000 GAMLS
- 2023-08-21 Pending — GAMLS
- 2023-08-14 Relisted — GAMLS
- 2023-06-19 Contingent — GAMLS
- 2023-06-05 Listed $245,000 GAMLS
- 2023-02-13 Listing Removed — GAMLS
- 2023-01-27 Price Changed $234,900 GAMLS
- 2022-12-01 Price Changed $239,900 GAMLS
- 2022-11-02 Price Changed $249,900 GAMLS
- 2022-10-11 Listed $263,000 GAMLS
- 2021-10-15 Sold (MLS) $145,000 GAMLS
- 2021-09-26 Pending — GAMLS
- 2021-09-17 Relisted — GAMLS
- 2021-09-09 Pending — GAMLS
- 2021-08-31 Listed $145,000 GAMLS
- 2021-01-09 Pending — GAMLS
- 2020-12-22 Sold (MLS) $120,000 GAMLS
- 2020-09-26 Price Changed $129,900 GAMLS
- 2020-09-24 Listed $139,000 GAMLS
- 2019-06-07 Sold (MLS) $173,000 GAMLS
- 2019-05-07 Sold (MLS) $136,000 GAMLS
- 2019-04-30 Sold (MLS) $175,000 GAMLS
- 2019-04-28 Pending — GAMLS
- 2019-04-25 Pending — GAMLS
- 2019-04-20 Pending — GAMLS
- 2019-04-16 Listed $179,900 GAMLS
- 2019-04-06 Price Changed $179,950 GAMLS
- 2019-03-25 Price Changed $145,000 GAMLS
- 2019-02-15 Price Changed $149,900 GAMLS
- 2019-02-11 Relisted — GAMLS
- 2019-02-09 Listing Removed — GAMLS
- 2018-12-12 Price Changed $159,000 GAMLS
- 2018-11-16 Listed $187,500 GAMLS
- 2018-08-12 Listed $165,000 GAMLS
- 2018-03-07 Sold (MLS) $117,200 GAMLS
- 2018-02-05 Pending — GAMLS
- 2018-01-19 Listed $120,000 GAMLS
- 2015-07-14 Price Changed $111,700 GAMLS
- 2015-06-29 Listing Removed — GAMLS
- 2015-06-23 Sold (MLS) $111,700 GAMLS
- 2015-05-26 Pending — GAMLS
- 2015-05-12 Price Changed $114,900 GAMLS
- 2015-04-03 Listed $114,900 GAMLS
- 2013-10-24 Price Changed $91,000 GAMLS
- 2013-10-01 Sold (MLS) $91,000 GAMLS
- 2013-09-09 Pending — GAMLS
- 2013-09-09 Price Changed $95,000 GAMLS
- 2013-08-29 Price Changed $95,000 GAMLS
Cash-flow waterfall
monthlySold comps — $/sqft
last 12 mo · ≤1 miLoading sold comps…