14-3446 Holiday Rd · Nanawale Estates, HI
Flood risk 3/10 · Minor
- FEMA flood zone
- X (unshaded)
- Chance of flooding over 30 yrs
- 0.2%
- Est. flood insurance / yr
- $507 – $1,088
Fire risk No data
- Est. fire insurance / yr
- —
Heat risk No data
- Hot days now (above threshold)
- —
- Hot days in 30 yrs
- —
Wind risk No data
- Chance of severe wind over 30 yrs
- —
Air-quality risk 1/10 · Minimal
- Unhealthy air days now
- —
- Unhealthy air days in 30 yrs
- —
Risk factors via First Street. Map © Google.
Why this score? — see what drove the B- grade
The composite is a weighted blend of 9 inputs, each scored 0–100. Each bar is that input's sub-score; the figure is the points it added to the 100-point composite (weight × sub-score).
- Cash flow +26.3/30.0
- ARV discount +12.2/15.0
- DSCR +8.9/10.0
- 1% rule +7.1/10.0
- Condition / age +3.8/5.0
- Schools +3.7/10.0
- Livability +3.1/5.0
- Rent growth +2.5/5.0
- Appreciation +0.0/10.0
$149,000
🖨 Deal sheet (PDF) 📄 Offer letter ✓ Due diligence
Listing remarks MLS
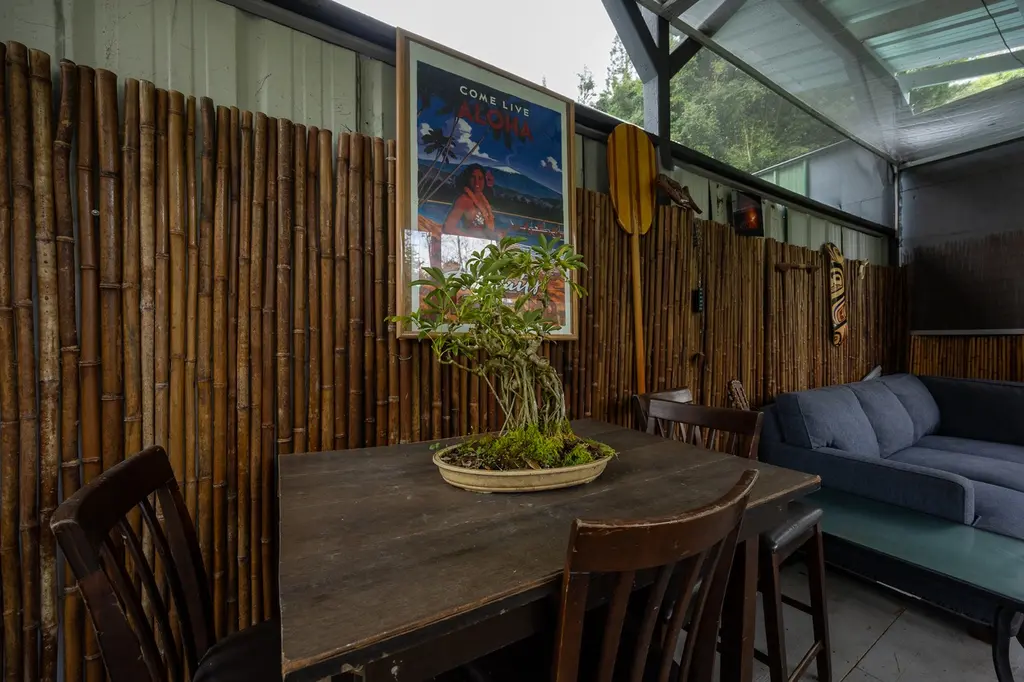
Escape the ordinary and step into your own private jungle retreat! This fully off-grid A-frame - it's for the visionary who craves simplicity, nature, and a little edge. Featuring a 1 bed / 1 bath layout (unpermitted), this rustic hideaway delivers raw island living with undeniable charm. Wake up to birdsong, sip your coffee surrounded by towering trees, and unwind in the screened-in lounge and open-air kitchen that blur the line between indoors and out. Every inch of this property invites you to slow down and reconnect with nature, with yourself, with the lifestyle most people only dream about. Fenced and gated for added privacy. Off-grid freedom Immersed in nature Not for everyone, but maybe exactly what you've been looking for.
Key facts
- Open-air kitchen
- Off-grid a-frame
- Fenced and gated
Tags
Neighborhood map
What this means for you Summary
Snapshot
- This is a 1-bed/1.0-bath single-family listed at $149k. Condition is rated good.
Deal economics
- At list price, monthly cash flow is $383 ($5k/yr) — positive.
- The deal already cash-flows at list — no discount required.
- Meets the 1% rule at list price ($2k rent vs $149k).
- Recommended offer: $145k (3.0% below list) — sets the bar for market timing.
Location & tenants
- Location reads 61/100 on livability (#78 in HI) — a middle-class / working-renter tenant base. Strengths: crime A+, housing B; Watch: employment C-, health & safety C-, schools F.
- Hawaii Department Of Education (suburban): math 32% / reading 50% proficiency, ranked #1 of 1 in HI (top 100%) — families likely to look elsewhere, expect single-tenant / working-renter base with shorter leases.
- Market conditions: 387 active listings in the ZIP; 1 comparable units currently listed for rent nearby; 982 units permitted in Hawaii County in 2024 (0 in 5+ unit buildings).
Forward outlook
- Local home prices are declining (-3.0%/yr); year-one equity from $1k of loan paydown is wiped out by about $4k of value loss. Plan a longer hold.
- Hawaii County population projected at +24% by 2050 — long-run rental-demand tailwind backs the buy-and-hold thesis.
- At projected returns (-3.0% appreciation + 3.0% rent growth), your $42k cash investment doubles in ~10 years — after that, you're playing with house money.
Negotiation context
- It's been on market 60 days — a 3% lower offer ($145k) is reasonable based on typical stale-listing flexibility.
- 2 sale attempts with the ask held roughly flat each time — persistent listings suggest the price (not the market) is what's stuck; bring a comps-based counter.
Questions for the listing agent
- It's been on market 60 days. Have you received any prior offers? Is the seller open to a 3% concession, seller financing, or rate buy-down credit?
- What does the HOA fee cover, when was the last increase, and are there any pending special assessments or reserve-fund shortfalls?
- Is there a deadline driving the sale (1031 exchange, divorce, estate, relocation)? That informs how much negotiation room exists.
- Schools are F-rated, which usually means shorter tenancies and higher turnover. Who's the typical renter profile here, and what's been the actual vacancy rate?
- What's the average days-on-market for RENTAL listings here right now (not sales)? A rising rental-DOM trend means longer vacancies and softer asking-rent achievability than the comps imply.
- What's the recent tenant-quality profile in this submarket — average credit score on applications, eviction rate, late-payment / NSF rate, and stable-employment percentage? A property-management company in the area should have these aggregated.
- How much new for-sale + rental construction is in the pipeline within 1–3 miles? Heavy new supply typically softens prices + rents 12–24 months out; constrained supply supports both.
Investment metrics
- 1% rule
- 1.21% ✓
- Cap rate
- 9.38%
- Cash-on-cash
- 11.02%
- DSCR
- 1.49
- GRM
- 6.9
CMA / ARV
- ARV (median comp)
- $166,400
- List price
- $149,000
- Delta
- -10.46%
- Verdict
- UNDERPRICED
- Comps
- 5 within 1.0 mi
Show comp detail 1 sale within ~0.75 mi
| Address | Dist | Beds/Ba | Sqft | Sold | Price | $/sf | Match |
|---|---|---|---|---|---|---|---|
| 14-823 Seaview Rd | 0.75mi | 2/1.0 (+1) | 855 (+4%) | 2mo | $166,400 | $195 | 51 |
Match score weights: distance 35% · size 25% · config 20% · recency 20%. Top-matched comps best support the ARV.
Projected returns pro-forma
-3.0% appreciation · 3.0% rent growth · sell at horizon
- IRR
- 0.2%
- Equity multiple
- 1.01×
- Total profit
- $301
- Equity at exit
- $22,216
- IRR
- 9.9%
- Equity multiple
- 1.76×
- Total profit
- $31,829
- Equity at exit
- $12,883
Cash invested: $41,720 (down + closing). Projections, not guarantees.
Landlord ↔ Tenant lean methodology
- Overall (STATE)
- 37 Tenant-Leaning
- State Hawaii
- 37 Tenant-Leaning · D+13
- County
- — inherits STATE
- City
- — inherits STATE
ZIP-level market 96778
- Home prices YoY
- -15.3%
- Active inventory
- 387
- Price-to-rent
- 6.9×
Monthly cashflow live
- Estimated rent
- $1,800 medium interval (Pro) →
- Mortgage (P&I)
- −$781
- Tax est. 1.5%
- −$186 /mo · $2,235/yr
- Insurance
- −$62
- HOA
- −$9
- Vacancy / Maint / Mgmt
- −$378
- Net cashflow
- $383
Break-even live
Sensitivity live
| Price | -10% $486 | -5% $435 | +0% $383 | +5% $332 | +10% $280 |
|---|---|---|---|---|---|
| Rent | -10% $241 | -5% $312 | +0% $383 | +5% $454 | +10% $525 |
| Rate | -1.0pp $458 | -0.5pp $421 | base $383 | +0.5pp $345 | +1.0pp $305 |
UW: 25.0% down · 7.5% · 30yr · 1.5% tax · 5.0% vac · 8.0% maint · 8.0% mgmt
Financing live
Cash to close
- Down payment
- $37,250
- Closing costs
- $4,470
- Reserves months
- —
- Total cash needed
- —
Loan-product check · same deal, 3 products live
Conventional
25% down · 7.5% · 30yr
- Down + closing
- —
- Monthly P&I
- —
- Monthly cashflow
- —
- DSCR
- —
- Eligible?
- —
Personal DTI + credit; lowest rate.
DSCR
20% down · 8.5% · 30yr
- Down + closing
- —
- Monthly P&I
- —
- Monthly cashflow
- —
- DSCR
- —
- Eligible?
- —
No personal income docs; deal must DSCR.
Hard money
10% down · 12.0% · 12mo
- Down + closing
- —
- Monthly P&I
- —
- Monthly cashflow
- —
- DSCR
- —
- Eligible?
- —
Short-term bridge; refi at stabilization.
Rent comps 1 comps
| Address | Beds | Baths | Sqft | Rent | $/sqft | DOM | Units | Dist |
|---|---|---|---|---|---|---|---|---|
| 14-865 Hapuu Rd Pahoa, HI | 2.0 | 1.0 | 816 | $1,800 | $2.21 | 44d | 1 | 0.59mi |
HOA detail
- Monthly dues
- $9 · $108/yr
- Likely covers
- security
Listing history 23 events
-
2026-06-18days on market $149,000 Active 60 DOM
-
2026-06-17days on market $149,000 Active 59 DOM
-
2026-06-16days on market $149,000 Active 58 DOM
-
2026-06-15days on market $149,000 Active 57 DOM
-
2026-06-13days on market $149,000 Active 55 DOM
-
2026-06-13days on market $149,000 Active 54 DOM
-
2026-06-10days on market $149,000 Active 52 DOM
-
2026-06-09days on market $149,000 Active 51 DOM
-
2026-06-08days on market $149,000 Active 50 DOM
-
2026-06-07days on market $149,000 Active 49 DOM
-
2026-06-05days on market $149,000 Active 46 DOM
-
2026-06-03days on market $149,000 Active 45 DOM
-
2026-06-02days on market $149,000 Active 44 DOM
-
2026-06-01days on market $149,000 Active 43 DOM
-
2026-05-31days on market $149,000 Active 42 DOM
-
2026-04-19$155,000 Active 740-char remark
Show marketing remark (740 chars)
Escape the ordinary and step into your own private jungle retreat! This fully off-grid A-frame - it's for the visionary who craves simplicity, nature, and a little edge. Featuring a 1 bed / 1 bath layout (unpermitted), this rustic hideaway delivers raw island living with undeniable charm. Wake up to birdsong, sip your coffee surrounded by towering trees, and unwind in the screened-in lounge and open-air kitchen that blur the line between indoors and out. Every inch of this property invites you to slow down and reconnect with nature, with yourself, with the lifestyle most people only dream about. Fenced and gated for added privacy. Off-grid freedom Immersed in nature Not for everyone, but maybe exactly what you've been looking for.
-
2026-02-13historical
-
2025-11-29price $165,000
-
2025-10-16price $170,000
-
2025-09-25price $175,000
-
2025-04-01price $180,000
-
2025-03-18price $187,000
-
2025-02-07$193,000 Active
ⓘ Source: listings_history table (triggers on properties + properties_extension) + one-shot
backfill from property_details.listing_events for pre-trigger history.
Climate risk First Street
- Flood 3/10 Moderate FEMA zone X (unshaded) · 20% chance over 30 yrs
- Air quality 1/10 Low
Nearby sold comps map
Loading sold comps map…
Walkable amenities ~0.75 mi
Loading nearby amenities…
Taxation est. · year 1
- Rental income
- $21,600
- − Mortgage interest
- −$8,346
- − Property taxes
- −$2,235
- − Insurance
- −$745
- − Repairs & maintenance
- −$1,728
- − Management
- −$1,728
- − HOA
- −$108
- − Depreciation
- −$4,335
- Taxable income
- $2,375
- Est. tax owed @ 24.0%
- −$570
- After-tax cash flow
- $4,030/yr
For passive investors: Depreciation is non-cash, so a rental often shows a tax loss while cash-flowing — sheltering income. Rental losses are passive: they offset passive income freely, and up to $25,000/yr can offset ordinary (W-2) income if you actively participate and your MAGI is under $100k (phasing out to $0 by $150k); unused losses carry forward. On sale, claimed depreciation is recaptured at up to 25%, and gains may owe capital-gains tax (a 1031 exchange can defer both). Figures are a year-1 estimate at your 24.0% rate — not tax advice; consult a CPA.
Condition & rehab AI · 12 photos
This off-grid A-frame property offers a unique and serene living experience with modern amenities and a well-maintained exterior. Minor improvements to landscaping and interior paint would significantly enhance its resale and rental value.
Value-add opportunities
- Both Landscaping and curb appeal improvements — Enhances the property's appeal and value
- Both HVAC system inspection and maintenance — Ensures comfort and energy efficiency
- Both Paint interior walls and trim — Fresh paint enhances the home's curb appeal and value
Renovation cost estimate screening
Value-add ROI direction
- Both Landscaping and curb appeal improvements — Enhances the property's appeal and value ↑
- Both HVAC system inspection and maintenance — Ensures comfort and energy efficiency ↑
- Both Paint interior walls and trim — Fresh paint enhances the home's curb appeal and value ↑
ⓘ Cost ranges are severity-bucket heuristics (US national rule-of-thumb). Get contractor quotes + a written scope before underwriting a rehab budget.
Schools (NCES district)
- District
- Hawaii Department Of Education
- NCES district ID
- 1500030
- Math proficiency
- 32% ▼ -10.00%
- Reading proficiency
- 50% ▼ -3.00%
- Median HH income
- $69,005
- Composite
- 37.07/100
- National rank
- #4504
- State rank
- #1 of 1 in HI
Livability — Nanawale Estates
- Score
- 61/100
- State rank
- #78
- US rank
- #17834
Category grades
Schools grade is shown separately in the Schools card above.
Census & demographics
- Census place
- Nanawale Estates, HI
- Population (ZIP)
- 14,225
Population outlook (Hawaii County) Hauer SSP2
- Today (2025)
- 220,733 people
- By 2030
- 232,156 · +5.2%
- By 2040
- 252,486 · +14.4%
- By 2050
- 272,703 · +23.5%
- By 2075
- 332,113 · +50.5%
- By 2100
- 398,342 · +80.5%
Race, ethnicity, and origin ACS 2023
- Neighborhood character
- Highly diverse neighborhood (Simpson 0.82)
- Race & ethnicity
- White 37% Two or more races 30% Hispanic / Latino 15% Pacific Islander 15% Asian 12%
- Hispanic origin (detail)
- Mexican 4% Puerto Rican 9%
- Common ancestry
- Russian 7% Italian 3% Romanian 3%
- Foreign-born
- 12% · Canada, Vietnam
- Languages at home
- 77% English-only · Other Asian/Pacific 11% Tagalog/Filipino 1% Russian/Polish/Slavic 1%
Political lean MEDSL · Hawaii
- 2024 margin
- Strong D (+28.3) · D 63.0% · R 34.7% · Other 2.3%
- 2008→2024 swing
- -25.4pp toward R · 2008: 53.7pp · 2024: 28.3pp
- All cycles
- 2024: D+28.3 2020: D+36.2 2016: D+36.6 2012: D+51.3 2008: D+53.7
Not yet ingested
- Civics
- —
Market trends
- HPI YoY
- ▼ -31.52%
- Current HPI
- 173.8168
- Rent YoY
- —
- Metro
- —
- State GDP YoY
- —
- F500 in state
- 0
Price history
-19.7% since first listed8 events — show timeline
- 2026-04-19 Listed $155,000 HI Information Service
- 2026-02-13 Listing Removed — HI Information Service
- 2025-11-29 Price Changed $165,000 HI Information Service
- 2025-10-16 Price Changed $170,000 HI Information Service
- 2025-09-25 Price Changed $175,000 HI Information Service
- 2025-04-01 Price Changed $180,000 HI Information Service
- 2025-03-18 Price Changed $187,000 HI Information Service
- 2025-02-07 Listed $193,000 HI Information Service
Cash-flow waterfall
monthlySold comps — $/sqft
last 12 mo · ≤1 miLoading sold comps…