 Multi-family
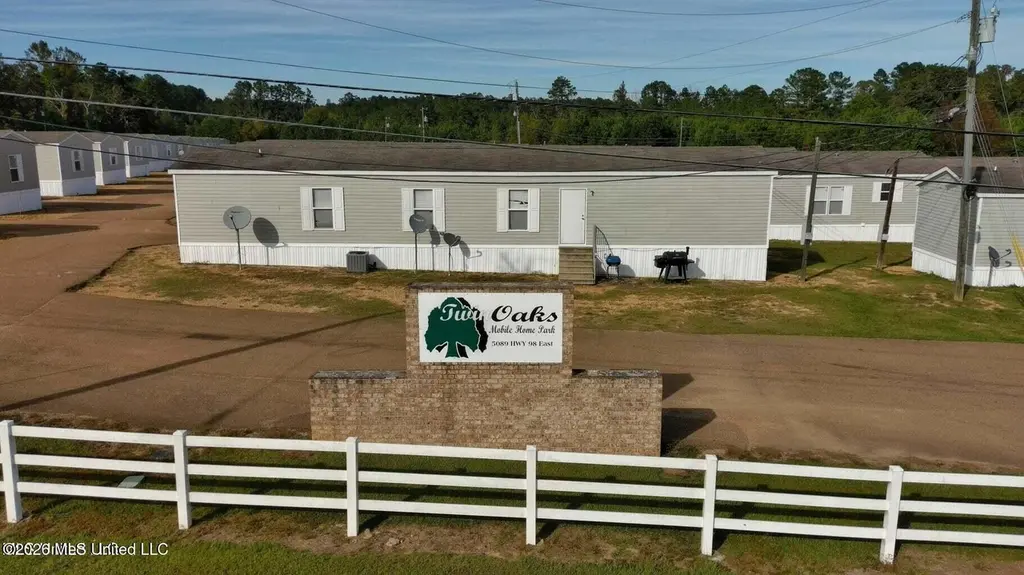
5089 U.s. 98 · Fernwood, MS
Flood risk 1/10 · Minimal
- FEMA flood zone
- X (unshaded)
- Chance of flooding over 30 yrs
- 0.0%
- Est. flood insurance / yr
- $507 – $1,088
Fire risk 7/10 · Major
- Est. fire insurance / yr
- $1,241 – $2,305
Heat risk 8/10 · Major
- Hot days now (above 108°F)
- 7 days/yr
- Hot days in 30 yrs
- 22 days/yr
Wind risk 8/10 · Major
- Chance of severe wind over 30 yrs
- 99.0%
Air-quality risk 1/10 · Minimal
- Unhealthy air days now
- 0 days/yr
- Unhealthy air days in 30 yrs
- 0 days/yr
Risk factors via First Street. Map © Google.
Why this score? — see what drove the C+ grade
The composite is a weighted blend of 9 inputs, each scored 0–100. Each bar is that input's sub-score; the figure is the points it added to the 100-point composite (weight × sub-score).
- Cash flow +28.2/30.0
- DSCR +10.0/10.0
- 1% rule +7.8/10.0
- ARV discount +7.5/15.0
- Rent growth +2.5/5.0
- Livability +2.5/5.0
- Schools +2.4/10.0
- Condition / age +2.2/5.0
- Appreciation +0.0/10.0
$2,900,000
🖨 Deal sheet 📄 Offer letter ✓ Due diligence
Multi-family units
County records classify this as Multi-Family (5+ Unit). Listing-text estimate: 1 unit. estimate disagrees with records
5+ unit building — per-unit beds/baths from public records are typically unavailable; the breakdown below (if shown) is an estimate from the listing text.
Listing remarks MLS
Start or expand your investment portfolio with this 16±/- acre Mobile Home Park located in Pike County, MS. This well-maintained property features 45 mobile homes, all 100% occupied, showcasing strong and consistent rental demand. Each unit offers 3 bedrooms and 2 baths, built between 1999 and 2016, providing modern layouts and dependable tenant appeal. Situated within the highly sought-after North Pike School District, this investment delivers immediate income potential and long-term growth. Additional highlights include two parking spaces per unit, a no-pet policy (inside or outside units), and a waiting list for future openings, further proof of the park's solid performance. Notice required for all showings. 45 mobile homes not enough? Consider An additional 53 dwelling mobile home park on 20+/- acres just across the way listed separately with so many extras!
Key facts
- 16 acre lot
- 2 parking spots
- Built 2016
Neighborhood map
What this means for you Summary
Snapshot
- This is a 3-bed/2.0-bath multifamily listed at $2.90M. Condition is rated fair.
Deal economics
- At list price, monthly cash flow is $9k ($110k/yr) — positive.
- The deal already cash-flows at list — no discount required.
- Meets the 1% rule at list price ($37k rent vs $2.90M).
- Recommended offer: $2.73M (6.0% below list) — sets the bar for market timing.
Location & tenants
- Location reads: area grade C — affects rentability + tenant quality, not the cash-flow math above.
- North Pike School District (town): math 25% / reading 32% proficiency, ranked #69 of 130 in MS (top 53%) — low school quality limits family demand, transient renter base, plan for 1-2y turnover.
- Market conditions: 190 active listings in the ZIP; 10 units permitted in Pike County in 2024 (0 in 5+ unit buildings).
Forward outlook
- Local home prices are declining (-3.0%/yr); year-one equity from $20k of loan paydown is wiped out by about $87k of value loss. Plan a longer hold.
- Pike County population projected at -14% by 2050 — secular population decline; favor cash flow + early exit over multi-decade hold.
- At projected returns (-3.0% appreciation + 3.0% rent growth), your $812k cash investment doubles in ~9 years — after that, you're playing with house money.
Negotiation context
- It's been on market 62 days — a 6% lower offer ($2.73M) is reasonable based on typical stale-listing flexibility.
- 2 sale attempts with the ask held roughly flat each time — persistent listings suggest the price (not the market) is what's stuck; bring a comps-based counter.
Risks & watch-outs
- Climate carrying-cost: severe wind risk, 99% chance of damaging wind over 30y; major wildfire risk; extreme-heat days projected 7→22/yr by 2055 (HVAC capex compounding) — expect insurance premiums to compound above CPI over the hold.
Questions for the listing agent
- It's been on market 62 days. Have you received any prior offers? Is the seller open to a 6% concession, seller financing, or rate buy-down credit?
- Have any recent inspections been done? Can we get a copy of the seller's disclosures and any deferred-maintenance estimates?
- Why hasn't it sold? Are there any deal-killer items the seller is aware of (foundation, flood, title, zoning, code violations)?
- Is there a deadline driving the sale (1031 exchange, divorce, estate, relocation)? That informs how much negotiation room exists.
- What's the average days-on-market for RENTAL listings here right now (not sales)? A rising rental-DOM trend means longer vacancies and softer asking-rent achievability than the comps imply.
- What's the recent tenant-quality profile in this submarket — average credit score on applications, eviction rate, late-payment / NSF rate, and stable-employment percentage? A property-management company in the area should have these aggregated.
- How much new apartment / multifamily construction is in the pipeline within 1–3 miles? Heavy new supply (>2% of stock underway) typically softens rents 12–24 months out; light construction supports rent growth.
Investment metrics
- 1% rule
- 1.28% ✓
- Cap rate
- 10.09%
- Cash-on-cash
- 13.57%
- DSCR
- 1.60
- GRM
- 6.5
CMA / ARV
No comps found within radius.
Projected returns pro-forma
-3.0% appreciation · 3.0% rent growth · sell at horizon
- IRR
- 3.7%
- Equity multiple
- 1.14×
- Total profit
- $115,317
- Equity at exit
- $432,399
- IRR
- 13.2%
- Equity multiple
- 2.05×
- Total profit
- $855,556
- Equity at exit
- $250,739
Cash invested: $812,000 (down + closing). Projections, not guarantees.
Landlord ↔ Tenant lean methodology
- Overall (STATE)
- 90 Strongly Landlord-Friendly
- State Mississippi
- 90 Strongly Landlord-Friendly · R+11
- County
- — inherits STATE
- City
- — inherits STATE
ZIP-level market 39648
- Active inventory
- 190
- Price-to-rent
- 294.0×
Monthly cashflow live
- Estimated rent
- $36,989 medium interval (Pro) →
- Mortgage (P&I)
- −$15,208
- Tax est. 1.5%
- −$3,625 /mo · $43,500/yr
- Insurance
- −$1,208
- HOA
- −$0
- Vacancy / Maint / Mgmt
- −$7,768
- Net cashflow
- $9,180
Break-even live
45-unit breakdown (identical units grouped — click to expand)
| Units | Beds | Baths | Est. rent |
|---|---|---|---|
| 45× units | 3 | 2 | $36,990 |
| #1 | 3 | 2 | $822 |
| #2 | 3 | 2 | $822 |
| #3 | 3 | 2 | $822 |
| #4 | 3 | 2 | $822 |
| #5 | 3 | 2 | $822 |
| #6 | 3 | 2 | $822 |
| #7 | 3 | 2 | $822 |
| #8 | 3 | 2 | $822 |
| #9 | 3 | 2 | $822 |
| #10 | 3 | 2 | $822 |
| #11 | 3 | 2 | $822 |
| #12 | 3 | 2 | $822 |
| #13 | 3 | 2 | $822 |
| #14 | 3 | 2 | $822 |
| #15 | 3 | 2 | $822 |
| #16 | 3 | 2 | $822 |
| #17 | 3 | 2 | $822 |
| #18 | 3 | 2 | $822 |
| #19 | 3 | 2 | $822 |
| #20 | 3 | 2 | $822 |
| #21 | 3 | 2 | $822 |
| #22 | 3 | 2 | $822 |
| #23 | 3 | 2 | $822 |
| #24 | 3 | 2 | $822 |
| #25 | 3 | 2 | $822 |
| #26 | 3 | 2 | $822 |
| #27 | 3 | 2 | $822 |
| #28 | 3 | 2 | $822 |
| #29 | 3 | 2 | $822 |
| #30 | 3 | 2 | $822 |
| #31 | 3 | 2 | $822 |
| #32 | 3 | 2 | $822 |
| #33 | 3 | 2 | $822 |
| #34 | 3 | 2 | $822 |
| #35 | 3 | 2 | $822 |
| #36 | 3 | 2 | $822 |
| #37 | 3 | 2 | $822 |
| #38 | 3 | 2 | $822 |
| #39 | 3 | 2 | $822 |
| #40 | 3 | 2 | $822 |
| #41 | 3 | 2 | $822 |
| #42 | 3 | 2 | $822 |
| #43 | 3 | 2 | $822 |
| #44 | 3 | 2 | $822 |
| #45 | 3 | 2 | $822 |
| Total (45 units) | $36,989 | ||
UW: 25.0% down · 7.5% · 30yr · 1.5% tax · 5.0% vac · 8.0% maint · 8.0% mgmt
Financing live
Cash to close
- Down payment
- $725,000
- Closing costs
- $87,000
- Reserves months
- —
- Total cash needed
- —
Loan-product check · same deal, 3 products live
Conventional
25% down · 7.5% · 30yr
- Down + closing
- —
- Monthly P&I
- —
- Monthly cashflow
- —
- DSCR
- —
- Eligible?
- —
Personal DTI + credit; lowest rate.
DSCR
20% down · 8.5% · 30yr
- Down + closing
- —
- Monthly P&I
- —
- Monthly cashflow
- —
- DSCR
- —
- Eligible?
- —
No personal income docs; deal must DSCR.
Hard money
10% down · 12.0% · 12mo
- Down + closing
- —
- Monthly P&I
- —
- Monthly cashflow
- —
- DSCR
- —
- Eligible?
- —
Short-term bridge; refi at stabilization.
Listing history 18 events
-
2026-06-18days on market $2,900,000 Active 62 DOM
-
2026-06-17days on market $2,900,000 Active 61 DOM
-
2026-06-16days on market $2,900,000 Active 60 DOM
-
2026-06-15days on market $2,900,000 Active 59 DOM
-
2026-06-13days on market $2,900,000 Active 57 DOM
-
2026-06-12days on market $2,900,000 Active 56 DOM
-
2026-06-09days on market $2,900,000 Active 53 DOM
-
2026-06-08days on market $2,900,000 Active 52 DOM
-
2026-06-07days on market $2,900,000 Active 51 DOM
-
2026-06-07days on market $2,900,000 Active 50 DOM
-
2026-06-04days on market $2,900,000 Active 47 DOM
-
2026-06-02days on market $2,900,000 Active 46 DOM
-
2026-06-01days on market $2,900,000 Active 45 DOM
-
2026-05-31days on market $2,900,000 Active 44 DOM
-
2026-04-17$2,900,000 Active 881-char remark
Show marketing remark (881 chars)
Start or expand your investment portfolio with this 16±/- acre Mobile Home Park located in Pike County, MS. This well-maintained property features 45 mobile homes, all 100% occupied, showcasing strong and consistent rental demand. Each unit offers 3 bedrooms and 2 baths, built between 1999 and 2016, providing modern layouts and dependable tenant appeal. Situated within the highly sought-after North Pike School District, this investment delivers immediate income potential and long-term growth. Additional highlights include two parking spaces per unit, a no-pet policy (inside or outside units), and a waiting list for future openings, further proof of the park's solid performance. Notice required for all showings. 45 mobile homes not enough? Consider An additional 53 dwelling mobile home park on 20+/- acres just across the way listed separately with so many extras!
-
2026-04-16historical
-
2026-03-09price $2,900,000
-
2025-10-29$3,200,000 Active
ⓘ Source: listings_history table (triggers on properties + properties_extension) + one-shot
backfill from property_details.listing_events for pre-trigger history.
Climate risk First Street
- Flood 1/10 Low FEMA zone X (unshaded) · 0% chance over 30 yrs
- Wildfire 7/10 Severe
- Heat 8/10 Severe 7 d/yr ≥108°F today · 22 d/yr by 30 yrs out
- Wind 8/10 Severe 99% chance of damaging wind over 30 yrs
- Air quality 1/10 Low 0 unhealthy d/yr today · 0 by 30 yrs out
Nearby sold comps map
Loading sold comps map…
Walkable amenities ~0.75 mi
Loading nearby amenities…
Taxation est. · year 1
- Rental income
- $443,868
- − Mortgage interest
- −$162,445
- − Property taxes
- −$43,500
- − Insurance
- −$14,500
- − Repairs & maintenance
- −$35,509
- − Management
- −$35,509
- − Depreciation
- −$84,364
- Taxable income
- $68,040
- Est. tax owed @ 24.0%
- −$16,330
- After-tax cash flow
- $93,831/yr
For passive investors: Depreciation is non-cash, so a rental often shows a tax loss while cash-flowing — sheltering income. Rental losses are passive: they offset passive income freely, and up to $25,000/yr can offset ordinary (W-2) income if you actively participate and your MAGI is under $100k (phasing out to $0 by $150k); unused losses carry forward. On sale, claimed depreciation is recaptured at up to 25%, and gains may owe capital-gains tax (a 1031 exchange can defer both). Figures are a year-1 estimate at your 24.0% rate — not tax advice; consult a CPA.
Condition & rehab AI · 6 photos
This multi-family mobile home park requires moderate repairs and maintenance to improve its condition and value. A fresh paint job, landscaping improvements, and HVAC maintenance can significantly enhance its curb appeal and rental potential.
Repairs flagged
- Major exterior paint — Peeling paint indicates significant wear and tear.
- Moderate roof inspection — No visible damage, but may need inspection for leaks or damage.
- Major flooring replacement — Worn flooring may need replacement for a better living experience.
- Major interior wall repainting — Significant discoloration and wear on interior walls.
- Minor HVAC maintenance — No visible signs of major issues, but may need maintenance.
- Minor landscaping maintenance — Basic landscaping with some overgrown areas, may need trimming and planting.
Value-add opportunities
- Both exterior paint job — Fresh paint can improve curb appeal and home value.
- Both landscaping improvements — Well-maintained landscaping can enhance curb appeal and attract tenants.
- Rental HVAC maintenance — Regular maintenance ensures reliable operation and tenant satisfaction.
- Both interior wall repainting — Fresh paint can improve the home's appearance and attract tenants.
- Both flooring replacement — New flooring can improve the home's appearance and attract tenants.
- Both roof inspection — A thorough inspection can prevent costly repairs and ensure the home's safety.
Renovation cost estimate screening
| Repair item | Severity | Est. cost |
|---|---|---|
| exterior paint · Peeling paint indicates significant wear and tear. | Major | $15,000–50,000 |
| roof inspection · No visible damage, but may need inspection for leaks or damage. | Moderate | $3,000–15,000 |
| flooring replacement · Worn flooring may need replacement for a better living experience. | Major | $15,000–50,000 |
| interior wall repainting · Significant discoloration and wear on interior walls. | Major | $15,000–50,000 |
| HVAC maintenance · No visible signs of major issues, but may need maintenance. | Minor | $500–3,000 |
| landscaping maintenance · Basic landscaping with some overgrown areas, may need trimming and planting. | Minor | $500–3,000 |
| Total estimated repair cost · 6 items | $49,000–171,000 |
Value-add ROI direction
- Both exterior paint job — Fresh paint can improve curb appeal and home value. ↑
- Both landscaping improvements — Well-maintained landscaping can enhance curb appeal and attract tenants. ↑
- Rental HVAC maintenance — Regular maintenance ensures reliable operation and tenant satisfaction. ↑
- Both interior wall repainting — Fresh paint can improve the home's appearance and attract tenants. ↑
- Both flooring replacement — New flooring can improve the home's appearance and attract tenants. ↑
- Both roof inspection — A thorough inspection can prevent costly repairs and ensure the home's safety. ↑
ⓘ Cost ranges are severity-bucket heuristics (US national rule-of-thumb). Get contractor quotes + a written scope before underwriting a rehab budget.
Schools (NCES district)
- District
- North Pike School District
- NCES district ID
- 2803240
- Math proficiency
- 25% ▼ -18.00%
- Reading proficiency
- 32% ▼ -9.00%
- Median HH income
- $41,558
- Composite
- 24.13/100
- National rank
- #7748
- State rank
- #69 of 130 in MS
Livability — Fernwood
No livability data for this city. (Only ~50 U.S. cities are tracked.)
Census & demographics
- Population (ZIP)
- 19,767
Population outlook (Pike County) Hauer SSP2
- Today (2025)
- 38,766 people
- By 2030
- 37,874 · -2.3%
- By 2040
- 35,743 · -7.8%
- By 2050
- 33,276 · -14.2%
- By 2075
- 26,799 · -30.9%
- By 2100
- 18,562 · -52.1%
Race, ethnicity, and origin ACS 2023
- Neighborhood character
- Majority Black (64%)
- Race & ethnicity
- Black 64% White 32% Two or more races 2% Hispanic / Latino 2%
- Common ancestry
- Slovak 2% Lithuanian 1% Italian 1%
- Foreign-born
- 1%
- Languages at home
- 98% English-only · Spanish 1%
Political lean MEDSL · Pike
- 2024 margin
- Toss-up / Even · D 47.8% · R 51.3%
- 2008→2024 swing
- -7.0pp toward R · 2008: 3.5pp · 2024: -3.5pp
- All cycles
- 2024: R+3.5 2020: D+1.0 2016: R+0.7 2012: D+7.6 2008: D+3.5
Not yet ingested
- Civics
- —
Market trends
- HPI YoY
- ▼ -88.61%
- Current HPI
- 92.2495
- Rent YoY
- —
- Metro
- —
- State GDP YoY
- —
- F500 in state
- 0
Price history
-9.4% since first listed4 events — show timeline
- 2026-04-17 Listed $2,900,000 MLSU
- 2026-04-16 Listing Removed — MLSU
- 2026-03-09 Price Changed $2,900,000 MLSU
- 2025-10-29 Listed $3,200,000 MLSU
Cash-flow waterfall
monthlySold comps — $/sqft
last 12 mo · ≤1 miLoading sold comps…