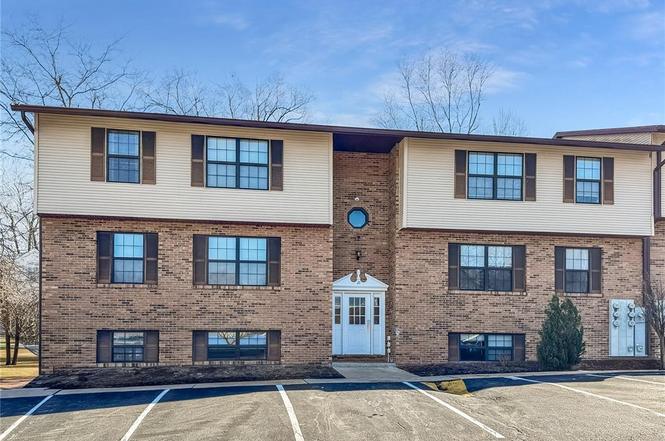
21 Village West Ct #102 · Washington, MO
Flood risk 4/10 · Minor
- FEMA flood zone
- X (unshaded)
- Chance of flooding over 30 yrs
- 0.22%
- Est. flood insurance / yr
- $507 – $1,088
Fire risk 1/10 · Minimal
- Est. fire insurance / yr
- $1,054 – $1,958
Heat risk 5/10 · Moderate
- Hot days now (above 108°F)
- 7 days/yr
- Hot days in 30 yrs
- 20 days/yr
Wind risk 2/10 · Minimal
- Chance of severe wind over 30 yrs
- 1.0%
Air-quality risk 1/10 · Minimal
- Unhealthy air days now
- 0 days/yr
- Unhealthy air days in 30 yrs
- 0 days/yr
Risk factors via First Street. Map © Google.
Why this score? — see what drove the D grade
The composite is a weighted blend of 9 inputs, each scored 0–100. Each bar is that input's sub-score; the figure is the points it added to the 100-point composite (weight × sub-score).
- Cash flow +12.8/30.0
- ARV discount +7.5/15.0
- 1% rule +4.7/10.0
- Schools +4.2/10.0
- Livability +4.0/5.0
- DSCR +3.8/10.0
- Rent growth +2.5/5.0
- Condition / age +2.5/5.0
- Appreciation +0.0/10.0
$95,000
🖨 Deal sheet (PDF) 📄 Offer letter ✓ Due diligence
Listing remarks
Why continue renting when you can own? Make this inviting condo your new home! This 2-bedroom, 1-bath unit features a comfortable living room, a combined kitchen and dining area, and a convenient utility space. Located on the 1st floor, this condo offers both comfort, convenience, and value. Schedule your showing today! Additional opportunities include 5 individual condos in Village West and a full 6-unit building (MLS #26007623).
Key facts
- $158 HOA
- 2 parking spots
- Built 1984
Property features AI
Finance
- Financial info: Lease not considered
- HOA & community: HOA: Village West; Monthly association fee of $158; HOA fee includes insurance; Association reports no amenities
Exterior
- Parking: 2 parking spaces; Asphalt parking surface; No carport
- Utilities: Public water; Public sewer; Single-phase electric; Cable available; Electricity connected; Sewer connected
- Home design: Attached condominium; Residential property; Apartment building structure; One level
- Construction: Brick and vinyl siding exterior; Asphalt roof
- Exterior features: Level lot; City street frontage; Asphalt road
Interior
- Kitchen: Microwave; Range; Refrigerator
- Bedrooms: 2 bedrooms (both on the main level)
- Flooring: Carpet; Laminate
- Bathrooms: 1 full bathroom
- Heating & cooling: Electric forced-air heating; Central air conditioning; Ceiling fan(s)
- Interior features: Updated/remodeled condition; Ceiling fan(s); Central air
- Laundry & utility: Electric heating with forced air
Neighborhood map
What this means for you Summary
Snapshot
- This is a 2-bed/1.0-bath condo listed at $95k.
Deal economics
- At list price, monthly cash flow is $-8 ($-99/yr) — negative.
- To cash-flow at today's rent, offer at most $94k (1.5% below list).
- To meet the 1% rule (rent ≥ 1% of price), the offer needs to be $92k (2.8% below list).
- Recommended offer: $86k (9.0% below list) — sets the bar for market timing.
- Cap rate 6.2% vs local median 2.4% in Washington — top-decile yield for the area; either an underpriced asset or a hidden risk that comps aren't pricing in. Stress-test before assuming the spread holds.
Location & tenants
- Location reads 81/100 on livability (#13 in MO, #1,373 nationally) — a professional / high-income tenant draw. Strengths: amenities A+, cost of living A+, housing A+; Watch: commute F.
- Washington (town): math 41% / reading 55% proficiency, ranked #46 of 324 in MO (top 14%) — families likely to look elsewhere, expect single-tenant / working-renter base with shorter leases.
- Zoned schools: Washington West Elementary (math 45% / reading 53%, grade D, #331 of 1,115 statewide, top 30%, 452 students, 40% FRL); Washington Middle (math 43% / reading 54%, grade C-, #81 of 391 statewide, top 21%, 551 students, 31% FRL); Washington High School (math 29% / reading 73%, grade D+, #109 of 521 statewide, top 21%, 1,322 students, 20% FRL) — zoned schools at 30% FRL track the district average.
- Market conditions: 203 active listings in the ZIP; 4 comparable units currently listed for rent nearby; rentals lingering (median 46d on market — plan ~5-8 weeks vacancy on turnover, expect pricing pressure); 50% of comp listings sitting > 30 days — soft ceiling on asking rent; 614 units permitted in Franklin County in 2024 (100 in 5+ unit buildings).
Forward outlook
- Local home prices are declining (-3.0%/yr); year-one equity from $657 of loan paydown is wiped out by about $3k of value loss. Plan a longer hold.
- Franklin County population projected to shrink 9% by 2050 — rents likely to lag national; underwrite the cash flow, not the appreciation.
Negotiation context
- It's been on market 99 days — a 9% lower offer ($86k) is reasonable based on typical stale-listing flexibility.
- Current owner paid $48k; list at $95k implies a 100% gain — meaningful room to come down on a strong offer.
Risks & watch-outs
- Climate carrying-cost: extreme-heat days projected 7→20/yr by 2055 (HVAC capex compounding) — expect insurance premiums to compound above CPI over the hold.
Questions for the listing agent
- What do current leases actually rent for vs. the listed asking? Can we see a recent rent roll and the last 12 months of T-12 income?
- It's been on market 99 days. Have you received any prior offers? Is the seller open to a 9% concession, seller financing, or rate buy-down credit?
- What does the HOA fee cover, when was the last increase, and are there any pending special assessments or reserve-fund shortfalls?
- Any open or pending special assessments — roof, HVAC, plumbing, elevator, façade? What's the per-unit balance and payoff schedule, and is the seller paying it off at close or rolling it to the buyer?
- Why hasn't it sold? Are there any deal-killer items the seller is aware of (foundation, flood, title, zoning, code violations)?
- Is there a deadline driving the sale (1031 exchange, divorce, estate, relocation)? That informs how much negotiation room exists.
- Schools are B-rated — typically a magnet for longer-tenancy family renters. What's the average tenant stay here, and is there a school-zone premium baked into asking?
- The area grade is low — what's the realistic commute time and amenity access for the typical tenant pool here? Any planned neighborhood developments (good or bad) we should know about?
- What's the average days-on-market for RENTAL listings here right now (not sales)? A rising rental-DOM trend means longer vacancies and softer asking-rent achievability than the comps imply.
- What's the recent tenant-quality profile in this submarket — average credit score on applications, eviction rate, late-payment / NSF rate, and stable-employment percentage? A property-management company in the area should have these aggregated.
- How much new apartment / multifamily construction is in the pipeline within 1–3 miles? Heavy new supply (>2% of stock underway) typically softens rents 12–24 months out; light construction supports rent growth.
Investment metrics
- 1% rule
- 0.97% ✗
- Cap rate
- 6.19%
- Cash-on-cash
- -0.37%
- DSCR
- 0.98
- GRM
- 8.6
CMA / ARV
No comps found within radius.
Projected returns pro-forma
-3.0% appreciation · 3.0% rent growth · sell at horizon
- IRR
- -16.8%
- Equity multiple
- 0.40×
- Total profit
- $-15,855
- Equity at exit
- $14,165
- IRR
- -8.5%
- Equity multiple
- 0.47×
- Total profit
- $-14,223
- Equity at exit
- $8,214
Cash invested: $26,600 (down + closing). Projections, not guarantees.
Landlord ↔ Tenant lean methodology
- Overall (STATE)
- 81 Strongly Landlord-Friendly
- State Missouri
- 81 Strongly Landlord-Friendly · R+10
- County
- — inherits STATE
- City
- — inherits STATE
ZIP-level market 63090
- Active inventory
- 203
- Price-to-rent
- 8.6×
Monthly cashflow live
- Estimated rent
- $923 medium interval (Pro) →
- Mortgage (P&I)
- −$498
- Tax from tax record
- −$42 /mo · $504/yr
- Insurance
- −$40
- HOA
- −$158
- Vacancy / Maint / Mgmt
- −$194
- Net cashflow
- $-8
Break-even live
Sensitivity live
| Price | -10% $46 | -5% $19 | +0% $-8 | +5% $-35 | +10% $-62 |
|---|---|---|---|---|---|
| Rent | -10% $-81 | -5% $-45 | +0% $-8 | +5% $28 | +10% $65 |
| Rate | -1.0pp $40 | -0.5pp $16 | base $-8 | +0.5pp $-33 | +1.0pp $-58 |
UW: 25.0% down · 7.5% · 30yr · 1.5% tax · 5.0% vac · 8.0% maint · 8.0% mgmt
Financing live
Cash to close
- Down payment
- $23,750
- Closing costs
- $2,850
- Reserves months
- —
- Total cash needed
- —
Loan-product check · same deal, 3 products live
Conventional
25% down · 7.5% · 30yr
- Down + closing
- —
- Monthly P&I
- —
- Monthly cashflow
- —
- DSCR
- —
- Eligible?
- —
Personal DTI + credit; lowest rate.
DSCR
20% down · 8.5% · 30yr
- Down + closing
- —
- Monthly P&I
- —
- Monthly cashflow
- —
- DSCR
- —
- Eligible?
- —
No personal income docs; deal must DSCR.
Hard money
10% down · 12.0% · 12mo
- Down + closing
- —
- Monthly P&I
- —
- Monthly cashflow
- —
- DSCR
- —
- Eligible?
- —
Short-term bridge; refi at stabilization.
Rent comps 4 comps
| Address | Beds | Baths | Sqft | Rent | $/sqft | DOM | Units | Dist |
|---|---|---|---|---|---|---|---|---|
| 7 Village West Ct #101 Washington, MO | 2.0 | 1.0 | 1125 | $1,000 | $0.89 | 45d | 1 | 0.09mi |
| 700 W 2nd St #252 Washington, MO | 1.0 | 1.0 | 680 | $795 | $1.17 | 45d | 1 | 0.29mi |
| 221a Elm St Unit B Washington, MO | 2.0 | 1.0 | 825 | $700 | $0.85 | 16d | 1 | 0.42mi |
| 1025 Don Ave Washington, MO | 1.0–3.0 | 1.0–2.0 | 1150 | $1,498 | $1.30 | 0d | 4 | 1.11mi |
HOA detail condo
- Monthly dues
- $158 · $1,896/yr
- Assessments
- None detected in remarks — confirm with the listing agent.
Listing history 5 events
-
2026-05-24status Pending
-
2026-04-29historical Active Under Contract
-
2026-02-14$95,000 Active
-
2005-08-24soldstatus $47,500
-
2004-06-07soldstatus
ⓘ Source: listings_history table (triggers on properties + properties_extension) + one-shot
backfill from property_details.listing_events for pre-trigger history.
Tax reassessment forecast MO · Resets to sale price
- Current annual tax
- $504 · $42/mo
- Projected year-2 tax
- $922 · $77/mo
- Expected delta
- +$418/yr (+$35/mo · 82.9%)
ⓘ Screening estimate from a state-policy table — verify with the county assessor before closing.
Climate risk First Street
- Flood 4/10 Moderate FEMA zone X (unshaded) · 22% chance over 30 yrs
- Wildfire 1/10 Low
- Heat 5/10 Major 7 d/yr ≥108°F today · 20 d/yr by 30 yrs out
- Wind 2/10 Low 100% chance of damaging wind over 30 yrs
- Air quality 1/10 Low 0 unhealthy d/yr today · 0 by 30 yrs out
Nearby sold comps map
Loading sold comps map…
Walkable amenities ~0.75 mi
Loading nearby amenities…
Taxation est. · year 1
- Rental income
- $11,081
- − Mortgage interest
- −$5,321
- − Property taxes
- −$504
- − Insurance
- −$475
- − Repairs & maintenance
- −$887
- − Management
- −$887
- − HOA
- −$1,896
- − Depreciation
- −$2,764
- Taxable loss
- −$1,652
- Est. tax savings @ 24.0%
- +$396
- After-tax cash flow
- $297/yr
For passive investors: Depreciation is non-cash, so a rental often shows a tax loss while cash-flowing — sheltering income. Rental losses are passive: they offset passive income freely, and up to $25,000/yr can offset ordinary (W-2) income if you actively participate and your MAGI is under $100k (phasing out to $0 by $150k); unused losses carry forward. On sale, claimed depreciation is recaptured at up to 25%, and gains may owe capital-gains tax (a 1031 exchange can defer both). Figures are a year-1 estimate at your 24.0% rate — not tax advice; consult a CPA.
Schools (NCES district)
- District
- Washington
- NCES district ID
- 2931110
- Math proficiency
- 41% ▼ -3.00%
- Reading proficiency
- 55% ▼ -1.00%
- Median HH income
- $58,344
- Composite
- 41.87/100
- National rank
- #3372
- State rank
- #46 of 324 in MO
Livability — Washington
- Score
- 81/100
- State rank
- #13
- US rank
- #1373
Category grades
Schools grade is shown separately in the Schools card above.
Census & demographics
- Census place
- Washington, MO
- Population (ZIP)
- 22,471
Population outlook (Franklin County) Hauer SSP2
- Today (2025)
- 103,600 people
- By 2030
- 103,298 · -0.3%
- By 2040
- 100,607 · -2.9%
- By 2050
- 94,280 · -9.0%
- By 2075
- 77,103 · -25.6%
- By 2100
- 54,405 · -47.5%
Race, ethnicity, and origin ACS 2023
- Neighborhood character
- Predominantly White (93%)
- Race & ethnicity
- White 93% Two or more races 6% Hispanic / Latino 1%
- Common ancestry
- Lithuanian 3% Romanian 3% Slovak 2%
- Foreign-born
- 1% · Canada
- Languages at home
- 99% English-only · German/W. Germanic 1%
Political lean MEDSL · Franklin
- 2024 margin
- Solid R (+45.9) · D 26.5% · R 72.4% · Other 1.1%
- 2008→2024 swing
- -33.5pp toward R · 2008: -12.4pp · 2024: -45.9pp
- All cycles
- 2024: R+45.9 2020: R+43.8 2016: R+46.1 2012: R+27.9 2008: R+12.4
Not yet ingested
- Civics
- —
Market trends
- HPI YoY
- ▼ -96.53%
- Current HPI
- 175.3309
- Rent YoY
- —
- Metro
- —
- State GDP YoY
- ▲ 1.84%
- F500 in state
- 20
Industry mix (Fortune 500 HQ in MO)
| Industry | F500 HQs | Revenue |
|---|---|---|
| Healthcare | 1 | $163B |
|
||
| Insurance | 1 | $21B |
|
||
| Industrial Technology | 1 | $17B |
|
||
| Retail | 1 | $16B |
|
||
| Industrial Distribution | 1 | $10B |
|
||
| Utilities | 1 | $9B |
|
||
Price history
+100.0% since first listed5 events — show timeline
- 2026-05-24 Pending — MARIS as Distributed by MLS Grid
- 2026-04-29 Contingent — MARIS as Distributed by MLS Grid
- 2026-02-14 Listed $95,000 MARIS as Distributed by MLS Grid
- 2005-08-24 Sold (Public Records) $47,500 Public Records
- 2004-06-07 Sold (Public Records) — Public Records
Property tax history
+2.9%/yrLatest (2025): $504 · +6.6% YoY. Source: county tax records.
Cash-flow waterfall
monthlySold comps — $/sqft
last 12 mo · ≤1 miLoading sold comps…