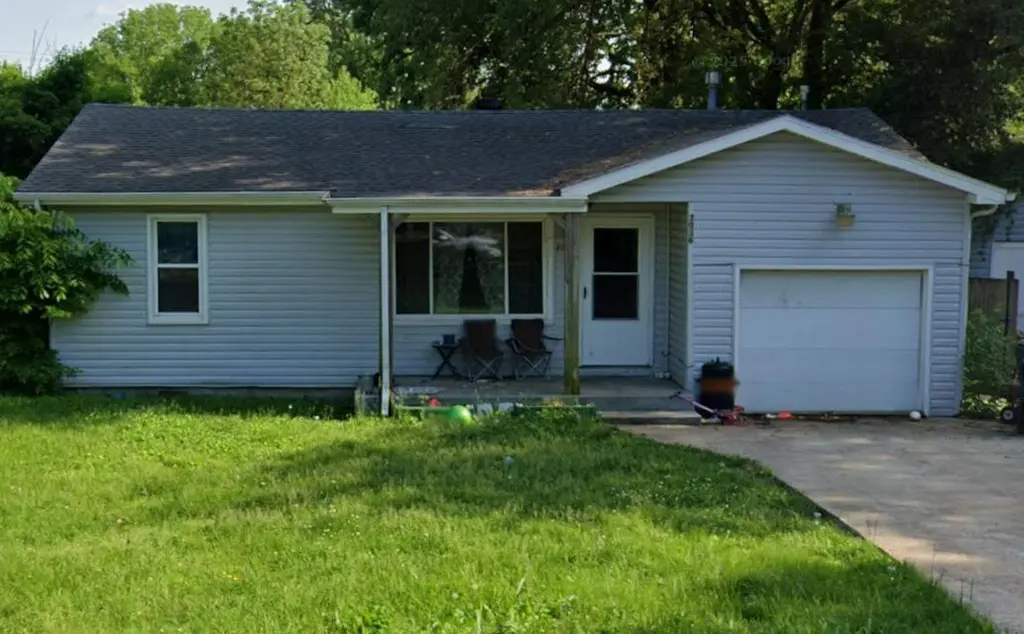
3036 W Water St · Springfield, MO
Flood risk 1/10 · Minimal
- FEMA flood zone
- X (unshaded)
- Chance of flooding over 30 yrs
- 0.0%
- Est. flood insurance / yr
- $507 – $1,088
Fire risk 1/10 · Minimal
- Est. fire insurance / yr
- $1,054 – $1,958
Heat risk 5/10 · Moderate
- Hot days now (above 104°F)
- 7 days/yr
- Hot days in 30 yrs
- 20 days/yr
Wind risk 2/10 · Minimal
- Chance of severe wind over 30 yrs
- —
Air-quality risk 2/10 · Minimal
- Unhealthy air days now
- 1 days/yr
- Unhealthy air days in 30 yrs
- 2 days/yr
Risk factors via First Street. Map © Google.
Why this score? — see what drove the D+ grade
The composite is a weighted blend of 9 inputs, each scored 0–100. Each bar is that input's sub-score; the figure is the points it added to the 100-point composite (weight × sub-score).
- Cash flow +15.2/30.0
- ARV discount +8.9/15.0
- DSCR +4.7/10.0
- Livability +3.8/5.0
- Rent growth +3.7/5.0
- 1% rule +3.2/10.0
- Schools +3.2/10.0
- Condition / age +2.5/5.0
- Appreciation +0.0/10.0
$135,000
🖨 Deal sheet (PDF) 📄 Offer letter ✓ Due diligence
Listing remarks
This home is tenant Occupied please do not bother tenants. You must set up an appointment for showings 48 hours in advance. This home is a great opportunity to start your rental portfolio.
Key facts
- 7,405 sq ft lot
- Garage
- Built 1960
Neighborhood map
What this means for you Summary
Snapshot
- This is a 3-bed/1.5-bath single-family listed at $135k.
Deal economics
- At list price, monthly cash flow is $48 ($576/yr) — positive.
- The deal already cash-flows at list — no discount required.
- To meet the 1% rule (rent ≥ 1% of price), the offer needs to be $110k (18.5% below list).
- Recommended offer: $110k (18.5% below list) — sets the bar for 1% rule.
- Cap rate 6.7% vs local median 4.6% in Springfield — top-decile yield for the area; either an underpriced asset or a hidden risk that comps aren't pricing in. Stress-test before assuming the spread holds.
Location & tenants
- Location reads 75/100 on livability (#57 in MO, #4,121 nationally) — a middle-class / working-renter tenant base. Strengths: commute A+, cost of living A+, housing A+; Watch: crime F, employment F.
- Springfield R-XII (urban): math 32% / reading 46% proficiency, ranked #174 of 324 in MO (top 54%) — families likely to look elsewhere, expect single-tenant / working-renter base with shorter leases.
- Zoned schools: Westport Elem. (math 8% / reading 17%, grade F, #1,007 of 1,115 statewide, top 91%, 384 students, 88% FRL); Westport Middle School (math 12% / reading 29%, grade F, #344 of 391 statewide, top 88%, 433 students, 87% FRL); Central High (math 42% / reading 62%, grade D+, #92 of 521 statewide, top 20%, 1,464 students, 51% FRL) — zoned schools average 75% FRL vs 46% district-wide (29 pts higher); higher-poverty schools than district average — tighter screening recommended.
- Market conditions: Rents rising fast (+4.8%/yr); 520 active listings in the ZIP; 21 comparable units currently listed for rent nearby; rentals at typical pace (median 23d on market — plan ~3-4 weeks tenant-placement turnaround); 1,302 units permitted in Greene County in 2024 (250 in 5+ unit buildings).
Forward outlook
- Local home prices are declining (-3.0%/yr); year-one equity from $933 of loan paydown is wiped out by about $4k of value loss. Plan a longer hold.
- Greene County population projected at +25% by 2050 — long-run rental-demand tailwind backs the buy-and-hold thesis.
Negotiation context
- Only 0 days on market — expect competitive offers; lowballing is unlikely to land.
Risks & watch-outs
- Climate carrying-cost: extreme-heat days projected 7→20/yr by 2055 (HVAC capex compounding) — expect insurance premiums to compound above CPI over the hold.
Questions for the listing agent
- Built in 1960 — when were the roof, HVAC, electrical panel, plumbing, and water heater last replaced?
- Is there a deadline driving the sale (1031 exchange, divorce, estate, relocation)? That informs how much negotiation room exists.
- Crime grade is F in this area — have there been break-ins, vandalism, or insurance claims at this property in the last 3 years? What carrier currently insures it and at what premium?
- The area grade is low — what's the realistic commute time and amenity access for the typical tenant pool here? Any planned neighborhood developments (good or bad) we should know about?
- What's the average days-on-market for RENTAL listings here right now (not sales)? A rising rental-DOM trend means longer vacancies and softer asking-rent achievability than the comps imply.
- What's the recent tenant-quality profile in this submarket — average credit score on applications, eviction rate, late-payment / NSF rate, and stable-employment percentage? A property-management company in the area should have these aggregated.
- How much new for-sale + rental construction is in the pipeline within 1–3 miles? Heavy new supply typically softens prices + rents 12–24 months out; constrained supply supports both.
Investment metrics
- 1% rule
- 0.82% ✗
- Cap rate
- 6.72%
- Cash-on-cash
- 1.52%
- DSCR
- 1.07
- GRM
- 10.2
CMA / ARV
- ARV (on-the-fly)
- $139,360
- Comps found
- 12
Show comp detail 12 sales within ~0.75 mi
| Address | Dist | Beds/Ba | Sqft | Sold | Price | $/sf | Match |
|---|---|---|---|---|---|---|---|
| 3036 W Water St | 0.00mi | 3/1.5 | 1,040 (0%) | 1mo | $135,000 | $130 | 100 |
| 2940 W Walnut St | 0.24mi | 3/2.0 | 1,008 (-3%) | 3mo | $135,000 | $134 | 79 |
| 2928 W Chestnut St | 0.35mi | 3/1.0 | 1,040 (0%) | 3mo | $119,000 | $114 | 79 |
| 2914 W Chestnut St | 0.37mi | 3/1.0 | 1,040 (0%) | 3mo | $129,000 | $124 | 79 |
| 2916 W Chestnut St | 0.36mi | 2/1.0 (-1) | 1,040 (0%) | 3mo | $139,000 | $134 | 74 |
| 3121 W Harrison St | 0.50mi | 3/2.0 | 1,052 (+1%) | 1mo | $187,500 | $178 | 72 |
| 2634 W Phelps St | 0.53mi | 3/1.0 | 1,038 (-0%) | 3mo | $135,000 | $130 | 70 |
| 2919 W Page St | 0.75mi | 3/2.0 | 1,096 (+5%) | 2mo | $176,500 | $161 | 52 |
| 1120 N Colgate Ave | 0.71mi | 3/2.0 | 1,119 (+8%) | 2mo | $210,000 | $188 | 50 |
| 2830 W State St | 0.64mi | 2/1.0 (-1) | 970 (-7%) | 4mo | $164,900 | $170 | 48 |
| 2609 W Brower St | 0.74mi | 2/1.0 (-1) | 1,104 (+6%) | 4mo | $145,000 | $131 | 45 |
| 928 N Glenn Ave | 0.60mi | 4/2.0 (+1) | 1,160 (+12%) | 2mo | $155,000 | $134 | 44 |
Match score weights: distance 35% · size 25% · config 20% · recency 20%. Top-matched comps best support the ARV.
Projected returns pro-forma
-3.0% appreciation · 4.82% rent growth · sell at horizon
- IRR
- -12.1%
- Equity multiple
- 0.56×
- Total profit
- $-16,818
- Equity at exit
- $20,129
- IRR
- -0.8%
- Equity multiple
- 0.94×
- Total profit
- $-2,177
- Equity at exit
- $11,672
Cash invested: $37,800 (down + closing). Projections, not guarantees.
Landlord ↔ Tenant lean methodology
- Overall (STATE)
- 81 Strongly Landlord-Friendly
- State Missouri
- 81 Strongly Landlord-Friendly · R+10
- County
- — inherits STATE
- City
- — inherits STATE
ZIP-level market 65802
- Home prices YoY
- -31.9%
- Rents YoY
- 4.8%
- Active inventory
- 520
- Price-to-rent
- 10.2×
Monthly cashflow live
- Estimated rent
- $1,101 high interval (Pro) →
- Mortgage (P&I)
- −$708
- Tax from tax record
- −$57 /mo · $689/yr
- Insurance
- −$56
- HOA
- −$0
- Vacancy / Maint / Mgmt
- −$231
- Net cashflow
- $48
Break-even live
Sensitivity live
| Price | -10% $124 | -5% $86 | +0% $48 | +5% $10 | +10% $-28 |
|---|---|---|---|---|---|
| Rent | -10% $-39 | -5% $5 | +0% $48 | +5% $91 | +10% $135 |
| Rate | -1.0pp $116 | -0.5pp $82 | base $48 | +0.5pp $13 | +1.0pp $-23 |
UW: 25.0% down · 7.5% · 30yr · 1.5% tax · 5.0% vac · 8.0% maint · 8.0% mgmt
Financing live
Cash to close
- Down payment
- $33,750
- Closing costs
- $4,050
- Reserves months
- —
- Total cash needed
- —
Loan-product check · same deal, 3 products live
Conventional
25% down · 7.5% · 30yr
- Down + closing
- —
- Monthly P&I
- —
- Monthly cashflow
- —
- DSCR
- —
- Eligible?
- —
Personal DTI + credit; lowest rate.
DSCR
20% down · 8.5% · 30yr
- Down + closing
- —
- Monthly P&I
- —
- Monthly cashflow
- —
- DSCR
- —
- Eligible?
- —
No personal income docs; deal must DSCR.
Hard money
10% down · 12.0% · 12mo
- Down + closing
- —
- Monthly P&I
- —
- Monthly cashflow
- —
- DSCR
- —
- Eligible?
- —
Short-term bridge; refi at stabilization.
Rent comps 21 comps
| Address | Beds | Baths | Sqft | Rent | $/sqft | DOM | Units | Dist |
|---|---|---|---|---|---|---|---|---|
| 250 N Hilton Ave Springfield, MO | 2.0 | 2.0 | 1153 | $628 | $0.54 | 15d | 1 | 0.18mi |
| 3028 W Walnut St Springfield, MO | 2.0 | 1.0 | 975 | $850 | $0.87 | 23d | 1 | 0.22mi |
| 3002 W Elm St Springfield, MO | 3.0 | 2.0 | 1128 | $1,295 | $1.15 | 23d | 1 | 0.30mi |
| 2854 W Walnut St Springfield, MO | 3.0 | 1.0 | 945 | $995 | $1.05 | 23d | 1 | 0.32mi |
| 547 S Hilton Ave Springfield, MO | 3.0 | 1.0 | 1008 | $1,175 | $1.17 | 45d | 1 | 0.46mi |
| 922 N Glenn Ave Springfield, MO | 2.0 | 1.0 | 780 | $1,100 | $1.41 | 45d | 1 | 0.59mi |
| 2602 W College St Springfield, MO | 2.0 | 1.0 | 1350 | $995 | $0.74 | 15d | 1 | 0.59mi |
| 2541 W Lincoln St Springfield, MO | 2.0 | 1.0 | 1034 | $975 | $0.94 | 45d | 1 | 0.72mi |
| 741 N West Ave Springfield, MO | 2.0 | 1.0 | 912 | $950 | $1.04 | 45d | 1 | 0.82mi |
| 2412 W Lincoln St Springfield, MO | 3.0 | 1.0 | 1260 | $1,295 | $1.03 | 25d | 1 | 0.84mi |
| 740 N West Ave Springfield, MO | 3.0 | 1.0 | 900 | $995 | $1.11 | 25d | 1 | 0.85mi |
| 412 S Duke Ave Springfield, MO | 3.0 | 1.0 | 1400 | $1,585 | $1.13 | 15d | 1 | 0.91mi |
| 3016 W Hovey St Springfield, MO | 3.0 | 2.0 | 1059 | $1,350 | $1.27 | 45d | 1 | 0.95mi |
| 1020 S Clifton Ave Springfield, MO | 2.0 | 2.0 | 1010 | $950 | $0.94 | 25d | 1 | 1.13mi |
| 1152 S Hillcrest Ave Springfield, MO | 3.0 | 1.5 | 1240 | $1,300 | $1.05 | 45d | 1 | 1.16mi |
| 2204 W Madison St Springfield, MO | 3.0 | 1.0 | 960 | $1,095 | $1.14 | 15d | 1 | 1.17mi |
| 1040 S Clifton Ave Springfield, MO | 2.0 | 2.0 | 1010 | $945 | $0.94 | 15d | 1 | 1.18mi |
| 1740 W Olive St Springfield, MO | 3.0 | 1.0 | 736 | $1,195 | $1.62 | 15d | 1 | 1.30mi |
| 3031 W Pacific St Springfield, MO | 3.0 | 1.5 | 1008 | $1,295 | $1.28 | 23d | 1 | 1.31mi |
| 4149 W Burbank St Unit A Springfield, MO | 2.0 | 1.0 | 1000 | $900 | $0.90 | 45d | 1 | 1.39mi |
| 1365 S Scenic Ave Springfield, MO | 3.0 | 2.0 | 1328 | $1,550 | $1.17 | 15d | 1 | 1.44mi |
Listing history 7 events
-
2026-04-17$135,000
-
2026-04-17historical
-
2019-03-05soldstatus
-
2017-09-20soldstatus
-
2010-11-15soldstatus
-
2005-08-02soldstatus
-
2005-03-07soldstatus
ⓘ Source: listings_history table (triggers on properties + properties_extension) + one-shot
backfill from property_details.listing_events for pre-trigger history.
Tax reassessment forecast MO · Resets to sale price
- Current annual tax
- $689 · $57/mo
- Projected year-2 tax
- $1,310 · $109/mo
- Expected delta
- +$620/yr (+$52/mo · 90.1%)
ⓘ Screening estimate from a state-policy table — verify with the county assessor before closing.
Climate risk First Street
- Flood 1/10 Low FEMA zone X (unshaded) · 0% chance over 30 yrs
- Wildfire 1/10 Low
- Heat 5/10 Major 7 d/yr ≥104°F today · 20 d/yr by 30 yrs out
- Wind 2/10 Low
- Air quality 2/10 Low 1 unhealthy d/yr today · 2 by 30 yrs out
Nearby sold comps map
Loading sold comps map…
Walkable amenities ~0.75 mi
Loading nearby amenities…
Taxation est. · year 1
- Rental income
- $13,210
- − Mortgage interest
- −$7,562
- − Property taxes
- −$689
- − Insurance
- −$675
- − Repairs & maintenance
- −$1,057
- − Management
- −$1,057
- − Depreciation
- −$3,927
- Taxable loss
- −$1,757
- Est. tax savings @ 24.0%
- +$422
- After-tax cash flow
- $998/yr
For passive investors: Depreciation is non-cash, so a rental often shows a tax loss while cash-flowing — sheltering income. Rental losses are passive: they offset passive income freely, and up to $25,000/yr can offset ordinary (W-2) income if you actively participate and your MAGI is under $100k (phasing out to $0 by $150k); unused losses carry forward. On sale, claimed depreciation is recaptured at up to 25%, and gains may owe capital-gains tax (a 1031 exchange can defer both). Figures are a year-1 estimate at your 24.0% rate — not tax advice; consult a CPA.
Schools (NCES district)
- District
- Springfield R-XII
- NCES district ID
- 2928860
- Math proficiency
- 32% ▼ -2.00%
- Reading proficiency
- 46% ▼ -3.00%
- Median HH income
- $37,886
- Composite
- 32.45/100
- National rank
- #5717
- State rank
- #174 of 324 in MO
Livability — Springfield
- Score
- 75/100
- State rank
- #57
- US rank
- #4121
Category grades
Schools grade is shown separately in the Schools card above.
Census & demographics
- Census place
- Springfield, MO
- County
- Greene County · 244,327 people
- City population
- 223,044
- Metro
- Springfield, MO
- Population (ZIP)
- 46,739
- Household income
- $55,019
- Rent vs Own
- Severe rent burden
- 1818.0
Population outlook (Greene County) Hauer SSP2
- Today (2025)
- 319,054 people
- By 2030
- 335,135 · +5.0%
- By 2040
- 366,186 · +14.8%
- By 2050
- 397,431 · +24.6%
- By 2075
- 477,035 · +49.5%
- By 2100
- 520,828 · +63.2%
Race, ethnicity, and origin ACS 2023
- Neighborhood character
- Predominantly White (81%)
- Race & ethnicity
- White 81% Two or more races 8% Hispanic / Latino 5% Black 4% Asian 2%
- Common ancestry
- Slovak 2% Lithuanian 2% Italian 2%
- Foreign-born
- 3% · Canada, Vietnam
- Languages at home
- 95% English-only · Spanish 2% Vietnamese 1% Other Indo-European 1%
Political lean MEDSL · Greene
- 2024 margin
- Strong R (+20.8) · D 38.9% · R 59.7% · Other 1.4%
- 2008→2024 swing
- -5.0pp toward R · 2008: -15.8pp · 2024: -20.8pp
- All cycles
- 2024: R+20.8 2020: R+20.1 2016: R+27.4 2012: R+24.4 2008: R+15.8
Not yet ingested
- Civics
- —
Market trends
- HPI YoY
- ▼ -99.72%
- Current HPI
- 212.9826
- Rent YoY
- ▲ 4.82%
- Metro
- Springfield, MO
- State GDP YoY
- ▲ 1.84%
- F500 in state
- 20
Industry mix (Fortune 500 HQ in MO)
| Industry | F500 HQs | Revenue |
|---|---|---|
| Healthcare | 1 | $163B |
|
||
| Insurance | 1 | $21B |
|
||
| Industrial Technology | 1 | $17B |
|
||
| Retail | 1 | $16B |
|
||
| Industrial Distribution | 1 | $10B |
|
||
| Utilities | 1 | $9B |
|
||
Price history
7 events — show timeline
- 2026-04-17 Delisted — SOMO
- 2026-04-17 Listed $135,000 SOMO
- 2019-03-05 Sold (Public Records) — Public Records
- 2017-09-20 Sold (Public Records) — Public Records
- 2010-11-15 Sold (Public Records) — Public Records
- 2005-08-02 Sold (Public Records) — Public Records
- 2005-03-07 Sold (Public Records) — Public Records
Property tax history
+2.3%/yrLatest (2025): $689 · +19.5% YoY. Source: county tax records.
Cash-flow waterfall
monthlySold comps — $/sqft
last 12 mo · ≤1 miLoading sold comps…