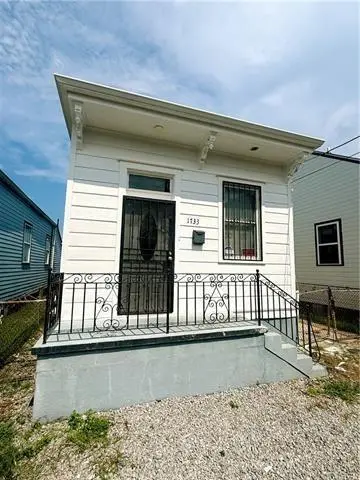
1733 Touro St · New Orleans, LA
Flood risk 8/10 · Major
- FEMA flood zone
- X
- Chance of flooding over 30 yrs
- 0.6%
- Est. flood insurance / yr
- $507 – $1,088
Fire risk 1/10 · Minimal
- Est. fire insurance / yr
- $1,269 – $2,357
Heat risk 10/10 · Severe
- Hot days now (above 108°F)
- 7 days/yr
- Hot days in 30 yrs
- 21 days/yr
Wind risk 10/10 · Severe
- Chance of severe wind over 30 yrs
- 99.0%
Air-quality risk 4/10 · Minor
- Unhealthy air days now
- 4 days/yr
- Unhealthy air days in 30 yrs
- 4 days/yr
Risk factors via First Street. Map © Google.
Why this score? — see what drove the B- grade
The composite is a weighted blend of 9 inputs, each scored 0–100. Each bar is that input's sub-score; the figure is the points it added to the 100-point composite (weight × sub-score).
- Cash flow +25.1/30.0
- ARV discount +15.0/15.0
- DSCR +8.2/10.0
- 1% rule +6.6/10.0
- Livability +4.0/5.0
- Rent growth +2.5/5.0
- Condition / age +2.5/5.0
- Schools +1.6/10.0
- Appreciation +0.0/10.0
$149,900
🖨 Deal sheet 📄 Offer letter ✓ Due diligence
Listing remarks MLS
Great opportunity to own a classic New Orleans shotgun style home in the heart of the New Marigny. Move in ready for primary homeowner or investment opportunity. Recent updates include new flooring, 30 year roof (2019), gutters, new gas lines, updated plumbing, several new windows, and more. Flood Zone X.
Key facts
- 30 year roof
- New flooring
- Flood zone x
Tags
Neighborhood map
What this means for you Summary
Snapshot
- This is a 3-bed/1.0-bath single-family listed at $150k.
Deal economics
- At list price, monthly cash flow is $265 ($3k/yr) — positive.
- The deal already cash-flows at list — no discount required.
- Meets the 1% rule at list price ($2k rent vs $150k).
- Recommended offer: $136k (9.0% below list) — sets the bar for market timing.
- Cap rate 8.9% vs local median 4.4% in New Orleans — top-decile yield for the area; either an underpriced asset or a hidden risk that comps aren't pricing in. Stress-test before assuming the spread holds.
Location & tenants
- Location reads 81/100 on livability (#3 in LA, #1,383 nationally) — a professional / high-income tenant draw. Strengths: amenities A+, commute A+, health & safety A+; Watch: crime C-, employment D.
- Orleans Parish (urban): math 11% / reading 27% proficiency, ranked #69 of 98 in LA (top 70%) — low school quality limits family demand, transient renter base, plan for 1-2y turnover; 68% free/reduced lunch — lower-income household profile, screen leases tightly.
- Market conditions: Rents flat; 350 active listings in the ZIP; 40 comparable units currently listed for rent nearby; rentals at typical pace (median 24d on market — plan ~3-4 weeks tenant-placement turnaround); 710 units permitted in Orleans Parish in 2024 (244 in 5+ unit buildings).
- This rent runs 40% of the median local income ($52k/yr) — at the standard rent-burdened threshold; future hikes will face affordability resistance.
Forward outlook
- Local home prices are declining (-3.0%/yr); year-one equity from $1k of loan paydown is wiped out by about $4k of value loss. Plan a longer hold.
- Orleans County population projected at +61% by 2050 — long-run rental-demand tailwind backs the buy-and-hold thesis.
Negotiation context
- It's been on market 101 days — a 9% lower offer ($136k) is reasonable based on typical stale-listing flexibility.
- 7 sale attempts since 13y ago with the ask held roughly flat each time — persistent listings suggest the price (not the market) is what's stuck; bring a comps-based counter.
- Current owner paid $30k; list at $150k implies a 400% gain — meaningful room to come down on a strong offer.
Risks & watch-outs
- Watch-outs: flood insurance adds $66/mo; built in 1940 — expect roof / HVAC / electrical / plumbing capex.
- Climate carrying-cost: severe flood risk; severe wind risk, 99% chance of damaging wind over 30y; extreme-heat days projected 7→21/yr by 2055 (HVAC capex compounding) — expect insurance premiums to compound above CPI over the hold.
Questions for the listing agent
- It's been on market 101 days. Have you received any prior offers? Is the seller open to a 9% concession, seller financing, or rate buy-down credit?
- Built in 1940 — when were the roof, HVAC, electrical panel, plumbing, and water heater last replaced?
- What's the actual annual flood-insurance premium (NFIP or private), and is the property in a SFHA with mandatory coverage?
- Why hasn't it sold? Are there any deal-killer items the seller is aware of (foundation, flood, title, zoning, code violations)?
- Is there a deadline driving the sale (1031 exchange, divorce, estate, relocation)? That informs how much negotiation room exists.
- What's the average days-on-market for RENTAL listings here right now (not sales)? A rising rental-DOM trend means longer vacancies and softer asking-rent achievability than the comps imply.
- What's the recent tenant-quality profile in this submarket — average credit score on applications, eviction rate, late-payment / NSF rate, and stable-employment percentage? A property-management company in the area should have these aggregated.
- How much new for-sale + rental construction is in the pipeline within 1–3 miles? Heavy new supply typically softens prices + rents 12–24 months out; constrained supply supports both.
Investment metrics
- 1% rule
- 1.16% ✓
- Cap rate
- 8.95%
- Cash-on-cash
- 9.49%
- DSCR
- 1.42
- GRM
- 7.2
CMA / ARV
- ARV (median comp)
- $246,600
- List price
- $149,900
- Delta
- -39.21%
- Verdict
- UNDERPRICED
- Comps
- 20 within 1.0 mi
Show comp detail 12 sales within ~0.75 mi
| Address | Dist | Beds/Ba | Sqft | Sold | Price | $/sf | Match |
|---|---|---|---|---|---|---|---|
| 1735 Touro St | 0.01mi | 4/2.5 (+1) | 1,368 (-5%) | 6mo | $186,000 | $136 | 75 |
| 1625 Frenchmen St | 0.11mi | 3/2.0 | 1,252 (-13%) | 5mo | $170,000 | $136 | 65 |
| 2102 Saint Anthony St | 0.29mi | 3/2.0 | 1,575 (+9%) | 6mo | $35,000 | $22 | 62 |
| 1609 Marais St | 0.46mi | 3/2.0 | 1,345 (-7%) | 4mo | $245,000 | $182 | 60 |
| 1311 Frenchmen St | 0.32mi | 3/2.0 | 1,300 (-10%) | 7mo | $225,000 | $173 | 59 |
| 1607 N Villere St | 0.39mi | 3/2.0 | 1,550 (+8%) | 8mo | $299,000 | $193 | 58 |
| 1230 Annette St | 0.48mi | 3/2.0 | 1,309 (-9%) | 2mo | $280,000 | $214 | 57 |
| 1020 Kerlerec St | 0.65mi | 2/2.0 (-1) | 1,508 (+5%) | 2mo | $429,000 | $284 | 51 |
| 2112 St. Roch Ave | 0.47mi | 2/2.5 (-1) | 1,625 (+13%) | 0mo | $285,000 | $175 | 45 |
| 2320 Marais St | 0.53mi | 2/2.0 (-1) | 1,280 (-11%) | 5mo | $250,000 | $195 | 44 |
| 2007 Kerlerec St | 0.73mi | 3/2.0 | 1,570 (+9%) | 8mo | $365,000 | $232 | 41 |
| 2411 Republic St | 0.74mi | 3/2.0 | 1,310 (-9%) | 8mo | $212,500 | $162 | 40 |
Match score weights: distance 35% · size 25% · config 20% · recency 20%. Top-matched comps best support the ARV.
Projected returns pro-forma
-3.0% appreciation · 0.18% rent growth · sell at horizon
- IRR
- -8.1%
- Equity multiple
- 0.71×
- Total profit
- $-12,122
- Equity at exit
- $22,351
- IRR
- -2.9%
- Equity multiple
- 0.83×
- Total profit
- $-7,134
- Equity at exit
- $12,961
Cash invested: $41,972 (down + closing). Projections, not guarantees.
Landlord ↔ Tenant lean methodology
- Overall (STATE)
- 90 Strongly Landlord-Friendly
- State Louisiana
- 90 Strongly Landlord-Friendly · R+12
- County
- — inherits STATE
- City
- — inherits STATE
ZIP-level market 70116
- Home prices YoY
- -34.5%
- Rents YoY
- 0.2%
- Active inventory
- 350
- Price-to-rent
- 7.2×
Monthly cashflow live
- Estimated rent
- $1,741 high interval (Pro) →
- Mortgage (P&I)
- −$786
- Tax from tax record
- −$195 /mo · $2,339/yr
- Insurance
- −$62
- Flood insurance flood zone
- −$66 /mo · $798/yr
- HOA
- −$0
- Vacancy / Maint / Mgmt
- −$366
- Net cashflow
- $265
Break-even live
UW: 25.0% down · 7.5% · 30yr · 1.5% tax · 5.0% vac · 8.0% maint · 8.0% mgmt
Financing live
Cash to close
- Down payment
- $37,475
- Closing costs
- $4,497
- Reserves months
- —
- Total cash needed
- —
Loan-product check · same deal, 3 products live
Conventional
25% down · 7.5% · 30yr
- Down + closing
- —
- Monthly P&I
- —
- Monthly cashflow
- —
- DSCR
- —
- Eligible?
- —
Personal DTI + credit; lowest rate.
DSCR
20% down · 8.5% · 30yr
- Down + closing
- —
- Monthly P&I
- —
- Monthly cashflow
- —
- DSCR
- —
- Eligible?
- —
No personal income docs; deal must DSCR.
Hard money
10% down · 12.0% · 12mo
- Down + closing
- —
- Monthly P&I
- —
- Monthly cashflow
- —
- DSCR
- —
- Eligible?
- —
Short-term bridge; refi at stabilization.
Rent comps 40 comps
| Address | Beds | Baths | Sqft | Rent | $/sqft | DOM | Units | Dist |
|---|---|---|---|---|---|---|---|---|
| 1923 N Robertson St New Orleans, LA | 3.0 | 2.0 | 1051 | $1,950 | $1.86 | 3d | 1 | 0.17mi |
| 1910 Elysian Fields Ave New Orleans, LA | 3.0 | 1.0 | 1000 | $1,450 | $1.45 | 23d | 1 | 0.18mi |
| 1936 N Johnson St Unit 36 New Orleans, LA | 3.0 | 2.0 | 1844 | $2,400 | $1.30 | 23d | 1 | 0.21mi |
| 1938 N Johnson St Unit 38 New Orleans, LA | 3.0 | 2.0 | 1844 | $2,400 | $1.30 | 23d | 1 | 0.21mi |
| 1710 Marigny St New Orleans, LA | 3.0 | 2.0 | 1120 | $1,750 | $1.56 | 23d | 1 | 0.22mi |
| 2220 N Prieur St New Orleans, LA | 3.0 | 2.0 | 1334 | $2,000 | $1.50 | 23d | 1 | 0.23mi |
| 1601 Marigny St Unit 1603 New Orleans, LA | 3.0 | 2.0 | 988 | $1,099 | $1.11 | 3d | 1 | 0.27mi |
| 1603 Marigny St New Orleans, LA | 3.0 | 2.0 | 988 | $1,099 | $1.11 | 3d | 1 | 0.27mi |
| 1730 Allen St New Orleans, LA | 2.0 | 1.0 | 920 | $1,650 | $1.79 | 23d | 1 | 0.28mi |
| 1434 Annette St New Orleans, LA | 2.0 | 1.0 | 1536 | $1,700 | $1.11 | 3d | 1 | 0.28mi |
| 1434 Annette St New Orleans, LA | 2.0 | 1.0 | 1536 | $1,700 | $1.11 | 3d | 1 | 0.28mi |
| 2269 N Derbigny St New Orleans, LA | 2.0 | 2.0 | 1000 | $1,665 | $1.67 | 17d | 1 | 0.29mi |
| 2269 N Derbigny St New Orleans, LA | 2.0 | 2.0 | 1000 | $1,675 | $1.68 | 19d | 1 | 0.29mi |
| 2271 N Derbigny St New Orleans, LA | 2.0 | 2.0 | 1000 | $1,585 | $1.58 | 17d | 1 | 0.29mi |
| 1327 Frenchmen St Unit B New Orleans, LA | 2.0 | 2.5 | 1175 | $1,900 | $1.62 | 23d | 1 | 0.29mi |
| 1726 Mandeville St New Orleans, LA | 2.0 | 1.0 | 920 | $1,300 | $1.41 | 23d | 1 | 0.29mi |
| 2107 Elysian Fields Ave New Orleans, LA | 4.0 | 2.0 | 1794 | $1,650 | $0.92 | 3d | 1 | 0.31mi |
| 1301 Frenchmen St Unit 2B New Orleans, LA | 2.0 | 1.0 | 940 | $1,299 | $1.38 | 23d | 1 | 0.32mi |
| 1811 New Orleans St New Orleans, LA | 2.0 | 2.0 | 900 | $1,700 | $1.89 | 3d | 1 | 0.32mi |
| 2115 Elysian Fields Ave Unit 2115 New Orleans, LA | 3.0 | 1.0 | 1100 | $1,450 | $1.32 | 23d | 1 | 0.33mi |
| 2103 Urquhart St New Orleans, LA | 2.0 | 1.0 | 940 | $1,299 | $1.38 | 23d | 1 | 0.33mi |
| 2024 Mandeville St New Orleans, LA | 2.0 | 2.0 | 1072 | $1,950 | $1.82 | 23d | 1 | 0.37mi |
| 2239 Saint Anthony St New Orleans, LA | 2.0 | 1.0 | 900 | $1,100 | $1.22 | 23d | 1 | 0.39mi |
| 1136 Frenchmen St New Orleans, LA | 2.0 | 1.0 | 1000 | $1,550 | $1.55 | 3d | 1 | 0.41mi |
| 1136 Frenchmen St New Orleans, LA | 2.0 | 1.0 | 1000 | $1,550 | $1.55 | 3d | 1 | 0.41mi |
| 1136 Frenchmen St New Orleans, LA | 2.0 | 1.0 | 1800 | $1,650 | $0.92 | 23d | 1 | 0.41mi |
| 1134 Frenchmen St New Orleans, LA | 2.0 | 1.0 | 900 | $1,550 | $1.72 | 3d | 1 | 0.41mi |
| 1134 Frenchmen St New Orleans, LA | 2.0 | 1.0 | 900 | $1,550 | $1.72 | 3d | 1 | 0.41mi |
| 2104 Marais St Unit 2106 New Orleans, LA | 2.0 | 2.0 | 936 | $2,000 | $2.14 | 23d | 1 | 0.41mi |
| 2311 Saint Anthony St Unit 1A New Orleans, LA | 2.0 | 1.0 | 1100 | $1,450 | $1.32 | 23d | 1 | 0.42mi |
| 2115 Mandeville St New Orleans, LA | 3.0 | 2.0 | 1400 | $1,650 | $1.18 | 23d | 1 | 0.42mi |
| 2109 A P Tureaud Ave New Orleans, LA | 2.0 | 1.0 | 936 | $1,450 | $1.55 | 14d | 1 | 0.47mi |
| 3110 Pauger St New Orleans, LA | 2.0 | 2.0 | 992 | $1,300 | $1.31 | 23d | 1 | 0.48mi |
| 1809 Saint Roch Ave New Orleans, LA | 3.0 | 1.0 | 949 | $1,195 | $1.26 | 17d | 1 | 0.48mi |
| 2338 Annette St Unit 1 New Orleans, LA | 3.0 | 1.0 | 1150 | $1,400 | $1.22 | 20d | 1 | 0.49mi |
| 1636 Music St New Orleans, LA | 3.0 | 1.0 | 900 | $1,185 | $1.32 | 16d | 1 | 0.50mi |
| 1638 Music St New Orleans, LA | 2.0 | 1.0 | 900 | $1,085 | $1.21 | 14d | 1 | 0.50mi |
| 2120 Saint Roch Ave Unit 2120 New Orleans, LA | 2.0 | 1.0 | 1000 | $1,650 | $1.65 | 23d | 1 | 0.50mi |
| 1472 N Claiborne Ave New Orleans, LA | 3.0 | 1.0 | 1312 | $1,900 | $1.45 | 16d | 1 | 0.52mi |
| 1940 N Rampart St Unit 101 New Orleans, LA | 2.0 | 2.0 | 1150 | $2,500 | $2.17 | 43d | 1 | 0.54mi |
Listing history 36 events
-
2026-06-18days on market $149,900 Active 101 DOM
-
2026-06-17days on market $149,900 Active 100 DOM
-
2026-06-16days on market $149,900 Active 99 DOM
-
2026-06-15days on market $149,900 Active 98 DOM
-
2026-06-13days on market $149,900 Active 96 DOM
-
2026-06-10days on market $149,900 Active 93 DOM
-
2026-06-09days on market $149,900 Active 92 DOM
-
2026-06-08days on market $149,900 Active 91 DOM
-
2026-06-07days on market $149,900 Active 90 DOM
-
2026-06-05days on market $149,900 Active 87 DOM
-
2026-06-03days on market $149,900 Active 86 DOM
-
2026-06-02days on market $149,900 Active 85 DOM
-
2026-06-01days on market $149,900 Active 84 DOM
-
2026-05-31days on market $149,900 Active 83 DOM
-
2026-03-30price $149,900 306-char remark
Show marketing remark (316 chars)
Great opportunity to own a classic New Orleans shotgun style home in the heart of the New Marigny. Move in ready for primary homeowner or investment opportunity. Recent updates include new flooring, 30 year roof (2019), gutters, new gas lines, updated plumbing, several new windows, and more. Flood Zone X.
-
2026-03-30price $149,900 316-char remark
Show marketing remark (316 chars)
Great opportunity to own a classic New Orleans shotgun style home in the heart of the New Marigny. Move in ready for primary homeowner or investment opportunity. Recent updates include new flooring, 30 year roof (2019), gutters, new gas lines, updated plumbing, several new windows, and more. Flood Zone X.
-
2026-03-09$154,900 Active 306-char remark
Show marketing remark (316 chars)
Great opportunity to own a classic New Orleans shotgun style home in the heart of the New Marigny. Move in ready for primary homeowner or investment opportunity. Recent updates include new flooring, 30 year roof (2019), gutters, new gas lines, updated plumbing, several new windows, and more. Flood Zone X.
-
2026-03-09$154,900 Active 316-char remark
Show marketing remark (316 chars)
Great opportunity to own a classic New Orleans shotgun style home in the heart of the New Marigny. Move in ready for primary homeowner or investment opportunity. Recent updates include new flooring, 30 year roof (2019), gutters, new gas lines, updated plumbing, several new windows, and more. Flood Zone X.
-
2026-01-30price $154,900
-
2026-01-29price $154,900
-
2025-10-01price $159,000
-
2025-10-01price $159,000
-
2025-08-27$169,000 Active
-
2020-10-07price $149,999
-
2020-08-09$149,999
-
2020-04-30price $159,900
-
2020-03-13price $165,000
-
2020-02-10price $160,000
-
2020-01-16price $169,000
-
2019-11-13price $175,000
-
2019-10-18$159,900
-
2013-11-05soldstatus $30,000
-
2013-05-07$31,000
-
2013-05-07$31,000
-
2012-10-22soldstatus $25,000
-
1995-04-18soldstatus $25,000
ⓘ Source: listings_history table (triggers on properties + properties_extension) + one-shot
backfill from property_details.listing_events for pre-trigger history.
Tax reassessment forecast LA · Resets to sale price
- Current annual tax
- $2,339 · $195/mo
- Projected year-2 tax
- $2,339 · $195/mo
- Expected delta
- $0/yr ($0/mo · 0.0%)
ⓘ Screening estimate from a state-policy table — verify with the county assessor before closing.
Climate risk First Street
- Flood 8/10 Severe FEMA zone X · 60% chance over 30 yrs
- Wildfire 1/10 Low
- Heat 10/10 Extreme 7 d/yr ≥108°F today · 21 d/yr by 30 yrs out
- Wind 10/10 Extreme 99% chance of damaging wind over 30 yrs
- Air quality 4/10 Moderate 4 unhealthy d/yr today · 4 by 30 yrs out
Nearby sold comps map
Loading sold comps map…
Walkable amenities ~0.75 mi
Loading nearby amenities…
Taxation est. · year 1
- Rental income
- $20,890
- − Mortgage interest
- −$8,397
- − Property taxes
- −$2,339
- − Insurance
- −$1,547
- − Repairs & maintenance
- −$1,671
- − Management
- −$1,671
- − Depreciation
- −$4,361
- Taxable income
- $904
- Est. tax owed @ 24.0%
- −$217
- After-tax cash flow
- $2,967/yr
For passive investors: Depreciation is non-cash, so a rental often shows a tax loss while cash-flowing — sheltering income. Rental losses are passive: they offset passive income freely, and up to $25,000/yr can offset ordinary (W-2) income if you actively participate and your MAGI is under $100k (phasing out to $0 by $150k); unused losses carry forward. On sale, claimed depreciation is recaptured at up to 25%, and gains may owe capital-gains tax (a 1031 exchange can defer both). Figures are a year-1 estimate at your 24.0% rate — not tax advice; consult a CPA.
Schools (NCES district)
- District
- Orleans Parish
- NCES district ID
- 2201170
- Math proficiency
- 11% ▼ -52.00%
- Reading proficiency
- 27% ▼ -46.00%
- Median HH income
- $37,011
- Composite
- 15.78/100
- National rank
- #9271
- State rank
- #69 of 98 in LA
Livability — New Orleans
- Score
- 81/100
- State rank
- #3
- US rank
- #1383
Category grades
Schools grade is shown separately in the Schools card above.
Census & demographics
- Census place
- New Orleans, LA
- County
- Orleans Parish · 338,817 people
- City population
- 338,817
- Metro
- New Orleans-Metairie, LA
- Population (ZIP)
- 10,404
- Household income
- $52,306
- Rent vs Own
- Severe rent burden
- 1001.0
Population outlook (Orleans County) Hauer SSP2
- Today (2025)
- 513,025 people
- By 2030
- 575,781 · +12.2%
- By 2040
- 700,174 · +36.5%
- By 2050
- 826,541 · +61.1%
- By 2075
- 1,123,374 · +119.0%
- By 2100
- 1,355,609 · +164.2%
Race, ethnicity, and origin ACS 2023
- Neighborhood character
- Diverse neighborhood (Simpson 0.63)
- Race & ethnicity
- White 45% Black 40% Hispanic / Latino 10% Two or more races 8%
- Hispanic origin (detail)
- Mexican 1% Cuban 3%
- Common ancestry
- Lithuanian 6% Slovak 3% Romanian 3%
- Foreign-born
- 5% · Canada
- Languages at home
- 90% English-only · Spanish 6% French/Haitian/Cajun 2%
Political lean MEDSL · Orleans
- 2024 margin
- Solid D (+67.0) · D 82.2% · R 15.2% · Other 2.7%
- 2008→2024 swing
- +6.7pp toward D · 2008: 60.3pp · 2024: 67.0pp
- All cycles
- 2024: D+67.0 2020: D+68.2 2016: D+66.2 2012: D+62.5 2008: D+60.3
Not yet ingested
- Civics
- —
Market trends
- HPI YoY
- ▼ -144.83%
- Current HPI
- 275.5453
- Rent YoY
- ▲ 0.18%
- Metro
- New Orleans-Metairie, LA
- State GDP YoY
- ▲ 3.29%
- F500 in state
- 10
Industry mix (Fortune 500 HQ in LA)
| Industry | F500 HQs | Revenue |
|---|---|---|
| Telecommunications | 2 | $23B |
|
||
| Utilities | 1 | $12B |
|
||
| Wholesale / Distribution | 1 | $5B |
|
||
| Advertising | 1 | $2B |
|
||
Price history
+499.6% since first listed22 events — show timeline
- 2026-03-30 Price Changed $149,900 AcadianaMLS
- 2026-03-30 Price Changed $149,900 GSREIN
- 2026-03-09 Listed $154,900 GSREIN
- 2026-03-09 Listed $154,900 AcadianaMLS
- 2026-01-30 Price Changed $154,900 AcadianaMLS
- 2026-01-29 Price Changed $154,900 GSREIN
- 2025-10-01 Price Changed $159,000 AcadianaMLS
- 2025-10-01 Price Changed $159,000 GSREIN
- 2025-08-27 Listed $169,000 AcadianaMLS
- 2020-10-07 Price Changed $149,999 GSREIN
- 2020-08-09 Listed $149,999 AcadianaMLS
- 2020-04-30 Price Changed $159,900 GSREIN
- 2020-03-13 Price Changed $165,000 GSREIN
- 2020-02-10 Price Changed $160,000 GSREIN
- 2020-01-16 Price Changed $169,000 GSREIN
- 2019-11-13 Price Changed $175,000 GSREIN
- 2019-10-18 Listed $159,900 AcadianaMLS
- 2013-11-05 Sold (MLS) $30,000 GSREIN
- 2013-05-07 Listed $31,000 AcadianaMLS
- 2013-05-07 Listed $31,000 GSREIN
- 2012-10-22 Sold (Public Records) $25,000 Public Records
- 1995-04-18 Sold (Public Records) $25,000 Public Records
Property tax history
+8.4%/yrLatest (2026): $2,339 · +1.3% YoY. Source: county tax records.
Cash-flow waterfall
monthlySold comps — $/sqft
last 12 mo · ≤1 miLoading sold comps…