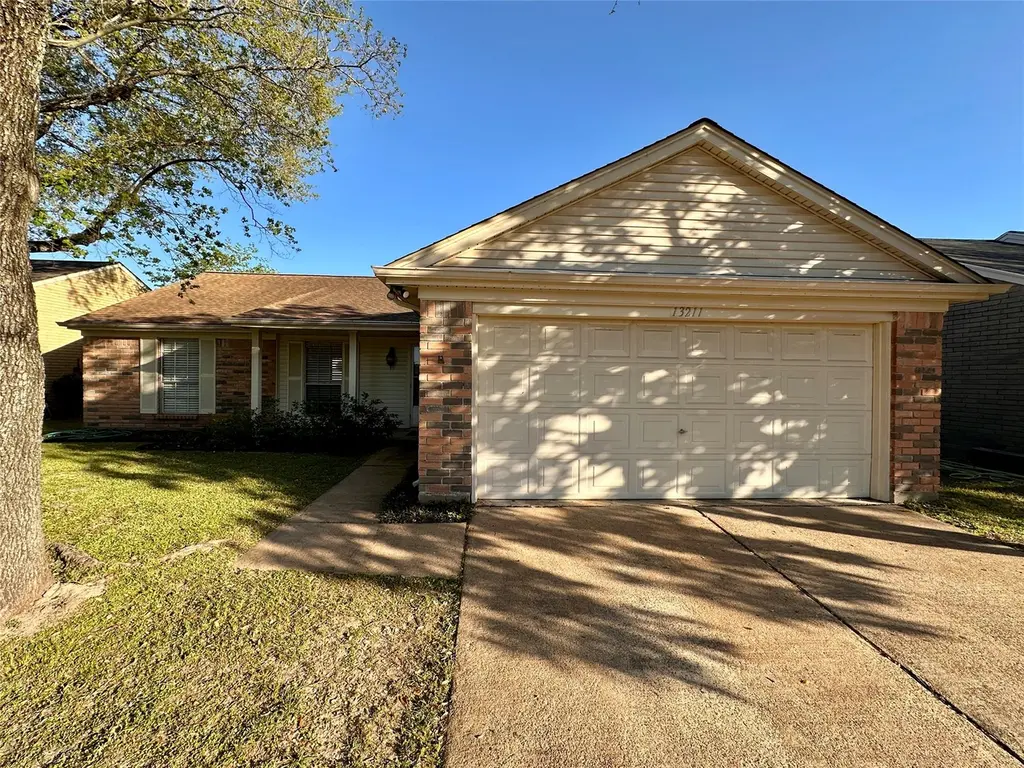
13211 Harpers Bridge Dr · Houston, TX
Flood risk 4/10 · Minor
- FEMA flood zone
- X (unshaded)
- Chance of flooding over 30 yrs
- 0.22%
- Est. flood insurance / yr
- $507 – $1,088
Fire risk 2/10 · Minimal
- Est. fire insurance / yr
- $1,222 – $2,270
Heat risk 9/10 · Severe
- Hot days now (above 110°F)
- 7 days/yr
- Hot days in 30 yrs
- 23 days/yr
Wind risk 9/10 · Severe
- Chance of severe wind over 30 yrs
- 99.0%
Air-quality risk 3/10 · Minor
- Unhealthy air days now
- 2 days/yr
- Unhealthy air days in 30 yrs
- 3 days/yr
Risk factors via First Street. Map © Google.
Why this score? — see what drove the D+ grade
The composite is a weighted blend of 9 inputs, each scored 0–100. Each bar is that input's sub-score; the figure is the points it added to the 100-point composite (weight × sub-score).
- ARV discount +11.7/15.0
- Cash flow +9.6/30.0
- Schools +4.4/10.0
- Appreciation +4.3/10.0
- 1% rule +3.7/10.0
- Livability +3.7/5.0
- DSCR +2.7/10.0
- Rent growth +2.6/5.0
- Condition / age +2.5/5.0
$210,000
🖨 Deal sheet 📄 Offer letter ✓ Due diligence
Listing remarks
Charming home nestled in a quiet neighborhood surrounded by lush greenery. This well-maintained property features a covered patio and a spacious beautiful private backyard—perfect for relaxing or entertaining. The living room offers tiled flooring and a vaulted ceiling, creating an open and airy feel. Conveniently located near Hwy 6 and 290, providing easy access to major highways, shopping centers, and nearby restaurants. Available for move-in after July.
Key facts
- Tiled flooring
- Private backyard
- Vaulted ceiling
Tags
Neighborhood map
What this means for you Summary
Snapshot
- This is a 3-bed/2.0-bath single-family listed at $210k.
Deal economics
- At list price, monthly cash flow is $-142 ($-2k/yr) — negative.
- To cash-flow at today's rent, offer at most $185k (12.0% below list).
- To meet the 1% rule (rent ≥ 1% of price), the offer needs to be $183k (13.0% below list).
- Recommended offer: $183k (13.0% below list) — sets the bar for 1% rule.
- Cap rate 5.5% vs local median 3.2% in Houston — top-decile yield for the area; either an underpriced asset or a hidden risk that comps aren't pricing in. Stress-test before assuming the spread holds.
Location & tenants
- Location reads 74/100 on livability (#184 in TX, #4,771 nationally) — a middle-class / working-renter tenant base. Strengths: amenities A+, cost of living A+, housing A+; Watch: crime F.
- Cypress-Fairbanks ISD (suburban): math 45% / reading 52% proficiency, ranked #161 of 826 in TX (top 20%) — families likely to look elsewhere, expect single-tenant / working-renter base with shorter leases.
- Zoned schools: Truitt Middle (math 34% / reading 41%, grade F, #736 of 1,662 statewide, top 45%, 1,419 students, 76% FRL); Cypress Ridge H S (math 45% / reading 53%, grade D, #553 of 1,632 statewide, top 34%, 2,921 students, 76% FRL) — zoned schools average 76% FRL vs 43% district-wide (33 pts higher); higher-poverty schools than district average — tighter screening recommended.
- Market conditions: Rents flat; 171 active listings in the ZIP; 6 comparable units currently listed for rent nearby; rentals at typical pace (median 20d on market — plan ~3-4 weeks tenant-placement turnaround); solid renter incomes; 29,883 units permitted in Harris County in 2024 (8,621 in 5+ unit buildings).
Forward outlook
- Local home prices are declining (-1.5%/yr); year-one equity from $1k of loan paydown is wiped out by about $3k of value loss. Plan a longer hold.
- Harris County population projected at +47% by 2050 — long-run rental-demand tailwind backs the buy-and-hold thesis.
Negotiation context
- Only 11 days on market — expect competitive offers; lowballing is unlikely to land.
Risks & watch-outs
- Climate carrying-cost: severe wind risk, 99% chance of damaging wind over 30y; extreme-heat days projected 7→23/yr by 2055 (HVAC capex compounding) — expect insurance premiums to compound above CPI over the hold.
Questions for the listing agent
- What do current leases actually rent for vs. the listed asking? Can we see a recent rent roll and the last 12 months of T-12 income?
- What does the HOA fee cover, when was the last increase, and are there any pending special assessments or reserve-fund shortfalls?
- Is there a deadline driving the sale (1031 exchange, divorce, estate, relocation)? That informs how much negotiation room exists.
- Schools are D-rated, which usually means shorter tenancies and higher turnover. Who's the typical renter profile here, and what's been the actual vacancy rate?
- Crime grade is F in this area — have there been break-ins, vandalism, or insurance claims at this property in the last 3 years? What carrier currently insures it and at what premium?
- The area grade is low — what's the realistic commute time and amenity access for the typical tenant pool here? Any planned neighborhood developments (good or bad) we should know about?
- What's the average days-on-market for RENTAL listings here right now (not sales)? A rising rental-DOM trend means longer vacancies and softer asking-rent achievability than the comps imply.
- What's the recent tenant-quality profile in this submarket — average credit score on applications, eviction rate, late-payment / NSF rate, and stable-employment percentage? A property-management company in the area should have these aggregated.
- How much new for-sale + rental construction is in the pipeline within 1–3 miles? Heavy new supply typically softens prices + rents 12–24 months out; constrained supply supports both.
Investment metrics
- 1% rule
- 0.87% ✗
- Cap rate
- 5.48%
- Cash-on-cash
- -2.91%
- DSCR
- 0.87
- GRM
- 9.6
CMA / ARV
- ARV (on-the-fly)
- $231,700
- Comps found
- 12
Show comp detail 12 sales within ~0.75 mi
| Address | Dist | Beds/Ba | Sqft | Sold | Price | $/sf | Match |
|---|---|---|---|---|---|---|---|
| 13303 Klamath Falls Dr | 0.12mi | 3/2.0 | 1,284 (-3%) | 11mo | $239,777 | $187 | 80 |
| 13502 Wells River Dr | 0.40mi | 3/2.0 | 1,360 (+3%) | 1mo | $210,000 | $154 | 76 |
| 13331 Harpers Bridge Dr | 0.18mi | 3/2.0 | 1,440 (+9%) | 4mo | $259,900 | $180 | 73 |
| 6118 Alstead Dr | 0.43mi | 3/2.0 | 1,360 (+3%) | 3mo | $175,000 | $129 | 73 |
| 13327 Harpers Bridge Dr | 0.16mi | 4/2.5 (+1) | 1,400 (+6%) | 4mo | $256,999 | $184 | 72 |
| 13311 Klamath Falls Dr | 0.14mi | 3/2.0 | 1,284 (-3%) | 22mo | $224,900 | $175 | 70 |
| 13519 Bridgepath Cv | 0.38mi | 3/2.0 | 1,412 (+7%) | 14mo | $235,000 | $166 | 60 |
| 13506 Bridgepath Cv | 0.34mi | 3/2.0 | 1,203 (-9%) | 12mo | $245,000 | $204 | 59 |
| 5714 Wynberry Dr | 0.41mi | 3/2.0 | 1,410 (+6%) | 19mo | $209,900 | $149 | 54 |
| 13511 Lyndonville Dr | 0.44mi | 3/2.0 | 1,520 (+15%) | 5mo | $285,000 | $188 | 51 |
| 6247 Bryant Pond Dr | 0.58mi | 3/2.0 | 1,520 (+15%) | 4mo | $211,000 | $139 | 45 |
| 13315 Somersworth Dr | 0.35mi | 2/1.0 (-1) | 1,156 (-13%) | 16mo | $199,000 | $172 | 40 |
Match score weights: distance 35% · size 25% · config 20% · recency 20%. Top-matched comps best support the ARV.
Projected returns pro-forma
-1.47% appreciation · 0.25% rent growth · sell at horizon
- IRR
- -14.4%
- Equity multiple
- 0.42×
- Total profit
- $-34,099
- Equity at exit
- $45,999
- IRR
- -10.7%
- Equity multiple
- 0.19×
- Total profit
- $-47,372
- Equity at exit
- $44,408
Cash invested: $58,800 (down + closing). Projections, not guarantees.
Landlord ↔ Tenant lean methodology
- Overall (STATE)
- 87 Strongly Landlord-Friendly
- State Texas
- 87 Strongly Landlord-Friendly · R+5
- County
- — inherits STATE
- City
- — inherits STATE
ZIP-level market 77041
- Home prices YoY
- -0.6%
- Rents YoY
- 0.2%
- Active inventory
- 171
- Price-to-rent
- 9.6×
Monthly cashflow live
- Estimated rent
- $1,827 high interval (Pro) →
- Mortgage (P&I)
- −$1,101
- Tax from tax record
- −$357 /mo · $4,281/yr
- Insurance
- −$88
- HOA
- −$40
- Vacancy / Maint / Mgmt
- −$384
- Net cashflow
- $-142
Break-even live
UW: 25.0% down · 7.5% · 30yr · 1.5% tax · 5.0% vac · 8.0% maint · 8.0% mgmt
Financing live
Cash to close
- Down payment
- $52,500
- Closing costs
- $6,300
- Reserves months
- —
- Total cash needed
- —
Loan-product check · same deal, 3 products live
Conventional
25% down · 7.5% · 30yr
- Down + closing
- —
- Monthly P&I
- —
- Monthly cashflow
- —
- DSCR
- —
- Eligible?
- —
Personal DTI + credit; lowest rate.
DSCR
20% down · 8.5% · 30yr
- Down + closing
- —
- Monthly P&I
- —
- Monthly cashflow
- —
- DSCR
- —
- Eligible?
- —
No personal income docs; deal must DSCR.
Hard money
10% down · 12.0% · 12mo
- Down + closing
- —
- Monthly P&I
- —
- Monthly cashflow
- —
- DSCR
- —
- Eligible?
- —
Short-term bridge; refi at stabilization.
Rent comps 6 comps
| Address | Beds | Baths | Sqft | Rent | $/sqft | DOM | Units | Dist |
|---|---|---|---|---|---|---|---|---|
| 6103 Wolfboro Dr Houston, TX | 3.0 | 2.0 | 1440 | $1,745 | $1.21 | 24d | 1 | 0.23mi |
| 12410 W Little York Rd Houston, TX | 1.0–3.0 | 1.0–2.0 | 1147 | $1,779 | $1.55 | 1d | 16 | 1.08mi |
| 12416 W Little York Rd Houston, TX | 2.0 | 2.0 | 1235 | $1,489 | $1.21 | 22d | 1 | 1.12mi |
| 12416 W Little York Rd Houston, TX | 3.0 | 2.0 | 1542 | $1,849 | $1.20 | 19d | 1 | 1.12mi |
| 12416 W Little York Rd Houston, TX | 2.0 | 2.0 | 1235 | $1,489 | $1.21 | 17d | 1 | 1.12mi |
| 12416 W Little York Rd Houston, TX | 3.0 | 2.0 | 1542 | $1,849 | $1.20 | 18d | 1 | 1.12mi |
HOA detail
- Monthly dues
- $40 · $480/yr
Listing history 4 events
-
2026-04-03status Pending
-
2026-03-23$210,000 Active
-
2004-04-20soldstatus
-
1988-01-02soldstatus
ⓘ Source: listings_history table (triggers on properties + properties_extension) + one-shot
backfill from property_details.listing_events for pre-trigger history.
Tax reassessment forecast TX · Resets to sale price
- Current annual tax
- $4,281 · $357/mo
- Projected year-2 tax
- $4,281 · $357/mo
- Expected delta
- $0/yr ($0/mo · 0.0%)
ⓘ Screening estimate from a state-policy table — verify with the county assessor before closing.
Climate risk First Street
- Flood 4/10 Moderate FEMA zone X (unshaded) · 22% chance over 30 yrs
- Wildfire 2/10 Low
- Heat 9/10 Extreme 7 d/yr ≥110°F today · 23 d/yr by 30 yrs out
- Wind 9/10 Extreme 99% chance of damaging wind over 30 yrs
- Air quality 3/10 Moderate 2 unhealthy d/yr today · 3 by 30 yrs out
Nearby sold comps map
Loading sold comps map…
Walkable amenities ~0.75 mi
Loading nearby amenities…
Taxation est. · year 1
- Rental income
- $21,921
- − Mortgage interest
- −$11,763
- − Property taxes
- −$4,281
- − Insurance
- −$1,050
- − Repairs & maintenance
- −$1,754
- − Management
- −$1,754
- − HOA
- −$480
- − Depreciation
- −$6,109
- Taxable loss
- −$5,269
- Est. tax savings @ 24.0%
- +$1,265
- After-tax cash flow
- $-444/yr
For passive investors: Depreciation is non-cash, so a rental often shows a tax loss while cash-flowing — sheltering income. Rental losses are passive: they offset passive income freely, and up to $25,000/yr can offset ordinary (W-2) income if you actively participate and your MAGI is under $100k (phasing out to $0 by $150k); unused losses carry forward. On sale, claimed depreciation is recaptured at up to 25%, and gains may owe capital-gains tax (a 1031 exchange can defer both). Figures are a year-1 estimate at your 24.0% rate — not tax advice; consult a CPA.
Schools (NCES district)
- District
- Cypress-Fairbanks ISD
- NCES district ID
- 4816110
- Math proficiency
- 45% ▼ -12.00%
- Reading proficiency
- 52% ▼ -2.00%
- Median HH income
- $72,025
- Composite
- 43.63/100
- National rank
- #2968
- State rank
- #161 of 826 in TX
Livability — Houston
- Score
- 74/100
- State rank
- #184
- US rank
- #4771
Category grades
Schools grade is shown separately in the Schools card above.
Census & demographics
- County
- Harris County · 4,702,590 people
- City population
- 3,226,434
- Metro
- Houston-The Woodlands-Sugar Land, TX
- Population (ZIP)
- 33,349
- Household income
- $77,083
- Rent vs Own
- Severe rent burden
- 537.0
Population outlook (Harris County) Hauer SSP2
- Today (2025)
- 5,571,493 people
- By 2030
- 6,089,821 · +9.3%
- By 2040
- 7,142,806 · +28.2%
- By 2050
- 8,185,864 · +46.9%
- By 2075
- 10,574,329 · +89.8%
- By 2100
- 12,109,958 · +117.4%
Race, ethnicity, and origin ACS 2023
- Neighborhood character
- Diverse neighborhood (Simpson 0.67)
- Race & ethnicity
- Hispanic / Latino 50% Two or more races 25% White 23% Asian 16% Black 9% Native American 3%
- Hispanic origin (detail)
- Mexican 36% Cuban 2% Salvadoran 1%
- Common ancestry
- Italian 1% Portuguese 1% Romanian 1%
- Foreign-born
- 38% · Canada, Vietnam, China
- Languages at home
- 45% English-only · Spanish 39% Vietnamese 8% Other Indo-European 3%
Political lean MEDSL · Harris
- 2024 margin
- Lean D (+5.5) · D 52.0% · R 46.4% · Other 1.6%
- 2008→2024 swing
- +3.9pp toward D · 2008: 1.6pp · 2024: 5.5pp
- All cycles
- 2024: D+5.5 2020: D+13.3 2016: D+12.4 2012: D+0.1 2008: D+1.6
Not yet ingested
- Civics
- —
Market trends
- HPI YoY
- ▼ -1.47%
- Current HPI
- 241.5096
- Rent YoY
- ▲ 0.25%
- Metro
- Houston-The Woodlands-Sugar Land, TX
- State GDP YoY
- ▲ 3.95%
- F500 in state
- 110
Industry mix (Fortune 500 HQ in TX)
| Industry | F500 HQs | Revenue |
|---|---|---|
| Energy | 16 | $1,198B |
|
||
| Technology | 5 | $198B |
|
||
| Engineering / Construction | 4 | $72B |
|
||
| Energy Services | 3 | $60B |
|
||
| Utilities | 3 | $41B |
|
||
| Healthcare | 2 | $330B |
|
||
Price history
4 events — show timeline
- 2026-04-03 Pending — HARMLS
- 2026-03-23 Listed $210,000 HARMLS
- 2004-04-20 Sold (Public Records) — Public Records
- 1988-01-02 Sold (Public Records) — Public Records
Property tax history
+2.5%/yrLatest (2025): $4,281 · -1.1% YoY. Source: county tax records.
Cash-flow waterfall
monthlySold comps — $/sqft
last 12 mo · ≤1 miLoading sold comps…